

The DOI matches its Crossref record; 30 of the 30 references it cites were found in a registry or an index.
IHC Profiler: An Open Source Plugin for the Quantitative Evaluation and Automated Scoring of Immunohistochemistry Images of Human Tissue Samples
Open accessAbstract
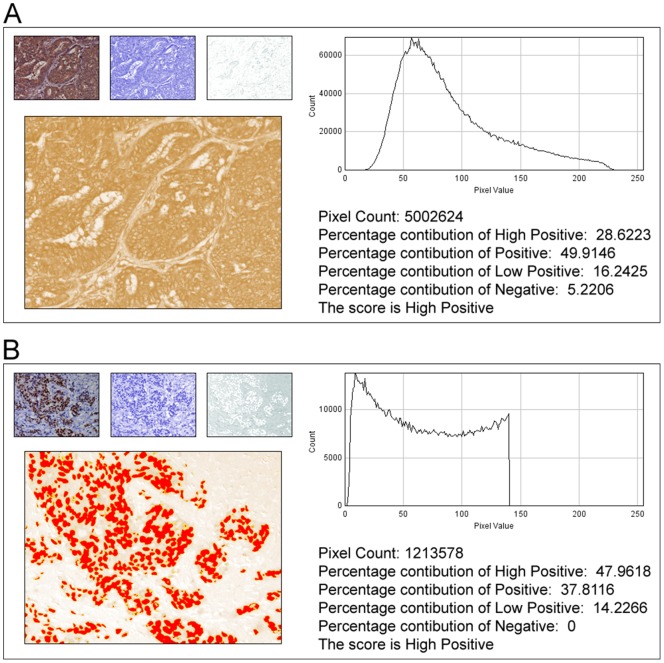
In anatomic pathology, immunohistochemistry (IHC) serves as a diagnostic and prognostic method for identification of disease markers in tissue samples that directly influences classification and grading the disease, influencing patient management. However, till today over most of the world, pathological analysis of tissue samples remained a time-consuming and subjective procedure, wherein the intensity of antibody staining is manually judged and thus scoring decision is directly influenced by visual bias. This instigated us to design a simple method of automated digital IHC image analysis algorithm for an unbiased, quantitative assessment of antibody staining intensity in tissue sections. As a first step, we adopted the spectral deconvolution method of DAB/hematoxylin color spectra by using optimized optical density vectors of the color deconvolution plugin for proper separation of the DAB color spectra. Then the DAB stained image is displayed in a new window wherein it undergoes pixel-by-pixel analysis, and displays the full profile along with its scoring decision. Based on the mathematical formula conceptualized, the algorithm is thoroughly tested by analyzing scores assigned to thousands (n = 1703) of DAB stained IHC images including sample images taken from human protein atlas web resource. The IHC Profiler plugin developed is compatible with the open resource digital image analysis software, ImageJ, which creates a pixel-by-pixel analysis profile of a digital IHC image and further assigns a score in a four tier system. A comparison study between manual pathological analysis and IHC Profiler resolved in a match of 88.6% (P<0.0001, CI = 95%). This new tool developed for clinical histopathological sample analysis can be adopted globally for scoring most protein targets where the marker protein expression is of cytoplasmic and/or nuclear type. We foresee that this method will minimize the problem of inter-observer variations across labs and further help in worldwide patient stratification potentially benefitting various multinational clinical trial initiatives.
Overview
The claims and statistics of this paper haven’t been checked yet.
Run the check — free, no account needed. It reads the open-access text and checks the sources it cites.
Integrity signals
Registry
Cites
Statistics
Figures



Verification
Claims the paper makes
The claims and statistics of this paper haven’t been checked yet.
Run the check — free, no account needed. It reads the open-access text and checks the sources it cites.
Claims other papers make about this one
Each is checked against this paper’s own text: does it say what the citing paper says it does?
In the citing paper
“For analysis of c-MYC expression in liver sections, random 20× non-tumor fields of the c-MYC IHC scans from liver sections of individual mice were output using NDP.view2 and blindly analyzed using ImageJ (https://imagej.nih.gov/ij/) with the plugin ‘IHC Profiler’62.”
From Tumor-specific cholinergic CD4+ T lymphocytes guide immunosurveillance of hepatocellular carcinoma (2023) · cites this paper as [62]
Self-check
Percentages, sums and reported differences re-computed from the paper’s own numbers.
The self-check needs the paper’s full text.
Citations
Cites
NIH Image to ImageJ: 25 years of image analysis
Schneider, C. A., Rasband, W. S., & Eliceiri, K. W. (2012) · Nature Methods · doi:10.1038/nmeth.2089 · Cited by 64,638
Hsu, S. M., Raine, L., & Fanger, H. (1981) · Journal of Histochemistry & Cytochemistry · doi:10.1177/29.4.6166661 · Cited by 14,140
Harvey, J. M., Clark, G. M., Osborne, C. K., & Allred, D. C. (1999) · Journal of Clinical Oncology · doi:10.1200/jco.1999.17.5.1474 · Cited by 2,056
Quantification of histochemical staining by color deconvolution.
Ruifrok, A. C. C., & Johnston, D. A. (2001) · PubMed · Cited by 2,029
Tuominen, V. J., Ruotoistenmäki, S., Viitanen, A., Jumppanen, M., & Isola, J. (2010) · Breast Cancer Research · doi:10.1186/bcr2615 · Cited by 472
McCarty, K. S., Szabo, E. M., Flowers, J. L., Cox, E. B., Leight, G. S., Miller, L. A., Konrath, J. G., Jt, S., Budwit, D. A., & Wt, C. (1986) · PubMed · Cited by 417
A global view of protein expression in human cells, tissues, and organs
Pontén, F., Gry, M., Fagerberg, L., Lundberg, E., Asplund, A., Berglund, L., Oksvold, P., Björling, E., Hober, S., Kampf, C., et al. (2009) · Molecular Systems Biology · doi:10.1038/msb.2009.93 · Cited by 222
Automated Selection of DAB-labeled Tissue for Immunohistochemical Quantification
Brey, E. M., Lalani, Z., Johnston, C. M., Wong, M. E.-K., McIntire, L. V., Duke, P. J., & Patrick, C. (2003) · Journal of Histochemistry & Cytochemistry · doi:10.1177/002215540305100503 · Cited by 200
Quantitative image analysis of immunohistochemical stains using a CMYK color model
Pham, N., Morrison, A. J., Schwock, J., Aviel‐Ronen, S., Iakovlev, V. V., Tsao, M., Ho, J., & Hedley, D. W. (2007) · Diagnostic Pathology · doi:10.1186/1746-1596-2-8 · Cited by 179
Quantification of renal pathology by image analysis (Methods in Renal Research)
RANGAN, G. K., & TESCH, G. H. (2007) · Nephrology · doi:10.1111/j.1440-1797.2007.00855.x · Cited by 176
Cited by
Fedchenko, N., & Reifenrath, J. (2014) · Diagnostic Pathology · doi:10.1186/s13000-014-0221-9 · Cited by 808
Lifetime-engineered NIR-II nanoparticles unlock multiplexed in vivo imaging
Fan, Y., Wang, P., Lu, Y., Wang, R., Zhou, L., Zheng, X., Li, X., Piper, J. A., & Zhang, F. (2018) · Nature Nanotechnology · doi:10.1038/s41565-018-0221-0 · Cited by 795
Liu, J., Eckert, M. A., Harada, B. T., Liu, S.-M., Lu, Z., Yu, K., Tienda, S. M., Chryplewicz, A., Zhu, A. C., Yang, Y., et al. (2018) · Nature Cell Biology · doi:10.1038/s41556-018-0174-4 · Cited by 778
Crowe, A., & Yue, W. (2019) · BIO-PROTOCOL · doi:10.21769/bioprotoc.3465 · Cited by 771
Hong, D., Kurzrock, R., Kim, Y., Woessner, R., Younes, A., Nemunaitis, J., Fowler, N., Zhou, T., Schmidt, J., Jo, M., et al. (2015) · Science Translational Medicine · doi:10.1126/scitranslmed.aac5272 · Cited by 445
Metadata
- Authors
- Varghese, F., Bukhari, A. B., Malhotra, R., & De, A.
- Affiliations
- Tata Memorial Hospital (IN)
- Corresponding author
- De, Abhijit
- Venue
- PLoS ONE
- Publisher
- Public Library of Science (PLoS)
- Published
- 2014-05-06
- Volume
- 9
- Issue
- 5
- Pages
- e96801
- ISSN
- 1932-6203 (ISSN-L)
- PMC
- PMC4011881
- OpenAlex
- W1998734250
- Cited by
- 1,318
- References
- 30
- Citations by year
- 2026: 90 · 2025: 129 · 2024: 172 · 2023: 172 · 2022: 171 · 2021: 144 · 2020: 141 · 2019: 101 · 2018: 69 · 2017: 60 · 2016: 44 · 2015: 22 · 2014: 3
- FWCI
- 42.82
- Type
- journal article
- Language
- en
- Open access
- gold
- doi.org
- Locations
- PLoS ONE (publishedVersion, cc-by)
- Europe PMC (PubMed Central) (publishedVersion, cc-by)
- PubMed Central (publishedVersion, cc-by)
- PubMed (publishedVersion)
- RePEc: Research Papers in Economics (submittedVersion)
- DOAJ (DOAJ: Directory of Open Access Journals) (submittedVersion, cc-by-sa)
- Figshare (submittedVersion, cc-by)
- Funders
- Indian Council of Medical Research
- Advanced Centre for Treatment, Research and Education in Cancer
- Topics
- Physical Sciences › Computer Science › Artificial Intelligence › AI in cancer detection
- Life Sciences › Biochemistry, Genetics and Molecular Biology › Biophysics › Cell Image Analysis Techniques
- Physical Sciences › Computer Science › Computer Vision and Pattern Recognition › Digital Imaging for Blood Diseases
- Keywords
- immunohistochemistry image analysis, automated grading, ImageJ plugin, interobserver variability, digital pathology, human tissue samples, protein expression profiling
- MeSH terms
- Automation, Cell Nucleus, Cytoplasm, Humans, Image Processing, Computer-Assisted, Immunohistochemistry, Neoplasms, Software, Biomarkers, Tumor
About these checks
Registry, retraction, Cites and statistics results are computed, not judged, with one exception: a printed reference that no index lists is read once by a model before it counts as a citation error. Claims are extracted by a model and kept only when their quote appears verbatim in the text; each cited source is then checked, with a model’s help, for whether it says what the claim relies on. Those verdicts can be wrong — read the claim’s quote and the cited source before relying on one.
Statistics and arithmetic are recomputed, not judged.
Confidence bands are shown only for fields calibrated on our annotated test set. None is calibrated yet, so no band is shown.
What counts as a claim ›How we measure confidence ›How we check this ›
Are you an author, or do you see a problem with this page? Request a review
How to cite
Cite CoChat for the checks on this page, and the paper for its own findings.
- This page
- CoChat. (2026). Citation check: IHC Profiler: An Open Source Plugin for the Quantitative Evaluation and Automated Scoring of Immunohistochemistry Images of Human Tissue Samples. https://app.cochat.ai/papers/10.1371/journal.pone.0096801
- The paper
- Varghese, F., Bukhari, A. B., Malhotra, R., & De, A. (2014). IHC Profiler: An Open Source Plugin for the Quantitative Evaluation and Automated Scoring of Immunohistochemistry Images of Human Tissue Samples. PLoS ONE. https://doi.org/10.1371/journal.pone.0096801
Data sources
Bibliographic data: Semantic Scholar, OpenAlex, Crossref.
Contains information from the Semantic Scholar Academic Graph Datasets, made available under the ODC Attribution License (ODC-BY 1.0).
Semantic Scholar’s data is described in: Kinney, R., et al. (2023). The Semantic Scholar Open Data Platform. arXiv:2301.10140.
