

Movement Coordination during Conversation
Open accessThe DOI matches its Crossref record; 69 of the 70 references it cites were found in a registry or an index.
Abstract
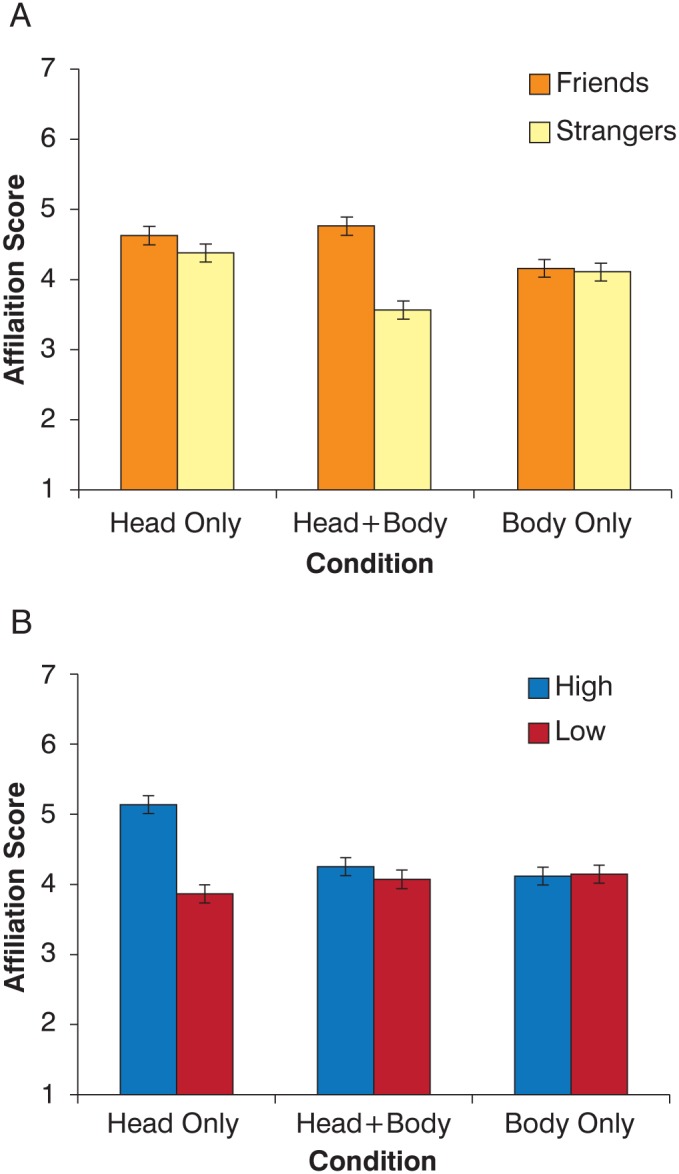
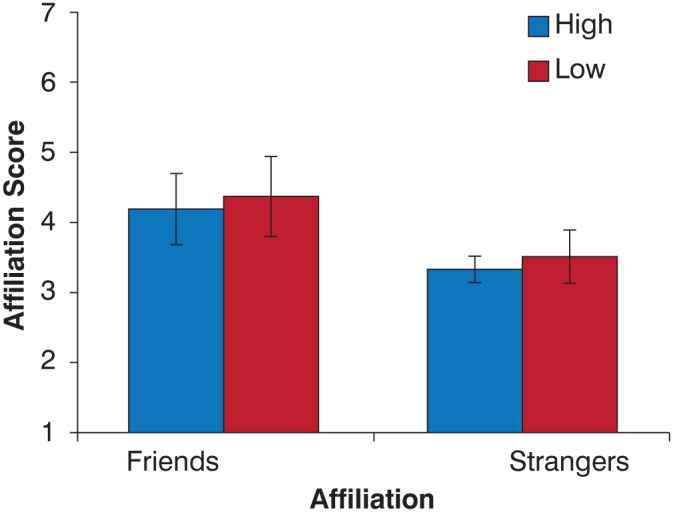
Behavioral coordination and synchrony contribute to a common biological mechanism that maintains communication, cooperation and bonding within many social species, such as primates and birds. Similarly, human language and social systems may also be attuned to coordination to facilitate communication and the formation of relationships. Gross similarities in movement patterns and convergence in the acoustic properties of speech have already been demonstrated between interacting individuals. In the present studies, we investigated how coordinated movements contribute to observers' perception of affiliation (friends vs. strangers) between two conversing individuals. We used novel computational methods to quantify motor coordination and demonstrated that individuals familiar with each other coordinated their movements more frequently. Observers used coordination to judge affiliation between conversing pairs but only when the perceptual stimuli were restricted to head and face regions. These results suggest that observed movement coordination in humans might contribute to perceptual decisions based on availability of information to perceivers.
Overview
The claims and statistics of this paper haven’t been checked yet.
Free: it reads the open-access text and checks the first 5 claims that cite a source we can check. Create a free account to check every claim.
Integrity signals
Registry
Cites
Statistics
Figures
Verification
Claims the paper makes
The claims and statistics of this paper haven’t been checked yet.
Free: it reads the open-access text and checks the first 5 claims that cite a source we can check. Create a free account to check every claim.
Claims other papers make about this one
Each is checked against this paper’s own text: does it say what the citing paper says it does?
The source backs part of the claim, not all of it — or backs it for a different population, condition or comparison.
In the citing paper
“As behavioral synchrony is linked with attachment status, with couples and close friends expressing more synchrony than strangers26,34, it is reasonable to expect that romantic partners in a long-term relationship would display more behavioral and neural synchrony as compared to strangers and that neural synchrony would localize to temporo-parietal areas.”
From Brain-to-Brain Synchrony during Naturalistic Social Interactions (2017) · cites this paper as [34]
Experimental — accuracy not yet measured
Self-check
Percentages, sums and reported differences re-computed from the paper’s own numbers.
The self-check needs the paper’s full text.
Citations
Cites
Horn, B. K. P., & Schunck, B. G. (1981) · Artificial Intelligence · doi:10.1016/0004-3702(81)90024-2 · Cited by 10,312
Horn, B. K., & Schunck, B. G. (1981) · SPIE Proceedings · doi:10.1117/12.965761 · Cited by 7,394
Clark, H. H. (1996) · doi:10.1017/cbo9780511620539 · Cited by 5,123
The chameleon effect: the perception–behavior link and social interaction
Chartrand, T. L., & Bargh, J. A. (1999) · Journal of Personality and Social Psychology · doi:10.1037/0022-3514.76.6.893 · Cited by 3,674
The Geometry of Biological Time
Winfree, A. T. (1980) · doi:10.1007/978-3-662-22492-2 · Cited by 3,613
Using language: Communicative acts
Clark, H. H. (1996) · Cited by 2,721
Using language: Index of names
Clark, H. H. (1996) · Cited by 2,720
Social perception from visual cues: Role of the STS region
Allison, T., Puce, A., & McCarthy, G. (2000) · Trends in Cognitive Sciences · doi:10.1016/s1364-6613(00)01501-1 · Cited by 2,461
Klin, A., Jones, W., Schultz, R., Volkmar, F., & Cohen, D. (2002) · Archives of General Psychiatry · doi:10.1001/archpsyc.59.9.809 · Cited by 2,120
Wiltermuth, S. S., & Heath, C. (2009) · Psychological Science · doi:10.1111/j.1467-9280.2008.02253.x · Cited by 1,717
Research works printed but not linked: 2
- E Birmingham, 2008, Gaze selection in complex social scenes, Vis Cogn, 16(2–3), 341, 10.1080/13506280701434532 · DOI · Paper page
- Hay J, Jannedy S, Mendoza-Denton N (1999) Oprah and /ay/: Lexical frequency, referee design and style. Proc. Int. Cong. Phon. Sci., 14th, San Francisco: 1389–1392.
Cited by
Brain-to-Brain Synchrony during Naturalistic Social Interactions
Kinreich, S., Djalovski, A., Kraus, L., Louzoun, Y., & Feldman, R. (2017) · Scientific Reports · doi:10.1038/s41598-017-17339-5 · Cited by 402
Kupper, Z., Ramseyer, F., Hoffmann, H., & Tschacher, W. (2015) · PLoS ONE · doi:10.1371/journal.pone.0145882 · Cited by 146
Sync or sink? Interpersonal synchrony impacts self-esteem
Lumsden, J., Miles, L. K., & Macrae, C. N. (2014) · Frontiers in Psychology · doi:10.3389/fpsyg.2014.01064 · Cited by 118
“…employed here, have been extensively advocated in previous research in order to eliminate potential biases that can occur when relying on subjective ratings of coordination (e.g., Lumsden et al., 2012a; Paxton and Dale, 2012; Schmidt et al., 2012; Latif et al., 2014; Stevenson Won et al., 2014).”
MethodInterpersonal Coordination: Methods, Achievements, and Challenges
Cornejo, C., Cuadros, Z., Morales, R., & Mayor, J. P. (2017) · Frontiers in Psychology · doi:10.3389/fpsyg.2017.01685 · Cited by 127
Georgescu, A. L., Koeroglu, S., Hamilton, A. F. D. C., Vogeley, K. T., Falter, C. M., & Tschacher, W. (2020) · Molecular Autism · doi:10.1186/s13229-019-0305-1 · Cited by 136
Metadata
- Authors
- Latif, N., Barbosa, A. V., Vatiokiotis-Bateson, E., Castelhano, M. S., & Munhall, K. G.
- Affiliations
- Queen's University (CA)
- Universidade Federal de Minas Gerais (BR)
- Corresponding author
- Latif, Nida
- Venue
- PLoS ONE
- Publisher
- Public Library of Science (PLoS)
- Published
- 2014-08-13
- Volume
- 9
- Issue
- 8
- Pages
- e105036
- ISSN
- 1932-6203 (ISSN-L)
- PMC
- PMC4132081
- OpenAlex
- W2071671593
- Cited by
- 72
- References
- 70
- Citations by year
- 2026: 4 · 2025: 4 · 2024: 3 · 2023: 7 · 2022: 9 · 2021: 10 · 2020: 11 · 2019: 8 · 2018: 5 · 2017: 7 · 2016: 1 · 2015: 2 · 2014: 1
- FWCI
- 5.42
- Type
- journal article
- Language
- en
- Update notices
- correction (2014-11-06)
- Open access
- gold
- doi.org
- Locations
- PLoS ONE (publishedVersion, cc-by)
- Europe PMC (PubMed Central) (publishedVersion, cc-by)
- PubMed Central (publishedVersion, cc-by)
- PubMed (publishedVersion)
- DOAJ (DOAJ: Directory of Open Access Journals) (submittedVersion)
- Funders
- Queen's University
- Natural Sciences and Engineering Research Council of Canada
- Topics
- Social Sciences › Psychology › Social Psychology › Action Observation and Synchronization
- Social Sciences › Arts and Humanities › Language and Linguistics › Language, Discourse, Communication Strategies
- Social Sciences › Psychology › Experimental and Cognitive Psychology › Evolutionary Psychology and Human Behavior
- Keywords
- motor coordination, social perception, interpersonal communication, social bonding
- MeSH terms
- Adult, Female, Humans, Interpersonal Relations, Kinesics, Language, Male, Movement, Perception, Speech, Recognition, Psychology, Friends, Young Adult
About these checks
Registry, retraction, Cites and statistics results are computed, not judged, with one exception: a printed reference that no index lists is read once by a model before it counts as a citation error. Claims are extracted by a model and kept only when their quote appears verbatim in the text; each cited source is then checked, with a model’s help, for whether it says what the claim relies on. Those verdicts can be wrong — read the claim’s quote and the cited source before relying on one.
Statistics and arithmetic are recomputed, not judged.
Confidence bands are shown only for fields calibrated on our annotated test set. None is calibrated yet, so no band is shown.
What counts as a claim ›How we measure confidence ›How we check this ›
Are you an author, or do you see a problem with this page? Request a review
How to cite
Cite CoChat for the checks on this page, and the paper for its own findings.
- This page
- CoChat. (2026). Citation check: Movement Coordination during Conversation. https://app.cochat.ai/papers/10.1371/journal.pone.0105036
- The paper
- Latif, N., Barbosa, A. V., Vatiokiotis-Bateson, E., Castelhano, M. S., & Munhall, K. G. (2014). Movement Coordination during Conversation. PLoS ONE. https://doi.org/10.1371/journal.pone.0105036
Data sources
Bibliographic data: Semantic Scholar, OpenAlex, Crossref.
Contains information from the Semantic Scholar Academic Graph Datasets, made available under the ODC Attribution License (ODC-BY 1.0).
Semantic Scholar’s data is described in: Kinney, R., et al. (2023). The Semantic Scholar Open Data Platform. arXiv:2301.10140.
