Cited by 149Metabolism, Diabetes, and CancerCancer, Hypoxia, and MetabolismPI3K/AKT/mTOR signaling in cancer

The DOI matches its Crossref record; 42 of the 42 references it cites were found in a registry or an index.

Mechanisms by Which Low Glucose Enhances the Cytotoxicity of Metformin to Cancer Cells Both In Vitro and In Vivo

Open access

Abstract

Different cancer cells exhibit altered sensitivity to metformin treatment. Recent studies suggest these findings may be due in part to the common cell culture practice of utilizing high glucose, and when glucose is lowered, metformin becomes increasingly cytotoxic to cancer cells. In low glucose conditions ranging from 0 to 5 mM, metformin was cytotoxic to breast cancer cell lines MCF7, MDAMB231 and SKBR3, and ovarian cancer cell lines OVCAR3, and PA-1. MDAMB231 and SKBR3 were previously shown to be resistant to metformin in normal high glucose medium. When glucose was increased to 10 mM or above, all of these cell lines become less responsive to metformin treatment. Metformin treatment significantly reduced ATP levels in cells incubated in media with low glucose (2.5 mM), high fructose (25 mM) or galactose (25 mM). Reductions in ATP levels were not observed with high glucose (25 mM). This was compensated by enhanced glycolysis through activation of AMPK when oxidative phosphorylation was inhibited by metformin. However, enhanced glycolysis was either diminished or abolished by replacing 25 mM glucose with 2.5 mM glucose, 25 mM fructose or 25 mM galactose. These findings suggest that lowering glucose potentiates metformin induced cell death by reducing metformin stimulated glycolysis. Additionally, under low glucose conditions metformin significantly decreased phosphorylation of AKT and various targets of mTOR, while phospho-AMPK was not significantly altered. Thus inhibition of mTOR signaling appears to be independent of AMPK activation. Further in vivo studies using the 4T1 breast cancer mouse model confirmed that metformin inhibition of tumor growth was enhanced when serum glucose levels were reduced via low carbohydrate ketogenic diets. The data support a model in which metformin treatment of cancer cells in low glucose medium leads to cell death by decreasing ATP production and inhibition of survival signaling pathways. The enhanced cytotoxicity of metformin against cancer cells was observed both in vitro and in vivo.

Overview

The claims and statistics of this paper haven’t been checked yet.

Run the check — free, no account needed. It reads the open-access text and checks the sources it cites.

A few free checks a day · papers already verified open instantly · results are public

Integrity signals

Registry

Crossref · 10.1371/journal.pone.0108444

Cites

42 of 42 references verified0 citation errors · 0 not checkable

Statistics

Figures

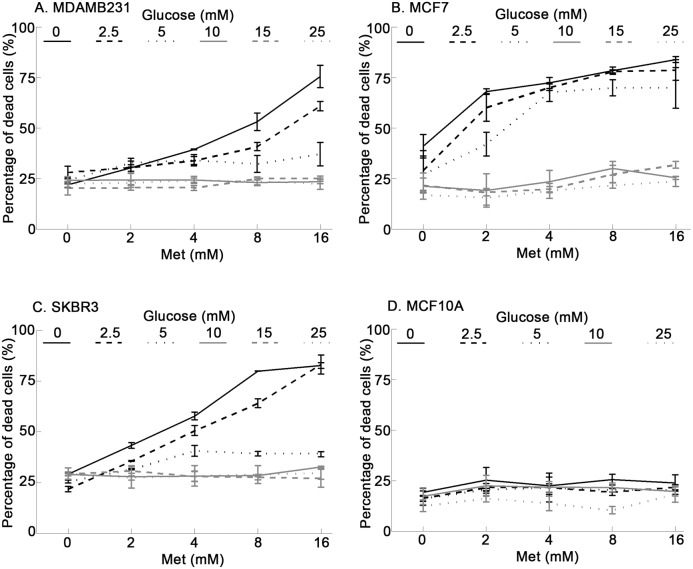
Figure 1 Reduction of glucose in the culture medium sensitizes breast cancer cells to metformin treatment but not human mammary epithelial MCF10A cells. All cells were treated with different concentrations of metformin (0, 2, 4, 8, 16 mM) in medium containing different levels of glucose (0, 2.5, 5, 10, 15, 25 mM) for one day. Percentage of dead cells was determined using Sytox Green staining. Metformin significantly increased percentage of dead cells with decreasing glucose concentration in (A) MDAMB231 cells, (B) MCF7 cells, and (C) SKBR3 cells but not in (D) MCF10A cells. Data were presented as mean ± standard deviation.
Figure 1 Reduction of glucose in the culture medium sensitizes breast cancer cells to metformin treatment but not human mammary epithelial MCF10A cells. All cells were treated with different concentrations of metformin (0, 2, 4, 8, 16 mM) in medium containing different levels of glucose (0, 2.5, 5, 10, 15, 25 mM) for one day. Percentage of dead cells was determined using Sytox Green staining. Metformin significantly increased percentage of dead cells with decreasing glucose concentration in (A) MDAMB231 cells, (B) MCF7 cells, and (C) SKBR3 cells but not in (D) MCF10A cells. Data were presented as mean ± standard deviation.CC BY · PubMed Central
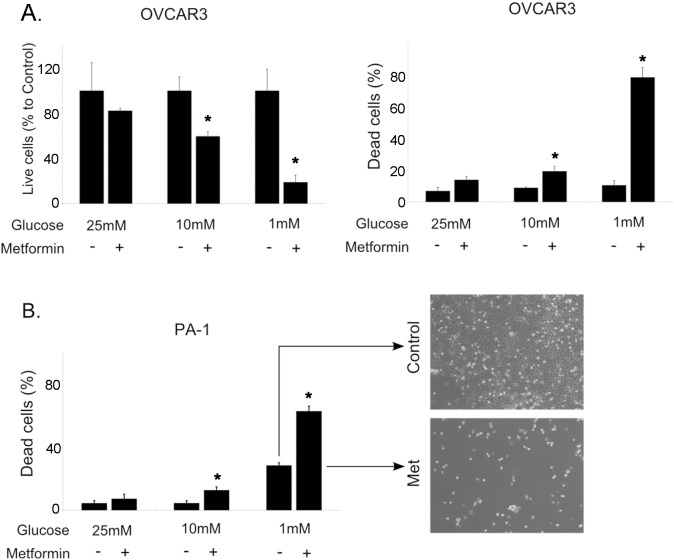
Figure 2 Metformin treatment of ovarian cancer cells is enhanced by low glucose conditions. A. After 48 hour treatments with metformin (5 mM, +) or control vehicle (H2O, –), live OVCAR3 cell number was determined by counting trypan blue negative cells and dead cell number was determined by counting trypan blue positive cells. B. PA-1 cell death was determined as described in A. Phase contrast images (40x) of the cells cultured with (lower image) or without (upper image) metformin treatment. Bar graphs represented mean ± standard deviation. All metformin treated groups in medium containing low glucose (1 mM) were significantly different from their control groups. *Indicates significant difference between groups.
Figure 2 Metformin treatment of ovarian cancer cells is enhanced by low glucose conditions. A. After 48 hour treatments with metformin (5 mM, +) or control vehicle (H2O, –), live OVCAR3 cell number was determined by counting trypan blue negative cells and dead cell number was determined by counting trypan blue positive cells. B. PA-1 cell death was determined as described in A. Phase contrast images (40x) of the cells cultured with (lower image) or without (upper image) metformin treatment. Bar graphs represented mean ± standard deviation. All metformin treated groups in medium containing low glucose (1 mM) were significantly different from their control groups. *Indicates significant difference between groups.CC BY · PubMed Central
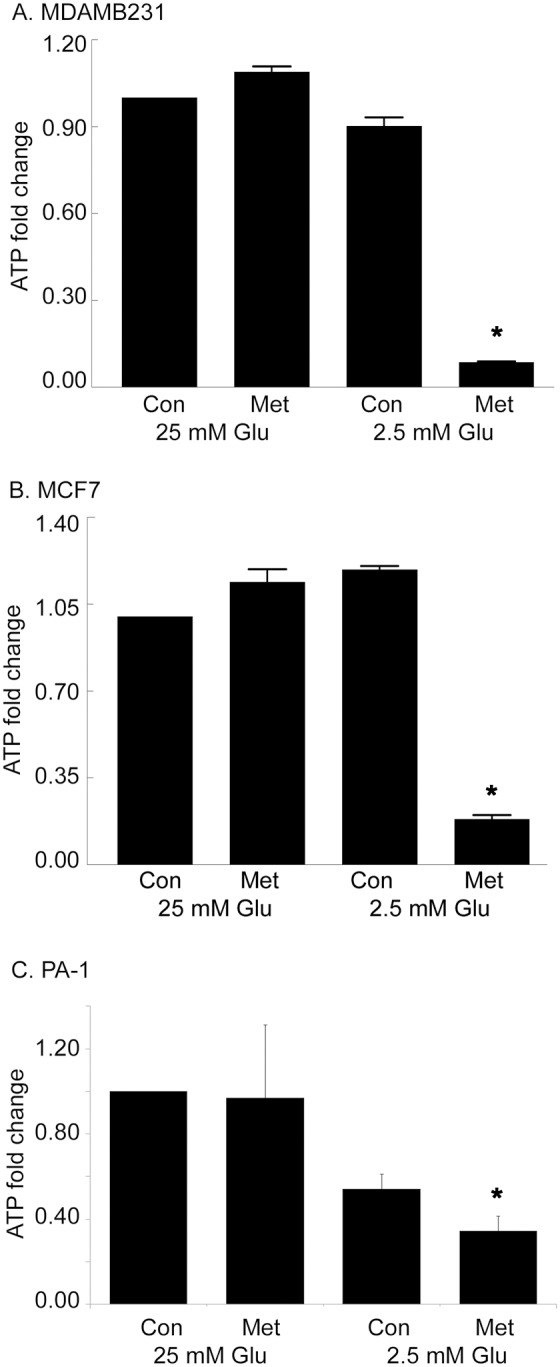
Figure 3 Metformin decreases ATP levels in medium containing low glucose (2.5 mM). MDAMB231 (A) and (B) MCF7 cells were treated with metformin (8 mM) in either 25 mM glucose or 2.5 mM glucose for one day and ATP levels were measured and fold change of ATP compared with control was plotted. C. ATP measurements in PA-1 cells after 12 hours with or without metformin. This time point was chosen because of the rapid rate of PA-1 growth under control culture conditions. Data were presented as mean ± standard deviation. All metformin treated groups in medium containing low glucose (2.5 mM) were significantly different from their control groups. *Indicates significant difference between groups.
Figure 3 Metformin decreases ATP levels in medium containing low glucose (2.5 mM). MDAMB231 (A) and (B) MCF7 cells were treated with metformin (8 mM) in either 25 mM glucose or 2.5 mM glucose for one day and ATP levels were measured and fold change of ATP compared with control was plotted. C. ATP measurements in PA-1 cells after 12 hours with or without metformin. This time point was chosen because of the rapid rate of PA-1 growth under control culture conditions. Data were presented as mean ± standard deviation. All metformin treated groups in medium containing low glucose (2.5 mM) were significantly different from their control groups. *Indicates significant difference between groups.CC BY · PubMed Central
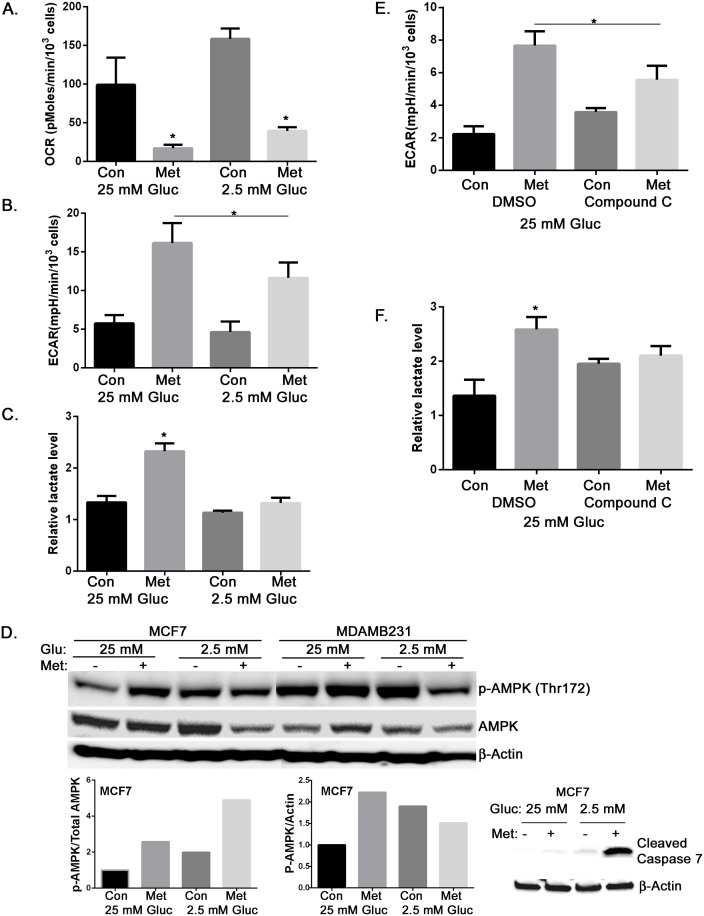
Figure 4 Metformin inhibits oxidative phosphorylation and increases glycolysis in 25 mM glucose containing medium in an AMPK-dependent manner. A. MCF7 cells were treated with metformin (8 mM) for 15 hours in either 25 mM or 2.5 mM glucose containing media. Oxygen consumption rate (OCR) was determined using the FX24 instrument for metabolic flux analysis. Metformin treated groups were significantly different from their control groups. B. MCF7 cells were treated with metformin (8 mM) for 15 hours. Extracellular acidification rate (ECAR) was determined using the FX24 instrument for metabolic flux analysis. Metformin treated groups were significantly different from each other and their control groups. C. MCF7 cells were treated with metformin (8 mM) for 15 hours, and medium lactate levels were measured as an indicator of glycolytic flux. Metformin treated groups were significantly different from each other. D. Extracts of MCF7 and MDAMB231 cells harvested one day treatment with metformin in either 25 or 2.5 mM glucose were used for Western blotting detection of phosphorylated AMPK and total AMPK. β-Actin was detected as a loading control. Densitometry of p-AMPK/AMPK or p-AMPK/Actin for MCF7 cells is presented as a bar graph. Cleaved capsase 7 in MCF7 cells was detected with western blotting. β-Actin was detected as a loading control. E. MCF7 cells in high glucose were treated with metformin (8 mM) and compound C (10 µM) as indicated for 15 hours. DMSO is the vehicle control for compound C. ECAR was determined as described in B. Metformin treated groups were significantly different from each other. F. MCF7 cells in high glucose were treated with metformin (8 mM) and compound C (10 µM) as indicated for 15 hours. Medium lactate levels were determined as in C. Metformin treated groups were significantly different from each other. All bar graphs represent mean ± standard deviation. *Indicates significant difference between groups.
Figure 4 Metformin inhibits oxidative phosphorylation and increases glycolysis in 25 mM glucose containing medium in an AMPK-dependent manner. A. MCF7 cells were treated with metformin (8 mM) for 15 hours in either 25 mM or 2.5 mM glucose containing media. Oxygen consumption rate (OCR) was determined using the FX24 instrument for metabolic flux analysis. Metformin treated groups were significantly different from their control groups. B. MCF7 cells were treated with metformin (8 mM) for 15 hours. Extracellular acidification rate (ECAR) was determined using the FX24 instrument for metabolic flux analysis. Metformin treated groups were significantly different from each other and their control groups. C. MCF7 cells were treated with metformin (8 mM) for 15 hours, and medium lactate levels were measured as an indicator of glycolytic flux. Metformin treated groups were significantly different from each other. D. Extracts of MCF7 and MDAMB231 cells harvested one day treatment with metformin in either 25 or 2.5 mM glucose were used for Western blotting detection of phosphorylated AMPK and total AMPK. β-Actin was detected as a loading control. Densitometry of p-AMPK/AMPK or p-AMPK/Actin for MCF7 cells is presented as a bar graph. Cleaved capsase 7 in MCF7 cells was detected with western blotting. β-Actin was detected as a loading control. E. MCF7 cells in high glucose were treated with metformin (8 mM) and compound C (10 µM) as indicated for 15 hours. DMSO is the vehicle control for compound C. ECAR was determined as described in B. Metformin treated groups were significantly different from each other. F. MCF7 cells in high glucose were treated with metformin (8 mM) and compound C (10 µM) as indicated for 15 hours. Medium lactate levels were determined as in C. Metformin treated groups were significantly different from each other. All bar graphs represent mean ± standard deviation. *Indicates significant difference between groups.CC BY · PubMed Central
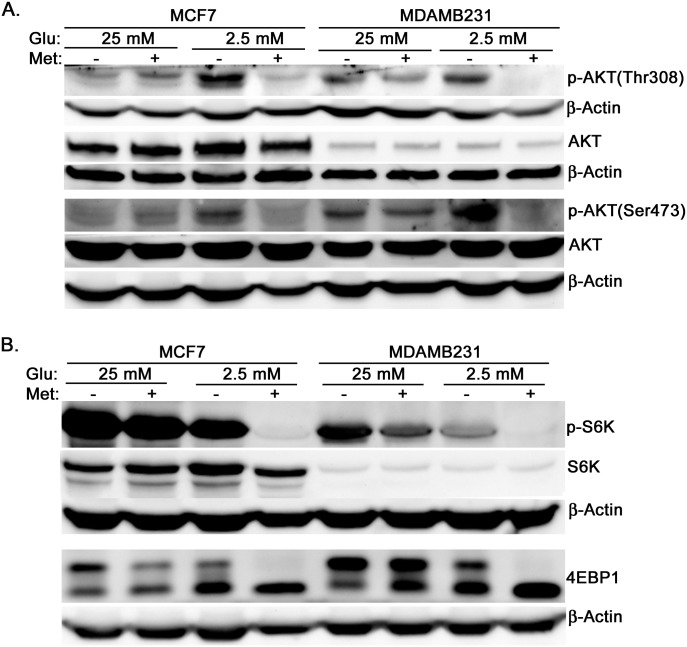
Figure 5 In low glucose medium metformin inhibits AKT phosphorylation and mTOR activation. MCF7 and MDAMB231 cells were treated with metformin in DMEM containing either 25 mM glucose or 2.5 mM glucose for one day. Western blotting was used to estimate the levels of p-AKT (Thr308), p-AKT (Thr473), total AKT, p-S6K, total S6K, 4EBP1 (lower bands represent hypophosphorylated and higher bands represent hyperphosphorylated), and β-actin as loading control.
Figure 5 In low glucose medium metformin inhibits AKT phosphorylation and mTOR activation. MCF7 and MDAMB231 cells were treated with metformin in DMEM containing either 25 mM glucose or 2.5 mM glucose for one day. Western blotting was used to estimate the levels of p-AKT (Thr308), p-AKT (Thr473), total AKT, p-S6K, total S6K, 4EBP1 (lower bands represent hypophosphorylated and higher bands represent hyperphosphorylated), and β-actin as loading control.CC BY · PubMed Central
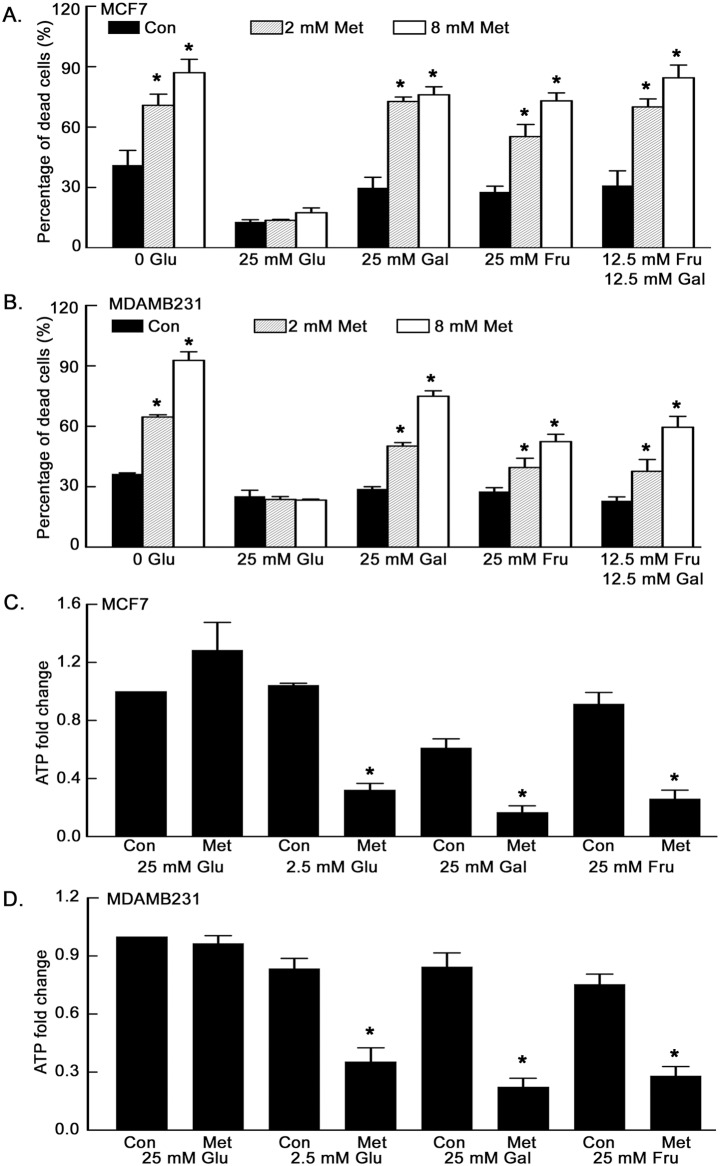
Figure 6 Replacement of glucose with fructose or galactose does not prevent metformin induced cell death or metformin induced ATP reduction. MCF7 (A) and MDAMB231 (B) cells were treated with metformin in DMEM without glucose, with 25 mM glucose, with 25 mM galactose, 25 mM fructose, or 12.5 mM fructose plus 12.5 mM galactose for 1.5 days. Percentage of dead cells was determined by Sytox Green staining. Metformin treated groups in 25 mM galactose, 25 mM fructose and 12.5 mM fructose plus 12.5 mM galactose were significantly different from metformin treated groups in 25 mM glucose. MCF7 (C) and MDAMB231 (D) cells were treated in the indicated medium with or without metformin (8 mM) for one day and ATP levels were measured. Metformin treated groups in 2.5 mM glucose, 25 mM galactose and 25 mM fructose were significantly different from their control groups. Results were displayed as fold change compared with control. Data are presented as mean ± standard deviation. *Indicates significant difference between groups.
Figure 6 Replacement of glucose with fructose or galactose does not prevent metformin induced cell death or metformin induced ATP reduction. MCF7 (A) and MDAMB231 (B) cells were treated with metformin in DMEM without glucose, with 25 mM glucose, with 25 mM galactose, 25 mM fructose, or 12.5 mM fructose plus 12.5 mM galactose for 1.5 days. Percentage of dead cells was determined by Sytox Green staining. Metformin treated groups in 25 mM galactose, 25 mM fructose and 12.5 mM fructose plus 12.5 mM galactose were significantly different from metformin treated groups in 25 mM glucose. MCF7 (C) and MDAMB231 (D) cells were treated in the indicated medium with or without metformin (8 mM) for one day and ATP levels were measured. Metformin treated groups in 2.5 mM glucose, 25 mM galactose and 25 mM fructose were significantly different from their control groups. Results were displayed as fold change compared with control. Data are presented as mean ± standard deviation. *Indicates significant difference between groups.CC BY · PubMed Central
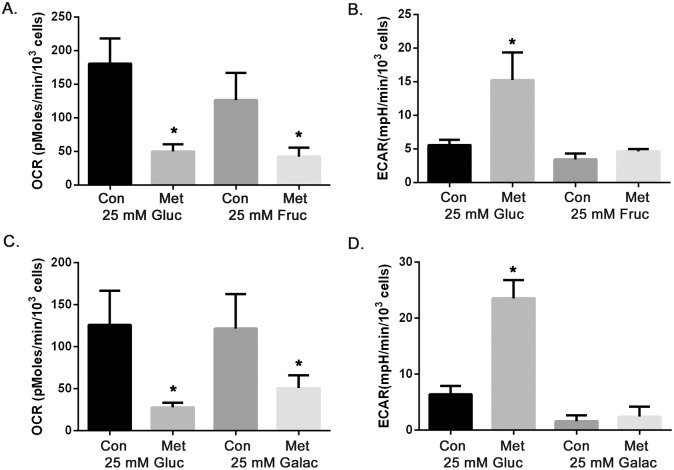
Figure 7 High fructose (25 mM) and galactose (25 mM) do not support metformin enhanced glycolysis as observed in high glucose medium (25 mM). MCF7 cells were treated with metformin (8 mM) in medium containing 25 mM glucose, 25 mM fructose or 25 mM galactose for 15 hours. OCR and ECAR were measured. A. OCR in either high glucose or fructose conditions, metformin treated groups were significantly different from their control groups, B. ECAR in either high glucose or fructose conditions, metformin treated groups were significantly different from each other, C. OCR in either high glucose or galactose containing media, metformin treated groups were significantly different from their control groups, D. ECAR in either high glucose or galactose conditions, metformin treated groups were significantly different from each other. Data are presented as mean ± standard deviation. *Indicates significant difference between groups.
Figure 7 High fructose (25 mM) and galactose (25 mM) do not support metformin enhanced glycolysis as observed in high glucose medium (25 mM). MCF7 cells were treated with metformin (8 mM) in medium containing 25 mM glucose, 25 mM fructose or 25 mM galactose for 15 hours. OCR and ECAR were measured. A. OCR in either high glucose or fructose conditions, metformin treated groups were significantly different from their control groups, B. ECAR in either high glucose or fructose conditions, metformin treated groups were significantly different from each other, C. OCR in either high glucose or galactose containing media, metformin treated groups were significantly different from their control groups, D. ECAR in either high glucose or galactose conditions, metformin treated groups were significantly different from each other. Data are presented as mean ± standard deviation. *Indicates significant difference between groups.CC BY · PubMed Central
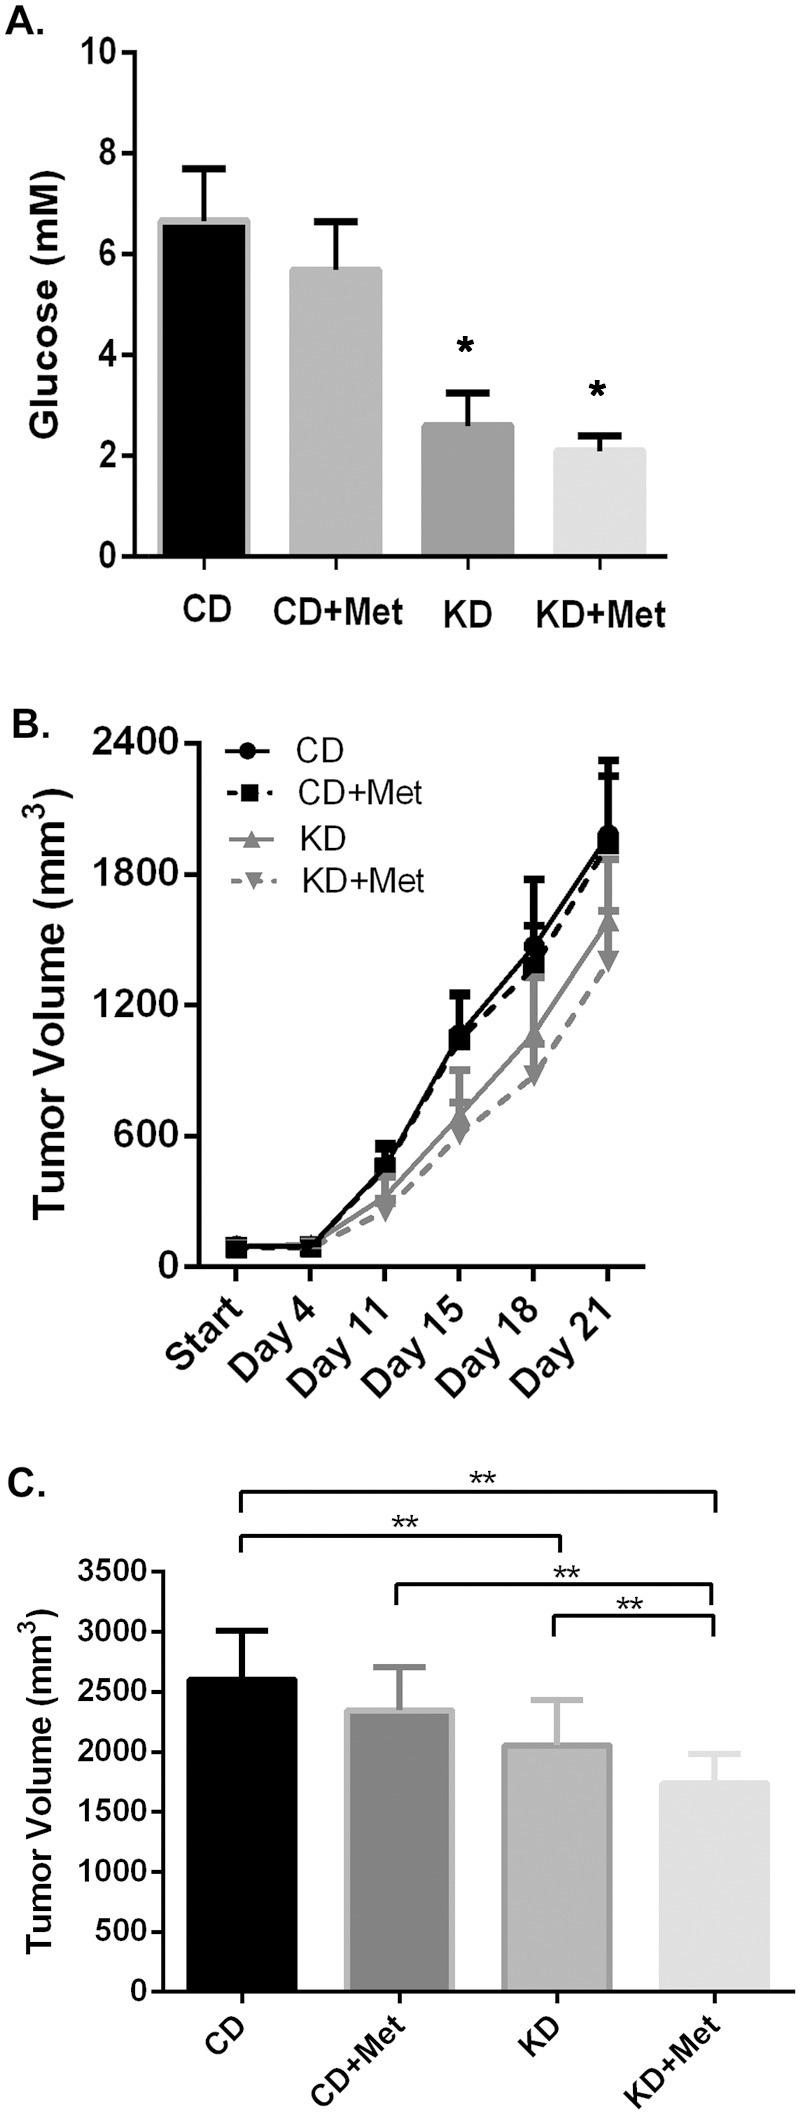
Figure 8 Ketogenic diets reduced serum glucose concentration and enhanced metformin effects on reducing 4T1 breast tumor growth in Balb/c mice. A. Serum glucose was measured and demonstrated as bar graph. Data are presented as mean ± standard deviation. Groups on Ketogenic diets are significant different from groups on control diets. B. Tumor growth was measured at indicated time for CD (control diet), CD+Met (control diet plus metformin), KD (ketogenic diet) and KD+Met (ketogenic diet plus metformin). CD+Met treatment group was significantly different from KD+Met treatment group after day 11. C. Tumor volume at day 23. Data are presented as mean ± standard deviation (**indicates significant difference between groups).
Figure 8 Ketogenic diets reduced serum glucose concentration and enhanced metformin effects on reducing 4T1 breast tumor growth in Balb/c mice. A. Serum glucose was measured and demonstrated as bar graph. Data are presented as mean ± standard deviation. Groups on Ketogenic diets are significant different from groups on control diets. B. Tumor growth was measured at indicated time for CD (control diet), CD+Met (control diet plus metformin), KD (ketogenic diet) and KD+Met (ketogenic diet plus metformin). CD+Met treatment group was significantly different from KD+Met treatment group after day 11. C. Tumor volume at day 23. Data are presented as mean ± standard deviation (**indicates significant difference between groups).CC BY · PubMed Central

Verification

Claims the paper makes

The claims and statistics of this paper haven’t been checked yet.

Run the check — free, no account needed. It reads the open-access text and checks the sources it cites.

A few free checks a day · papers already verified open instantly · results are public

Claims other papers make about this one

Each is checked against this paper’s own text: does it say what the citing paper says it does?

Self-check

Percentages, sums and reported differences re-computed from the paper’s own numbers.

The self-check needs the paper’s full text.

Citations

Cites

Show all 42 references

Research works printed but not linked: 1

  1. VC Sandulache, 2011, Glucose, not glutamine, is the dominant energy source required for proliferation and survival of head and neck squamous carcinoma cells, Cancer, 117, 2926, 10.1002/cncr.25868 · DOI

Cited by

Sorted by citations

See all 149

Metadata

Authors
Zhuang, Y., Chan, D. K., Haugrud, A. B., & Miskimins, W. K.
Affiliations
  • Sanford Research (US)
  • University of South Dakota (US)
Corresponding author
Zhuang, Yongxian
Venue
PLoS ONE
Published
2014-09-25
Volume
9
Issue
9
Pages
e108444
ISSN
1932-6203 (ISSN-L)
OpenAlex
W2011662441
Cited by
149
References
42
Citations by year
2026: 7 · 2025: 8 · 2024: 17 · 2023: 14 · 2022: 8 · 2021: 15 · 2020: 16 · 2019: 17 · 2018: 13 · 2017: 13 · 2016: 14 · 2015: 7
FWCI
4.64
Type
journal article
Language
en
Open access
Locations
  • PLoS ONE (publishedVersion, cc-by)
  • PubMed Central (publishedVersion, cc-by)
  • PubMed (publishedVersion)
  • DOAJ (DOAJ: Directory of Open Access Journals) (submittedVersion, cc-by-sa)
Funders
  • National Institutes of Health
  • National Cancer Institute (R01CA180033)
  • National Institute of General Medical Sciences (5P20GM10358, P20GM103548)
Topics
  • Life Sciences › Biochemistry, Genetics and Molecular Biology › Molecular Biology › Metabolism, Diabetes, and Cancer
  • Life Sciences › Biochemistry, Genetics and Molecular Biology › Cancer Research › Cancer, Hypoxia, and Metabolism
  • Life Sciences › Biochemistry, Genetics and Molecular Biology › Molecular Biology › PI3K/AKT/mTOR signaling in cancer
Keywords
metformin, low glucose, tumor cell killing, breast cancer, ovarian cancer, glycolysis, AMPK, mTOR signaling, Akt phosphorylation, ATP depletion, fructose, galactose, ketogenic diet, tumor growth inhibition, metformin resistance
MeSH terms
Adenosine Triphosphate, Animals, Antineoplastic Agents, Blood Glucose, Cell Survival, Glucose, Glycolysis, Hypoglycemic Agents, Metformin, Neoplasms, Oxidative Phosphorylation, Phosphorylation, Drug Resistance, Neoplasm, Cell Line, Tumor, Proto-Oncogene Proteins c-akt, Mice, AMP-Activated Protein Kinases, Diet, Ketogenic, TOR Serine-Threonine Kinases

About these checks

Registry, retraction, Cites and statistics results are computed, not judged, with one exception: a printed reference that no index lists is read once by a model before it counts as a citation error. Claims are extracted by a model and kept only when their quote appears verbatim in the text; each cited source is then checked, with a model’s help, for whether it says what the claim relies on. Those verdicts can be wrong — read the claim’s quote and the cited source before relying on one.

Statistics and arithmetic are recomputed, not judged.

Confidence bands are shown only for fields calibrated on our annotated test set. None is calibrated yet, so no band is shown.

What counts as a claim ›How we measure confidence ›How we check this ›

Are you an author, or do you see a problem with this page? Request a review