Cited by 254

The DOI matches its Crossref record; 3 of the 3 references it cites were found in a registry or an index.

IL-6 Stimulates Intestinal Epithelial Proliferation and Repair after Injury

Kuhn, Kristine A., Manieri, Nicholas A., Liu, Ta-Chiang, Stappenbeck, Thaddeus S.·2014·PLoS ONE

Overview

The claims and statistics of this paper haven’t been checked yet.

Run the check — free, no account needed. It reads the open-access text and checks the sources it cites.

A few free checks a day · papers already verified open instantly · results are public

Integrity signals

Registry

Crossref · 10.1371/journal.pone.0114195

Cites

3 of 3 references verified0 citation errors · 0 not checkable

Statistics

Figures

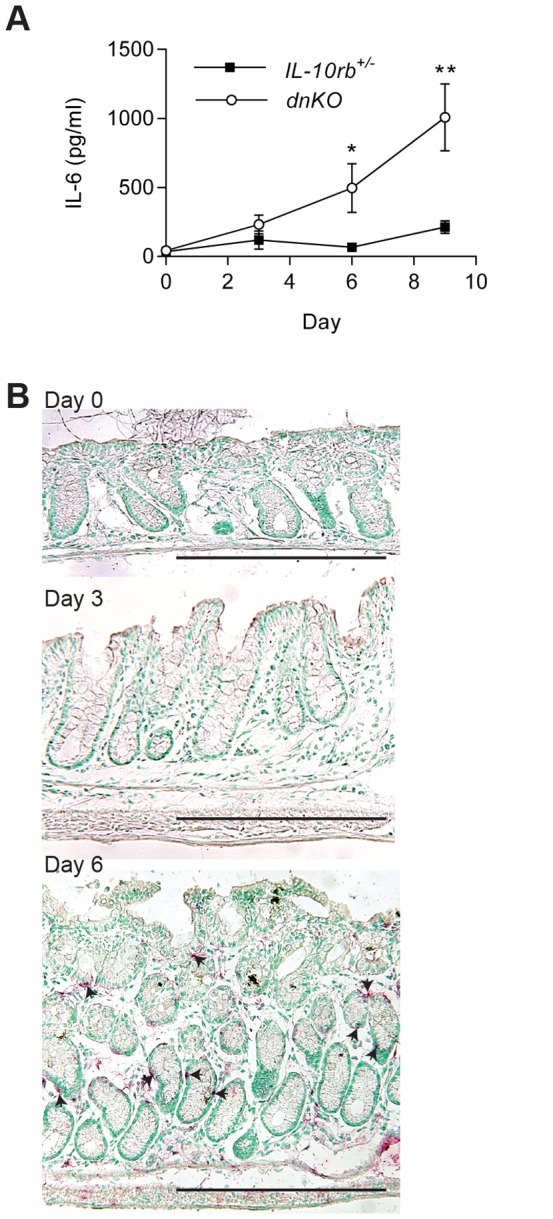
Figure 1 IL-6 was induced with the initiation of colitis in dnKO mice. Antibiotic pretreated dnKO and IL-10rb+/- littermate control mice were co-housed with non-antibiotic treated mice to induce colitis in dnKO mice. From individual mice, colons and sera were harvested with no co-housing (baseline, day zero) and every three days after co-housing. IL-6 mRNA and protein expression was analyzed by ELISA (A) and in situ hybridization (B), respectively. Two experiments were performed with a total of 10–14 mice/group/time point. (A) Plot of the average ± SEM IL-6 protein (pg/ml) in the sera over time for each group of mice. A student's t-test was used to determine statistical significance for each time point; *, p<0.05; **, p<0.0001. (B) Representative images of IL-6 in situ hybridization (red staining, arrowheads) are shown for days 0, 3 and 6 post co-housing. Bars = 500 µm.
Figure 1 IL-6 was induced with the initiation of colitis in dnKO mice. Antibiotic pretreated dnKO and IL-10rb+/- littermate control mice were co-housed with non-antibiotic treated mice to induce colitis in dnKO mice. From individual mice, colons and sera were harvested with no co-housing (baseline, day zero) and every three days after co-housing. IL-6 mRNA and protein expression was analyzed by ELISA (A) and in situ hybridization (B), respectively. Two experiments were performed with a total of 10–14 mice/group/time point. (A) Plot of the average ± SEM IL-6 protein (pg/ml) in the sera over time for each group of mice. A student's t-test was used to determine statistical significance for each time point; *, p<0.05; **, p<0.0001. (B) Representative images of IL-6 in situ hybridization (red staining, arrowheads) are shown for days 0, 3 and 6 post co-housing. Bars = 500 µm.CC BY · PubMed Central
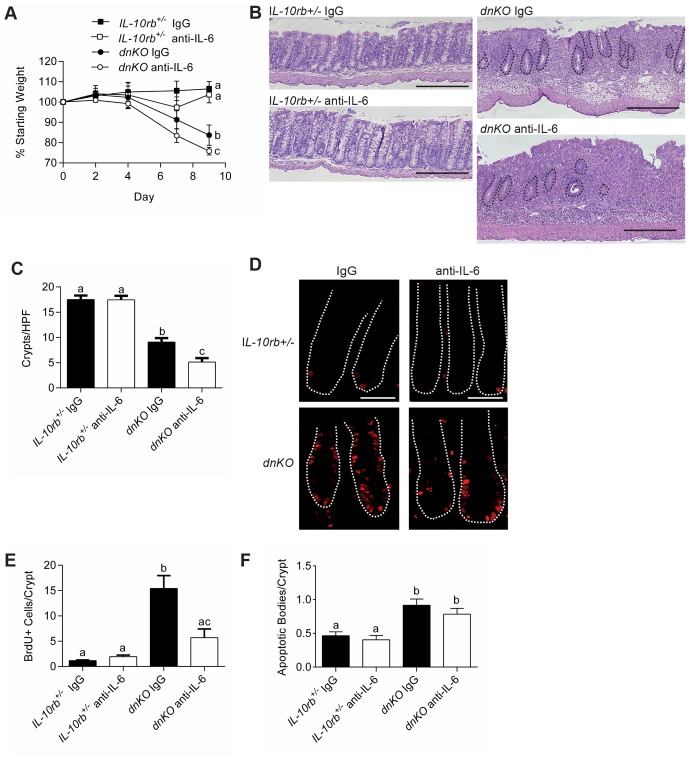
Figure 2 Inhibition of IL-6 resulted in more severe colitis and inhibition of intestinal epithelial proliferation. Colitis was induced in dnKO and IL-10rb+/- littermate controls by co-housing. On day zero and three times weekly, mice were injected intraperitoneally with 500 µg of either anti-IL-6 mAb or control IgG mAb. Two independent experiments were performed with 8-9 mice/group. (A) Plot of the average percent of starting weight ± SEM shown for indicated groups of mice. Mice were weighed every three days. (B) Representative H+E stained sections of descending colons at day 9 post co-housing. Bars = 500 µm. Black dotted lines outline remaining crypts in the dnKO anti-IL-6 mAb treated mouse histology. (C) Graph of the average number of descending colonic crypts per high-powered field ± SEM. (D) At day 9 post-co-housing, mice were injected with BrdU one hour before sacrifice. Representative colonic sections stained with mAb to BrdU and detected with fluorescently conjugated antibodies were shown. The white dotted lines delineate crypts. Bars = 100 µm. (E) Graph of the average number ± SEM of BrdU positive cells per crypt. (F) Graph of the average ± SEM number of apoptotic bodies/crypt. One-way analysis of variance: (A) F = 3.5, P<0.05 (for day 9 weights); (C) F = 57.36, P<0.0001; (E) F = 17.92, P<0.0001; (F) F = 10.87, P<0.0001. Means with different letters are significantly different by Bonferroni's multiple comparison test.
Figure 2 Inhibition of IL-6 resulted in more severe colitis and inhibition of intestinal epithelial proliferation. Colitis was induced in dnKO and IL-10rb+/- littermate controls by co-housing. On day zero and three times weekly, mice were injected intraperitoneally with 500 µg of either anti-IL-6 mAb or control IgG mAb. Two independent experiments were performed with 8-9 mice/group. (A) Plot of the average percent of starting weight ± SEM shown for indicated groups of mice. Mice were weighed every three days. (B) Representative H+E stained sections of descending colons at day 9 post co-housing. Bars = 500 µm. Black dotted lines outline remaining crypts in the dnKO anti-IL-6 mAb treated mouse histology. (C) Graph of the average number of descending colonic crypts per high-powered field ± SEM. (D) At day 9 post-co-housing, mice were injected with BrdU one hour before sacrifice. Representative colonic sections stained with mAb to BrdU and detected with fluorescently conjugated antibodies were shown. The white dotted lines delineate crypts. Bars = 100 µm. (E) Graph of the average number ± SEM of BrdU positive cells per crypt. (F) Graph of the average ± SEM number of apoptotic bodies/crypt. One-way analysis of variance: (A) F = 3.5, P<0.05 (for day 9 weights); (C) F = 57.36, P<0.0001; (E) F = 17.92, P<0.0001; (F) F = 10.87, P<0.0001. Means with different letters are significantly different by Bonferroni's multiple comparison test.CC BY · PubMed Central
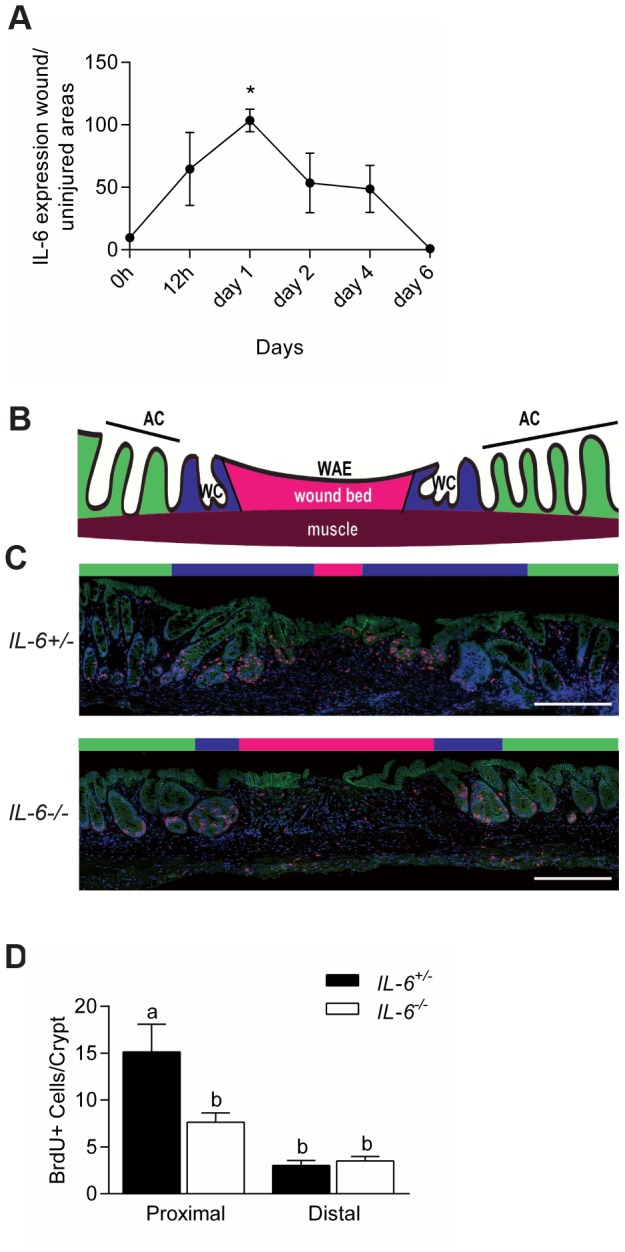
Figure 3 IL-6 promoted intestinal epithelial proliferation in wound biopsy model. (A) WT mice were biopsy injured in the distal colon. Plot of the relative levels of IL-6 mRNA expression in the wound bed (relative to uninjured tissue) for various times after injury. N = 2–3 WT mice with a total of 4-6 wounds/time point. Data were shown as average ± SEM. One-way analysis of variance: F = 5.68, P<0.01 (B) Cartoon depicting the microanatomy of a wound at day six post-biopsy; AC = adjacent crypts (green area); WC = wound channels (blue area); WAE = wound-associated epithelium overlying the wound bed (pink area). (C) Colonic sections of wounds from IL-6+/− and IL-6-/- mice at day six post-injury stained with mAb to BrdU (labels S-phase cells, red), mAb to β-catenin (labels epithelium, green), and bis-benzimide (nuclei, blue). Bars = 500 µm. (D) Quantification of the number of BrdU positive cells/wound adjacent crypts. Data were graphed as average ± SEM. One way analysis of variance: F = 10.5, p<0.0001. Means with different letters are significantly different by Bonferroni's multiple comparison test.
Figure 3 IL-6 promoted intestinal epithelial proliferation in wound biopsy model. (A) WT mice were biopsy injured in the distal colon. Plot of the relative levels of IL-6 mRNA expression in the wound bed (relative to uninjured tissue) for various times after injury. N = 2–3 WT mice with a total of 4-6 wounds/time point. Data were shown as average ± SEM. One-way analysis of variance: F = 5.68, P<0.01 (B) Cartoon depicting the microanatomy of a wound at day six post-biopsy; AC = adjacent crypts (green area); WC = wound channels (blue area); WAE = wound-associated epithelium overlying the wound bed (pink area). (C) Colonic sections of wounds from IL-6+/− and IL-6-/- mice at day six post-injury stained with mAb to BrdU (labels S-phase cells, red), mAb to β-catenin (labels epithelium, green), and bis-benzimide (nuclei, blue). Bars = 500 µm. (D) Quantification of the number of BrdU positive cells/wound adjacent crypts. Data were graphed as average ± SEM. One way analysis of variance: F = 10.5, p<0.0001. Means with different letters are significantly different by Bonferroni's multiple comparison test.CC BY · PubMed Central
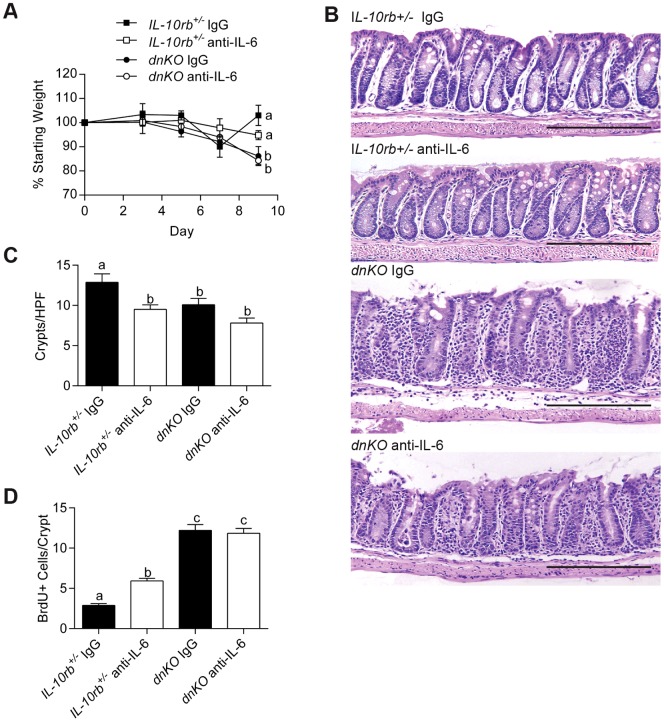
Figure 4 IL-6 inhibition after colitis induction did not inhibit epithelial proliferation but did not improve disease. Three days after induction of colitis in dnKO and IL-10rb+/- littermate controls, 500 µg anti-IL-6 antibody or control IgG was administered to mice three times weekly. Mice were sacrificed 9 days after induction of colitis. 6–8 mice per group in two independent experiments were analyzed. (A) Plot of the average percent of starting weight ± SEM shown for indicated groups of mice. Mice were weighed every three days. (B) Representative H+E-stained sections of descending colons from each group of mice. Bars = 500 µm. (C) Graph of the mean number of crypts/high-powered field ± SEM of the descending colon per animal. (D) Graph of the average number of BrdU+ cells/crypt ± SEM. One-way analysis of variance: (A) F = 4.88, P = 0.016; (C) F = 21.14, P<0.0001; and (D) F = 68.24, P<0.0001. Means with different letters are significantly different by Bonferroni's multiple comparison test.
Figure 4 IL-6 inhibition after colitis induction did not inhibit epithelial proliferation but did not improve disease. Three days after induction of colitis in dnKO and IL-10rb+/- littermate controls, 500 µg anti-IL-6 antibody or control IgG was administered to mice three times weekly. Mice were sacrificed 9 days after induction of colitis. 6–8 mice per group in two independent experiments were analyzed. (A) Plot of the average percent of starting weight ± SEM shown for indicated groups of mice. Mice were weighed every three days. (B) Representative H+E-stained sections of descending colons from each group of mice. Bars = 500 µm. (C) Graph of the mean number of crypts/high-powered field ± SEM of the descending colon per animal. (D) Graph of the average number of BrdU+ cells/crypt ± SEM. One-way analysis of variance: (A) F = 4.88, P = 0.016; (C) F = 21.14, P<0.0001; and (D) F = 68.24, P<0.0001. Means with different letters are significantly different by Bonferroni's multiple comparison test.CC BY · PubMed Central
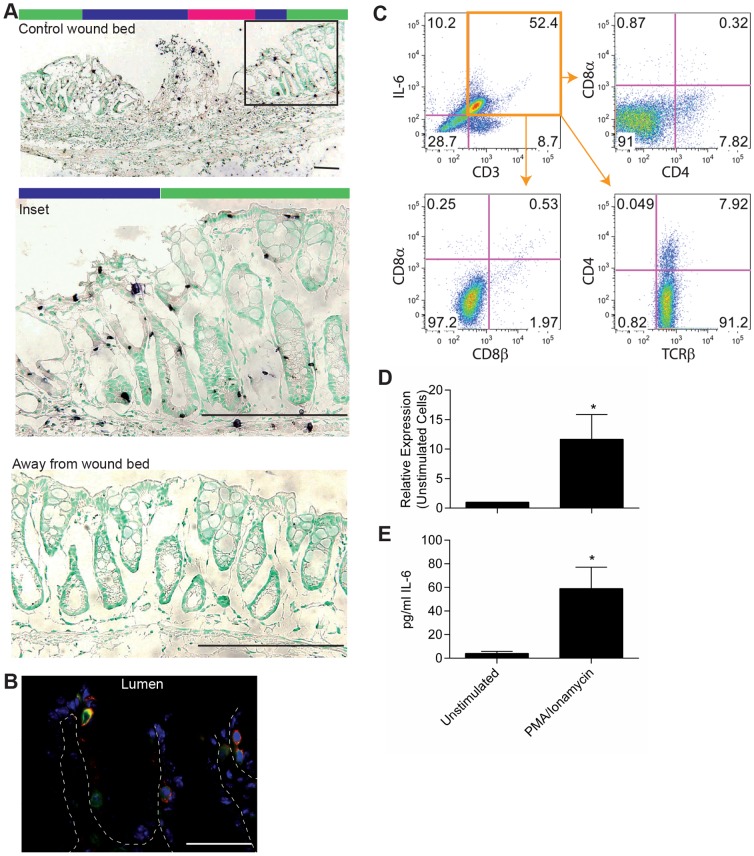
Figure 5 Intraepithelial lymphocytes were a source of IL-6 early after injury. (A) Biopsy of the colon mucosa was performed in WT mice to create small wounds. IL-6 expression in the wound bed and adjacent tissue was evaluated by in situ hybridization one day after biopsy. Representative images were shown. Bars = 200 µm. Colored bars above wound images indicate areas of the wound bed as depicted in Figure 4B. (B) Co-localization by immunofluorescence was performed for IL-6 (red), CD3ε (green), and bis-benzimide (blue) on colon tissue from dnKO mice at day 6 after co-housing. Representative staining was shown at 63X. Bar = 200 µm. (C) Epithelial cells were harvested from dnKO mice on day 6 after co-housing, stained for T cell markers and IL-6, and assessed by flow cytometry. Representative dot plots were shown. (D, E) CD3+ CD4- CD8- IELs were harvested from WT mice and stimulated ex vivo with 10 ng/ml PMA and 1 µg/ml ionamycin for 5 hours. (D) RNA was collected and evaluated by qRT-PCR for IL-6 expression. (E) Culture supernatants were harvested and evaluated for secreted IL-6 by electrochemilluminescence. Data were shown as the average IL-6 expression or protein ± SEM. A paired student's t-test was used to determine significance; *, P<0.05.
Figure 5 Intraepithelial lymphocytes were a source of IL-6 early after injury. (A) Biopsy of the colon mucosa was performed in WT mice to create small wounds. IL-6 expression in the wound bed and adjacent tissue was evaluated by in situ hybridization one day after biopsy. Representative images were shown. Bars = 200 µm. Colored bars above wound images indicate areas of the wound bed as depicted in Figure 4B. (B) Co-localization by immunofluorescence was performed for IL-6 (red), CD3ε (green), and bis-benzimide (blue) on colon tissue from dnKO mice at day 6 after co-housing. Representative staining was shown at 63X. Bar = 200 µm. (C) Epithelial cells were harvested from dnKO mice on day 6 after co-housing, stained for T cell markers and IL-6, and assessed by flow cytometry. Representative dot plots were shown. (D, E) CD3+ CD4- CD8- IELs were harvested from WT mice and stimulated ex vivo with 10 ng/ml PMA and 1 µg/ml ionamycin for 5 hours. (D) RNA was collected and evaluated by qRT-PCR for IL-6 expression. (E) Culture supernatants were harvested and evaluated for secreted IL-6 by electrochemilluminescence. Data were shown as the average IL-6 expression or protein ± SEM. A paired student's t-test was used to determine significance; *, P<0.05.CC BY · PubMed Central
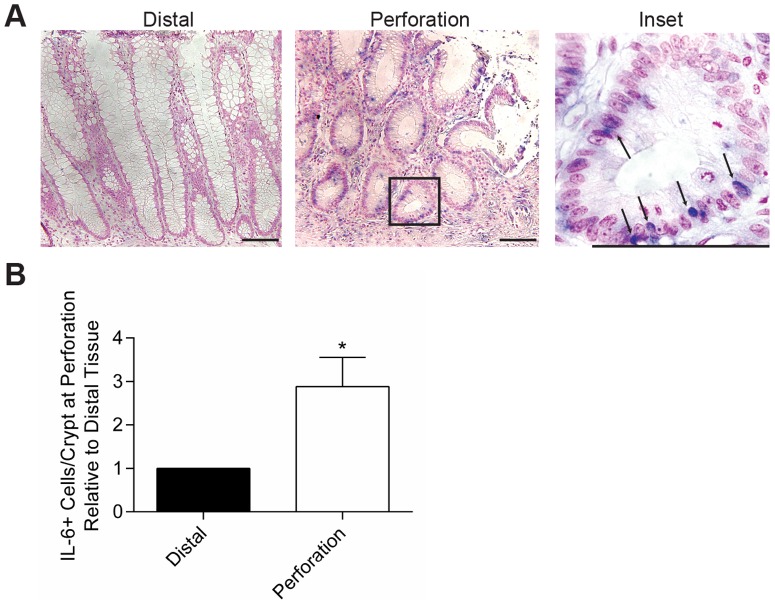
Figure 6 IL-6 expression was increased in human colons at sites of perforation. Tissue that was surgically resected from patients who suffered large bowel perforation was evaluated for IL-6 expression by in situ hybridization. Eleven cases were evaluated (8 males with trauma due to gun-shot wounds, ages 16–33; 1 female surgical trauma, age 45; and 2 females with diverticulitis, ages 72 and 79). (A) Representative staining from a patient with diverticulitis is shown at 20X and 100X, respectively. Bars = 100 µm. Arrows indicate IL-6+ cells with lymphocyte morphology. (B) Four high-powered fields with well-oriented crypts were evaluated for IL-6+ cells in the epithelial layer at the site of perforation and at the distal resection margin. The average ratio of IL-6+ cells in the perforation versus distal site ± SEM was shown. An unpaired student's t-test was used for statistical analysis; *, P = 0.02.
Figure 6 IL-6 expression was increased in human colons at sites of perforation. Tissue that was surgically resected from patients who suffered large bowel perforation was evaluated for IL-6 expression by in situ hybridization. Eleven cases were evaluated (8 males with trauma due to gun-shot wounds, ages 16–33; 1 female surgical trauma, age 45; and 2 females with diverticulitis, ages 72 and 79). (A) Representative staining from a patient with diverticulitis is shown at 20X and 100X, respectively. Bars = 100 µm. Arrows indicate IL-6+ cells with lymphocyte morphology. (B) Four high-powered fields with well-oriented crypts were evaluated for IL-6+ cells in the epithelial layer at the site of perforation and at the distal resection margin. The average ratio of IL-6+ cells in the perforation versus distal site ± SEM was shown. An unpaired student's t-test was used for statistical analysis; *, P = 0.02.CC BY · PubMed Central

Verification

Claims the paper makes

The claims and statistics of this paper haven’t been checked yet.

Run the check — free, no account needed. It reads the open-access text and checks the sources it cites.

A few free checks a day · papers already verified open instantly · results are public

Claims other papers make about this one

Each is checked against this paper’s own text: does it say what the citing paper says it does?

Self-check

Percentages, sums and reported differences re-computed from the paper’s own numbers.

The self-check needs the paper’s full text.

Citations

Cites

Research works printed but not linked: 30

  1. LE Harrington, 2005, Interleukin 17-producing CD4+ effector T cells develop via a lineage distinct from the T helper type 1 and 2 lineages, Nat Immunol, 6, 1123, 10.1038/ni1254 · DOI · Paper page
  2. JM Dayer, 2010, Therapeutic targets in rheumatoid arthritis: the interleukin-6 receptor, Rheumatology (Oxford), 49, 15, 10.1093/rheumatology/kep329 · DOI
  3. JS Smolen, 2008, Effect of interleukin-6 receptor inhibition with tocilizumab in patients with rheumatoid arthritis (OPTION study): a double-blind, placebo-controlled, randomised trial, Lancet, 371, 987, 10.1016/S0140-6736(08)60453-5 · DOI
  4. JM Kremer, 2011, Tocilizumab inhibits structural joint damage in rheumatoid arthritis patients with inadequate responses to methotrexate: results from the double-blind treatment phase of a randomized placebo-controlled trial of tocilizumab safety and prevention of structural joint damage at one year, Arthritis Rheum, 63, 609, 10.1002/art.30158 · DOI
  5. P Emery, 2008, IL-6 receptor inhibition with tocilizumab improves treatment outcomes in patients with rheumatoid arthritis refractory to anti-tumour necrosis factor biologicals: results from a 24-week multicentre randomised placebo-controlled trial, Ann Rheum Dis, 67, 1516, 10.1136/ard.2008.092932 · DOI · Paper page
  6. T Gout, 2011, Lower gastrointestinal perforation in rheumatoid arthritis patients treated with conventional DMARDs or tocilizumab: a systematic literature review, Clin Rheumatol, 30, 1471, 10.1007/s10067-011-1827-x · DOI
  7. H Ito, 2004, A pilot randomized trial of a human anti-interleukin-6 receptor monoclonal antibody in active Crohn's disease, Gastroenterology, 126, 989, 10.1053/j.gastro.2004.01.012 · DOI · Paper page
  8. MJ Waldner, 2014, Master regulator of intestinal disease: IL-6 in chronic inflammation and cancer development, Semin Immunol, 26, 75, 10.1016/j.smim.2013.12.003 · DOI
  9. J Mudter, 2007, Il-6 signaling in inflammatory bowel disease: pathophysiological role and clinical relevance, Inflamm Bowel Dis, 13, 1016, 10.1002/ibd.20148 · DOI
  10. W Reinisch, 1999, Clinical relevance of serum interleukin-6 in Crohn's disease: single point measurements, therapy monitoring, and prediction of clinical relapse, Am J Gastroenterol, 94, 2156, 10.1111/j.1572-0241.1999.01288.x · DOI · Paper page
  11. J Bollrath, 2009, gp130-mediated Stat3 activation in enterocytes regulates cell survival and cell-cycle progression during colitis-associated tumorigenesis, Cancer Cell, 15, 91, 10.1016/j.ccr.2009.01.002 · DOI · Paper page
  12. S Grivennikov, 2009, IL-6 and Stat3 are required for survival of intestinal epithelial cells and development of colitis-associated cancer, Cancer Cell, 15, 103, 10.1016/j.ccr.2009.01.001 · DOI · Paper page
  13. SM Dann, 2008, IL-6-dependent mucosal protection prevents establishment of a microbial niche for attaching/effacing lesion-forming enteric bacterial pathogens, J Immunol, 180, 6816, 10.4049/jimmunol.180.10.6816 · DOI
  14. H Miyoshi, 2012, Wnt5a potentiates TGF-beta signaling to promote colonic crypt regeneration after tissue injury, Science, 338, 108, 10.1126/science.1223821 · DOI
  15. SS Kang, 2008, An antibiotic-responsive mouse model of fulminant ulcerative colitis, PLoS Med, 5, e41, 10.1371/journal.pmed.0050041 · DOI
  16. S Bloom, 2011, Commensal Bacteroides species induce colitis in host-genotype-specific fashion in a mouse model of inflammatory bowel disease, Cell host & microbe, 9, 390, 10.1016/j.chom.2011.04.009 · DOI · Paper page
  17. HF Starnes Jr, 1990, Anti-IL-6 monoclonal antibodies protect against lethal Escherichia coli infection and lethal tumor necrosis factor-alpha challenge in mice, J Immunol, 145, 4185, 10.4049/jimmunol.145.12.4185 · DOI
  18. Manieri NA, Drylewicz MR, Miyoshi H, Stappenbeck TS (2012) Igf2bp1 is required for full induction of Ptgs2 mRNA in colonic mesenchymal stem cells in mice. Gastroenterology 143: 110–121 e110. · DOI
  19. H Seno, 2009, Efficient colonic mucosal wound repair requires Trem2 signaling, Proc Natl Acad Sci U S A, 106, 256, 10.1073/pnas.0803343106 · DOI
  20. S Matsumoto, 2010, Essential roles of IL-6 trans-signaling in colonic epithelial cells, induced by the IL-6/soluble-IL-6 receptor derived from lamina propria macrophages, on the development of colitis-associated premalignant cancer in a murine model, J Immunol, 184, 1543, 10.4049/jimmunol.0801217 · DOI
  21. K Kitamura, 2004, Pivotal roles of interleukin-6 in transmural inflammation in murine T cell transfer colitis, J Leukoc Biol, 76, 1111, 10.1189/jlb.0604328 · DOI
  22. C Becker, 2004, TGF-beta suppresses tumor progression in colon cancer by inhibition of IL-6 trans-signaling, Immunity, 21, 491, 10.1016/j.immuni.2004.07.020 · DOI · Paper page
  23. YC Chung, 2003, Serum interleukin-6 levels reflect the disease status of colorectal cancer, J Surg Oncol, 83, 222, 10.1002/jso.10269 · DOI
  24. G Galizia, 2002, Prognostic significance of circulating IL-10 and IL-6 serum levels in colon cancer patients undergoing surgery, Clin Immunol, 102, 169, 10.1006/clim.2001.5163 · DOI
  25. MR Schneider, 2000, Interleukin-6 stimulates clonogenic growth of primary and metastatic human colon carcinoma cells, Cancer Lett, 151, 31, 10.1016/S0304-3835(99)00401-2 · DOI
  26. C Woodroofe, 1992, Long-term consequences of interleukin-6 overexpression in transgenic mice, DNA Cell Biol, 11, 587, 10.1089/dna.1992.11.587 · DOI
  27. AL Kovalchuk, 2002, IL-6 transgenic mouse model for extraosseous plasmacytoma, Proc Natl Acad Sci U S A, 99, 1509, 10.1073/pnas.022643999 · DOI
  28. Y Suzuki, 1990, Significant increase of interleukin 6 production in blood mononuclear leukocytes obtained from patients with active inflammatory bowel disease, Life Sci, 47, 2193, 10.1016/0024-3205(90)90149-L · DOI
  29. HC Reinecker, 1993, Enhanced secretion of tumour necrosis factor-alpha, IL-6, and IL-1 beta by isolated lamina propria mononuclear cells from patients with ulcerative colitis and Crohn's disease, Clin Exp Immunol, 94, 174, 10.1111/j.1365-2249.1993.tb05997.x · DOI
  30. KW Beagley, 1995, Differences in intraepithelial lymphocyte T cell subsets isolated from murine small versus large intestine, J Immunol, 154, 5611, 10.4049/jimmunol.154.11.5611 · DOI

Cited by

Sorted by citations

See all 254

Metadata

Authors
Kuhn, K. A., Manieri, N. A., Liu, T.-C., & Stappenbeck, T. S.
Venue
PLoS ONE
Published
2014-12-05
Volume
9
Issue
12
Pages
e114195
ISSN
1932-6203
Cited by
254
References
3
Language
en

About these checks

Registry, retraction, Cites and statistics results are computed, not judged, with one exception: a printed reference that no index lists is read once by a model before it counts as a citation error. Claims are extracted by a model and kept only when their quote appears verbatim in the text; each cited source is then checked, with a model’s help, for whether it says what the claim relies on. Those verdicts can be wrong — read the claim’s quote and the cited source before relying on one.

Statistics and arithmetic are recomputed, not judged.

Confidence bands are shown only for fields calibrated on our annotated test set. None is calibrated yet, so no band is shown.

What counts as a claim ›How we measure confidence ›How we check this ›

Are you an author, or do you see a problem with this page? Request a review