Cited by 75

The DOI matches its Crossref record; 6 of the 6 references it cites were found in a registry or an index.

Detection of a Novel, Integrative Aging Process Suggests Complex Physiological Integration

Cohen, Alan A., Milot, Emmanuel, Li, Qing, Bergeron, Patrick, Poirier, Roxane, Dusseault-Bélanger, Francis, Fülöp, Tamàs, Leroux, Maxime, Legault, Véronique, Metter, E. Jeffrey, Fried, Linda P., Ferrucci, Luigi·2015·PLOS ONE

Overview

The claims and statistics of this paper haven’t been checked yet.

Run the check — free, no account needed. It reads the open-access text and checks the sources it cites.

A few free checks a day · papers already verified open instantly · results are public

Integrity signals

Registry

Crossref · 10.1371/journal.pone.0116489

Cites

6 of 6 references verified0 citation errors · 0 not checkable

Statistics

Figures

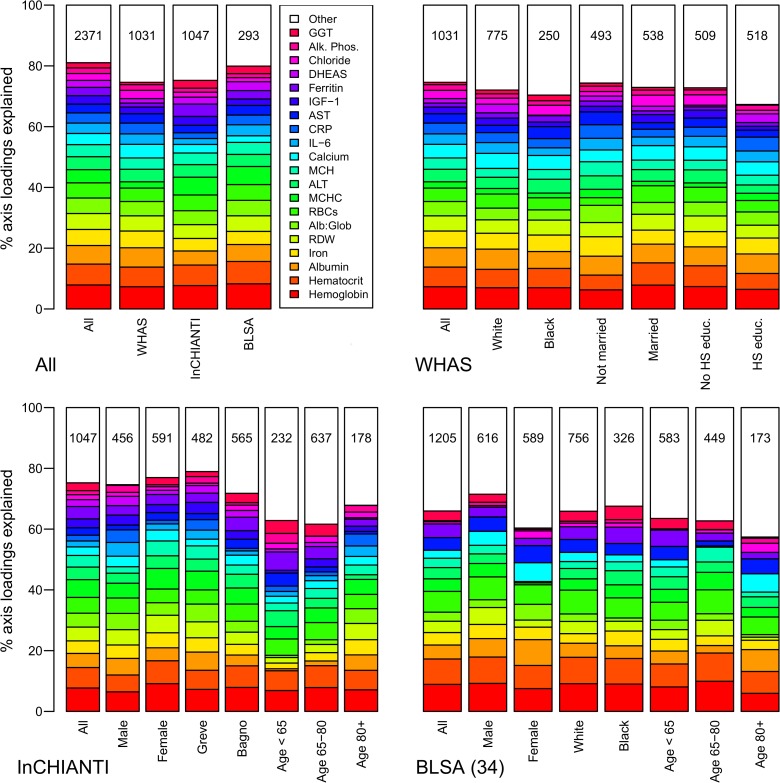
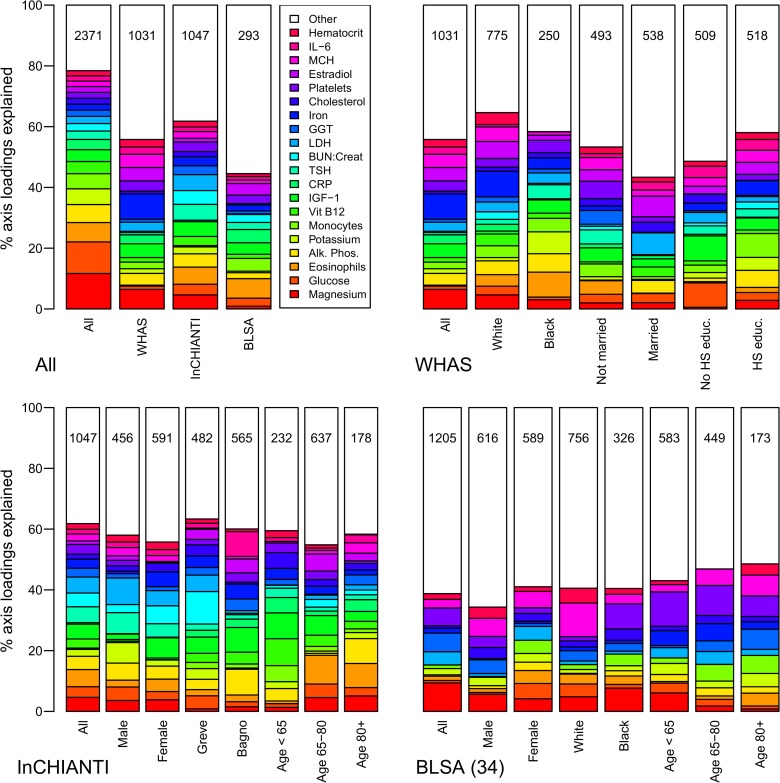
Fig 1 Biomarker loading order and stability for PCA1 across datasets and subsets. Loading importance is calculated as the loading divided by the sum of the absolute values of all loadings. These values are ordered from high (red, on bottom) to low (magenta, on top) for the first 20 loadings; remaining loadings are grouped together as “Other” in white. Accordingly, hemoglobin has the strongest loading, then hematocrit, then albumin, etc. The order and colors are derived from the full analysis combining the first visits of individuals in all three datasets (top-left panel, left column, “All”) and applied to all other columns in the figure. Stability of loadings is indicated by conservation of loading heights across bars. (For an example of unstable loadings, see Fig. 5.) For each panel, the loadings for the full dataset are at left. Numbers indicate subset sample sizes. For all panels except BLSA, the 43-variable set is used; for BLSA there was insufficient sample size to perform PCA on subsets with 43 variables, so the 34-variable analysis is presented.
Fig 1 Biomarker loading order and stability for PCA1 across datasets and subsets. Loading importance is calculated as the loading divided by the sum of the absolute values of all loadings. These values are ordered from high (red, on bottom) to low (magenta, on top) for the first 20 loadings; remaining loadings are grouped together as “Other” in white. Accordingly, hemoglobin has the strongest loading, then hematocrit, then albumin, etc. The order and colors are derived from the full analysis combining the first visits of individuals in all three datasets (top-left panel, left column, “All”) and applied to all other columns in the figure. Stability of loadings is indicated by conservation of loading heights across bars. (For an example of unstable loadings, see Fig. 5.) For each panel, the loadings for the full dataset are at left. Numbers indicate subset sample sizes. For all panels except BLSA, the 43-variable set is used; for BLSA there was insufficient sample size to perform PCA on subsets with 43 variables, so the 34-variable analysis is presented.CC0 · PubMed Central
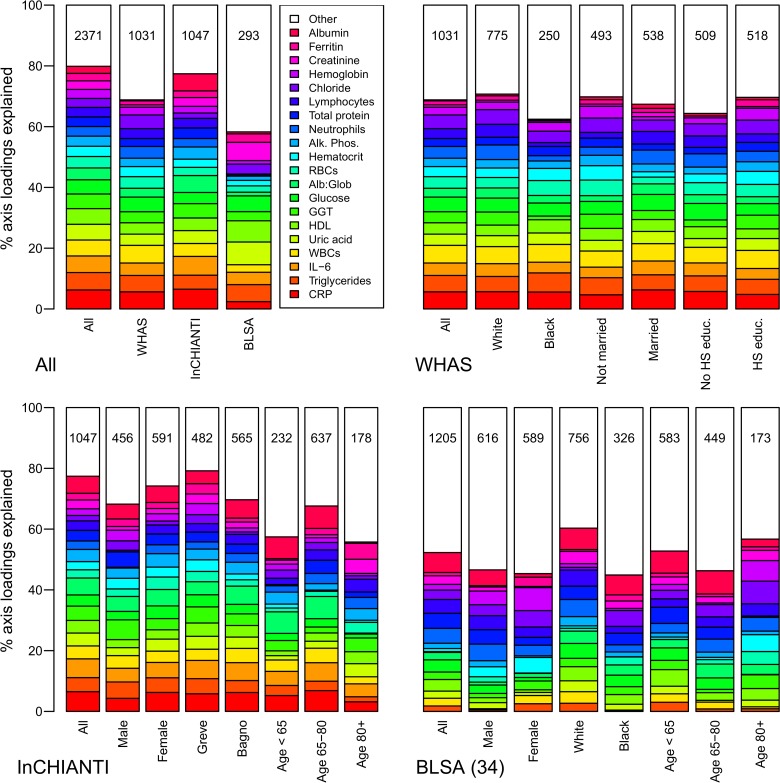
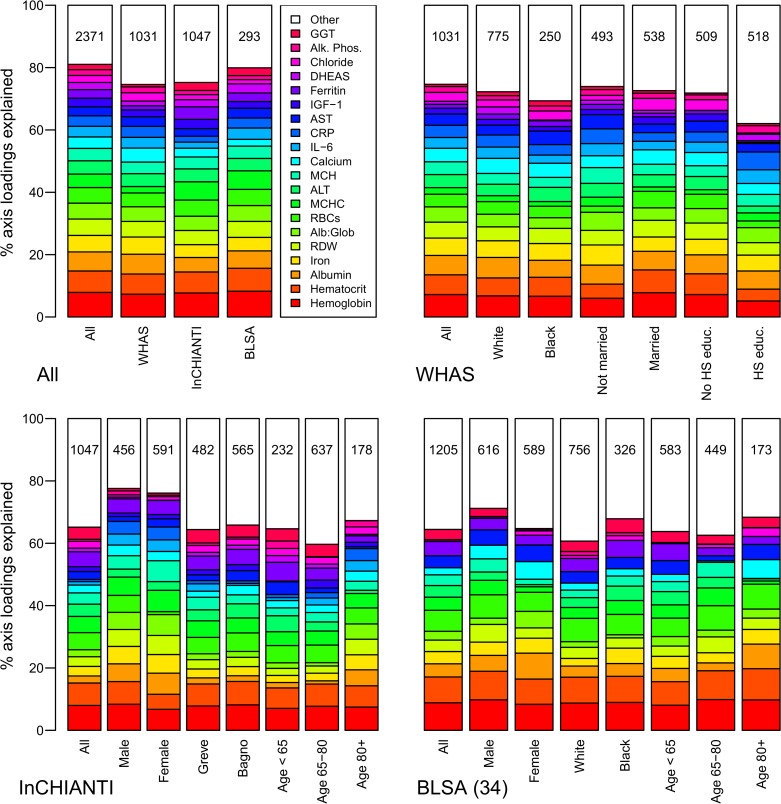
Fig 2 Biomarker loading order and stability for PCA2 across data sets and subsets. Loading importance is calculated as the loading divided by the sum of the absolute values of all loadings. These values are ordered from high (red, on bottom) to low (magenta, on top) for the first 20 loadings; remaining loadings are grouped together as “Other” in white. Accordingly, CRP has the strongest loading, then triglycerides, then IL-6, etc. The order and colors are derived from the full analysis combining the three data sets (left column, top-left panel “All”) and applied to all other columns in the figure. Stability of loadings is indicated by conservation of loading heights across bars. For each panel, the loadings for the full data set are at left. Numbers indicate subset sample sizes. For all panels except BLSA, the 43-variable set is used; for BLSA there was insufficient sample size to perform PCA on subsets with 43 variables, so the 34-variable analysis is presented. The poor performance of BLSA is because several of the key variables in PCA2 are missing in the 34-variable set.
Fig 2 Biomarker loading order and stability for PCA2 across data sets and subsets. Loading importance is calculated as the loading divided by the sum of the absolute values of all loadings. These values are ordered from high (red, on bottom) to low (magenta, on top) for the first 20 loadings; remaining loadings are grouped together as “Other” in white. Accordingly, CRP has the strongest loading, then triglycerides, then IL-6, etc. The order and colors are derived from the full analysis combining the three data sets (left column, top-left panel “All”) and applied to all other columns in the figure. Stability of loadings is indicated by conservation of loading heights across bars. For each panel, the loadings for the full data set are at left. Numbers indicate subset sample sizes. For all panels except BLSA, the 43-variable set is used; for BLSA there was insufficient sample size to perform PCA on subsets with 43 variables, so the 34-variable analysis is presented. The poor performance of BLSA is because several of the key variables in PCA2 are missing in the 34-variable set.CC0 · PubMed Central
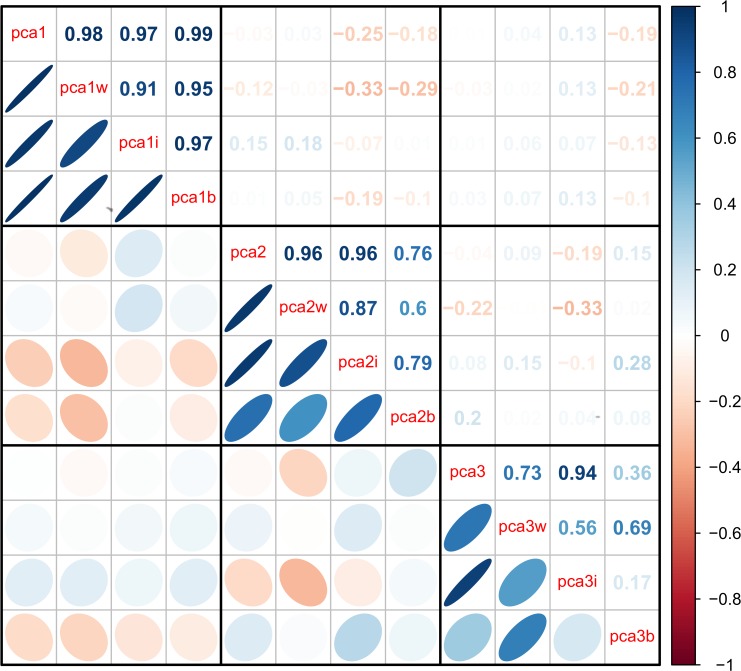
Fig 3 Correlations among the first three PCA axes (“pca1”, “pca2”, and “pca3”). Correlations were calculated from the full merged 43-variable data set or from each of the separate data sets (WHAS: w; InCHIANTI: i; BLSA: b). The loadings from each subset-based PCA are reapplied to the full data set to calculate the scores used in the correlations. Ellipses below the diagonal indicate correlations visually: blue when positive, red when negative, and darker and narrower when stronger. Correlation coefficients are above the diagonal.
Fig 3 Correlations among the first three PCA axes (“pca1”, “pca2”, and “pca3”). Correlations were calculated from the full merged 43-variable data set or from each of the separate data sets (WHAS: w; InCHIANTI: i; BLSA: b). The loadings from each subset-based PCA are reapplied to the full data set to calculate the scores used in the correlations. Ellipses below the diagonal indicate correlations visually: blue when positive, red when negative, and darker and narrower when stronger. Correlation coefficients are above the diagonal.CC0 · PubMed Central
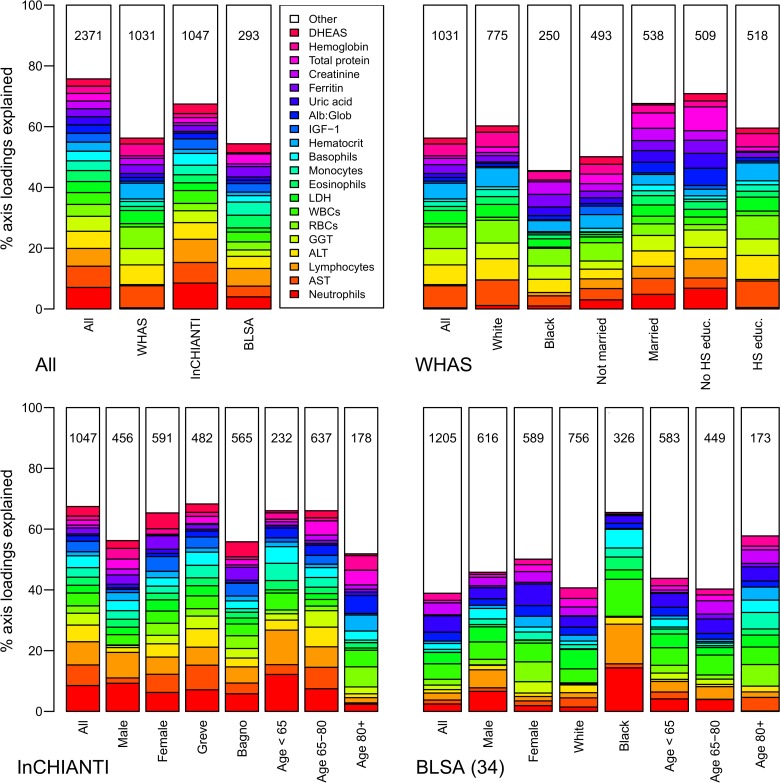
Fig 4 Biomarker loading order and stability for PCA3 across data sets and subsets. Loading importance is calculated as the loading divided by the sum of the absolute values of all loadings. These values are ordered from high (red, on bottom) to low (magenta, on top) for the first 20 loadings; remaining loadings are grouped together as “Other” in white. Accordingly, neutrophils have the strongest loading, then AST, then lymphocytes, etc. The order and colors are derived from the full analysis combining the three data sets (left column, top-left panel “All”) and applied to all other columns in the figure. Stability of loadings is indicated by conservation of loading heights across bars. For each panel, the loadings for the full data set are at left. Numbers indicate subset sample sizes. For all panels except BLSA, the 43-variable set is used; for BLSA there was insufficient sample size to perform PCA on subsets with 43 variables, so the 34-variable analysis is presented.
Fig 4 Biomarker loading order and stability for PCA3 across data sets and subsets. Loading importance is calculated as the loading divided by the sum of the absolute values of all loadings. These values are ordered from high (red, on bottom) to low (magenta, on top) for the first 20 loadings; remaining loadings are grouped together as “Other” in white. Accordingly, neutrophils have the strongest loading, then AST, then lymphocytes, etc. The order and colors are derived from the full analysis combining the three data sets (left column, top-left panel “All”) and applied to all other columns in the figure. Stability of loadings is indicated by conservation of loading heights across bars. For each panel, the loadings for the full data set are at left. Numbers indicate subset sample sizes. For all panels except BLSA, the 43-variable set is used; for BLSA there was insufficient sample size to perform PCA on subsets with 43 variables, so the 34-variable analysis is presented.CC0 · PubMed Central
Fig 5 Biomarker loading order and stability for PCA25 (the 25th axis, chosen randomly as an example of an unstable axis) across data sets and subsets. Loading importance is calculated as the loading divided by the sum of the absolute values of all loadings. These values are ordered from high (red, on bottom) to low (magenta, on top) for the first 20 loadings; remaining loadings are grouped together as “Other” in white. Accordingly, magnesium has the strongest loading, then glucose, then eosinophils, etc. The order and colors are derived from the full analysis combining the three data sets (left column, top-left panel “All”) and applied to all other columns in the figure. Stability of loadings is indicated by conservation of loading heights across bars. For each panel, the loadings for the full data set are at left. Numbers indicate subset sample sizes. For all panels except BLSA, the 43-variable set is used; for BLSA there was insufficient sample size to perform PCA on subsets with 43 variables, so the 34-variable analysis is presented.
Fig 5 Biomarker loading order and stability for PCA25 (the 25th axis, chosen randomly as an example of an unstable axis) across data sets and subsets. Loading importance is calculated as the loading divided by the sum of the absolute values of all loadings. These values are ordered from high (red, on bottom) to low (magenta, on top) for the first 20 loadings; remaining loadings are grouped together as “Other” in white. Accordingly, magnesium has the strongest loading, then glucose, then eosinophils, etc. The order and colors are derived from the full analysis combining the three data sets (left column, top-left panel “All”) and applied to all other columns in the figure. Stability of loadings is indicated by conservation of loading heights across bars. For each panel, the loadings for the full data set are at left. Numbers indicate subset sample sizes. For all panels except BLSA, the 43-variable set is used; for BLSA there was insufficient sample size to perform PCA on subsets with 43 variables, so the 34-variable analysis is presented.CC0 · PubMed Central
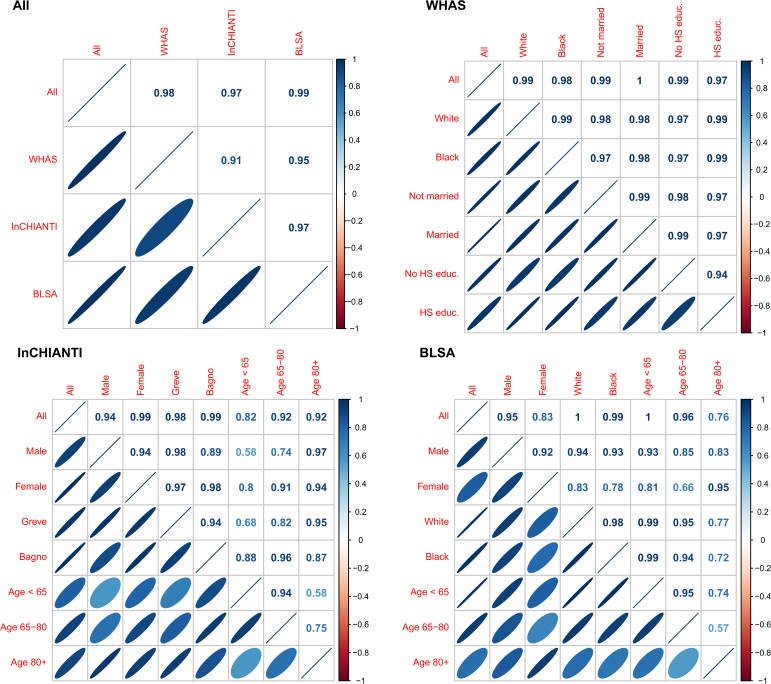
Fig 6 Correlations among versions of PCA1 calculated from the full merged 43-variable dataset or from data subsets. The loadings from each subset-based PCA are reapplied to randomly selected visits of the full dataset to calculate the scores used in the correlations [27,28]. Ellipses below the diagonal indicate correlations visually: blue when positive, red when negative, and darker and narrower when stronger. Correlation coefficients are above the diagonal. For all panels except BLSA, the 43-variable set is used; for BLSA there was insufficient sample size to perform PCA on subsets with 43 variables, so the 34-variable analysis is presented.
Fig 6 Correlations among versions of PCA1 calculated from the full merged 43-variable dataset or from data subsets. The loadings from each subset-based PCA are reapplied to randomly selected visits of the full dataset to calculate the scores used in the correlations [27,28]. Ellipses below the diagonal indicate correlations visually: blue when positive, red when negative, and darker and narrower when stronger. Correlation coefficients are above the diagonal. For all panels except BLSA, the 43-variable set is used; for BLSA there was insufficient sample size to perform PCA on subsets with 43 variables, so the 34-variable analysis is presented.CC0 · PubMed Central
Fig 7 Age-adjusted biomarker loading order and stability for PCA1 across data sets and subsets. Loading importance is calculated as the loading divided by the sum of the absolute values of all loadings. These values are ordered from high (red, on bottom) to low (magenta, on top) for the first 20 loadings; remaining loadings are grouped together as “Other” in white. Accordingly, hemoglobin has the strongest loading, then hematocrit, then albumin, etc. The order and colors are derived from the full analysis combining the first visits of individuals in all three data sets (top-left panel, left column, “All”) and applied to all other columns in the figure. Stability of loadings is indicated by conservation of loading heights across bars. For each panel, the loadings for the full data set are at left. Numbers indicate subset sample sizes. For all panels except BLSA, the 43-variable set is used; for BLSA there was insufficient sample size to perform PCA on subsets with 43 variables, so the 34-variable analysis is presented.
Fig 7 Age-adjusted biomarker loading order and stability for PCA1 across data sets and subsets. Loading importance is calculated as the loading divided by the sum of the absolute values of all loadings. These values are ordered from high (red, on bottom) to low (magenta, on top) for the first 20 loadings; remaining loadings are grouped together as “Other” in white. Accordingly, hemoglobin has the strongest loading, then hematocrit, then albumin, etc. The order and colors are derived from the full analysis combining the first visits of individuals in all three data sets (top-left panel, left column, “All”) and applied to all other columns in the figure. Stability of loadings is indicated by conservation of loading heights across bars. For each panel, the loadings for the full data set are at left. Numbers indicate subset sample sizes. For all panels except BLSA, the 43-variable set is used; for BLSA there was insufficient sample size to perform PCA on subsets with 43 variables, so the 34-variable analysis is presented.CC0 · PubMed Central
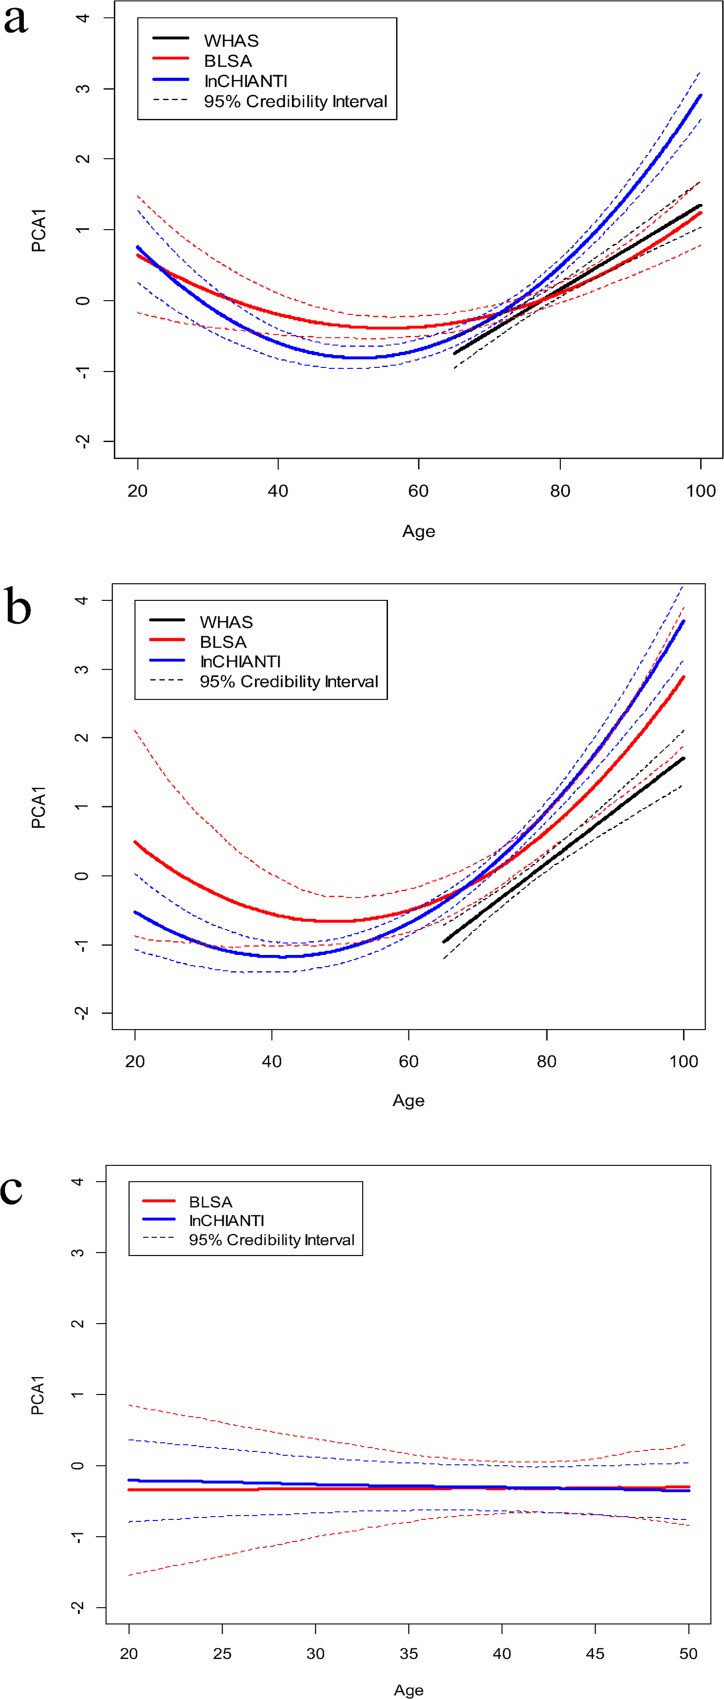
Fig 8 Age trajectories of PCA1 in the three data sets, based on Bayesian mixed models. (a) 34-variable data set; (b) 43-variable data set; (c) ages 20–50 only. In (a) and (b), BLSA and InCHIANTI are based on fixed quadratic models with a random (individual) intercept, while WHAS is based on a fixed linear model with a random intercept. Linear models with random intercept were used in (c). Credibility intervals are based on calculating, independently for each age, which of the 1000 iterations’ trajectories were in the 2.5th and 97.5th percentiles. Note that the better fit of the linear model for WHAS appears to be due to the more limited age range for this dataset.
Fig 8 Age trajectories of PCA1 in the three data sets, based on Bayesian mixed models. (a) 34-variable data set; (b) 43-variable data set; (c) ages 20–50 only. In (a) and (b), BLSA and InCHIANTI are based on fixed quadratic models with a random (individual) intercept, while WHAS is based on a fixed linear model with a random intercept. Linear models with random intercept were used in (c). Credibility intervals are based on calculating, independently for each age, which of the 1000 iterations’ trajectories were in the 2.5th and 97.5th percentiles. Note that the better fit of the linear model for WHAS appears to be due to the more limited age range for this dataset.CC0 · PubMed Central
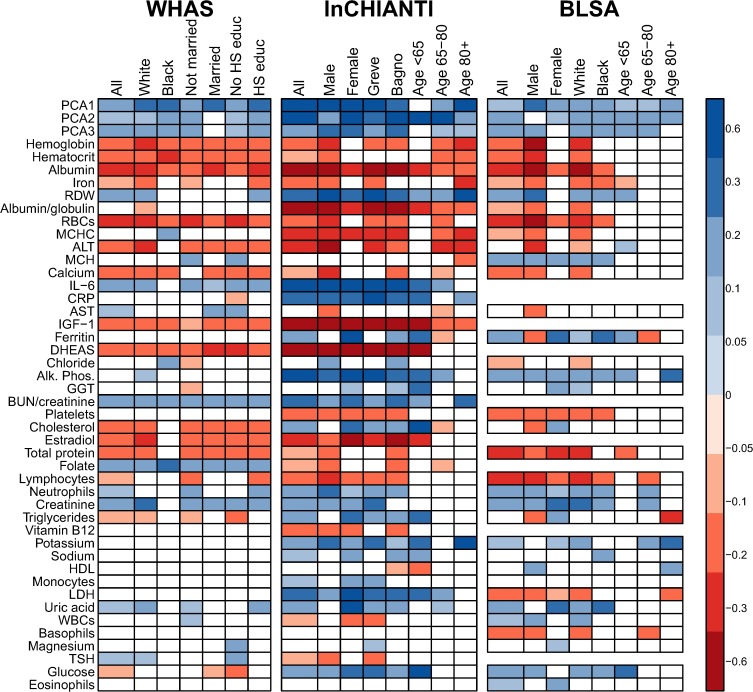
Fig 9 Stability across datasets of correlations between age and PCA axes or biomarkers. Biomarkers are sorted from highest to lowest |loading| in PCA1. Colored boxes indicate significant correlations (p<0.05) with darker shading indicating stronger correlation (blue = positive, red = negative). Note that many biomarkers are significantly correlated in opposite directions in different datasets. Boxes are absent for variables with insufficient sample size in the respective dataset. The weak correlation between age and PCA1 in the youngest subgroup is expected given the non-linear relationship with age (Fig. 8).
Fig 9 Stability across datasets of correlations between age and PCA axes or biomarkers. Biomarkers are sorted from highest to lowest |loading| in PCA1. Colored boxes indicate significant correlations (p<0.05) with darker shading indicating stronger correlation (blue = positive, red = negative). Note that many biomarkers are significantly correlated in opposite directions in different datasets. Boxes are absent for variables with insufficient sample size in the respective dataset. The weak correlation between age and PCA1 in the youngest subgroup is expected given the non-linear relationship with age (Fig. 8).CC0 · PubMed Central
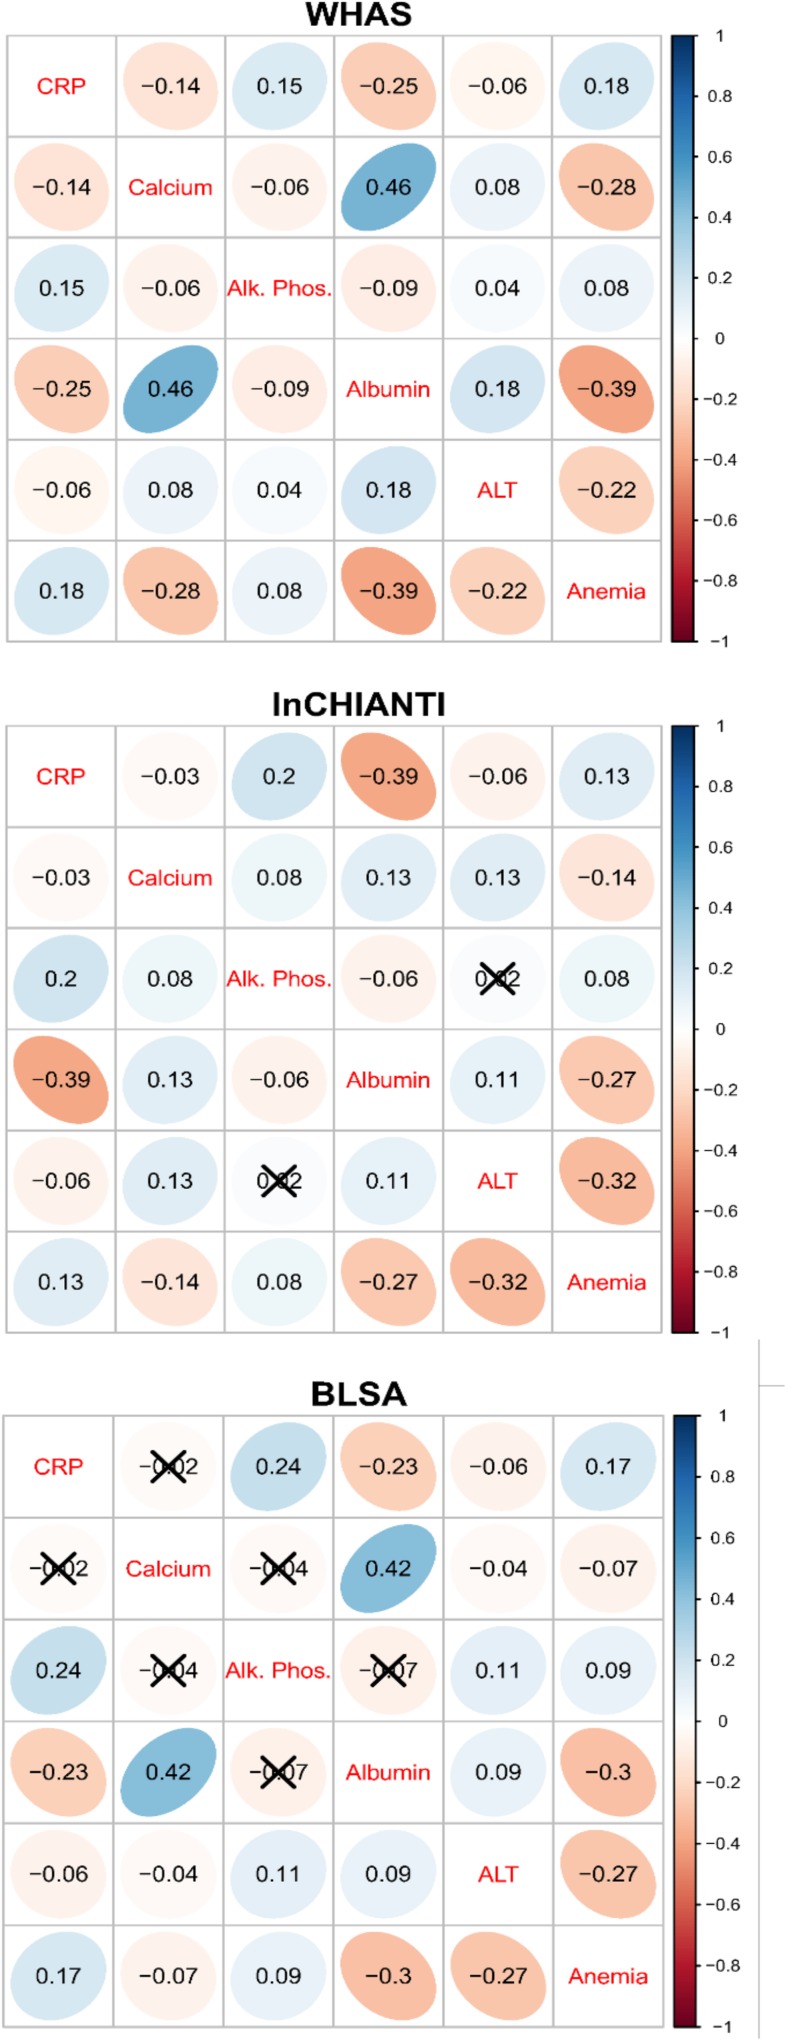
Fig 10 Cross-dataset comparison of pairwise correlations among the main biomarkers determining PCA1. Anemia is based on the first axis of a PCA analysis of anemia-related markers. Ellipses indicate correlations visually: blue when positive, red when negative, and darker and narrower when stronger. Correlation coefficients appear in ellipses and non-significant correlations are marked with an “X”.
Fig 10 Cross-dataset comparison of pairwise correlations among the main biomarkers determining PCA1. Anemia is based on the first axis of a PCA analysis of anemia-related markers. Ellipses indicate correlations visually: blue when positive, red when negative, and darker and narrower when stronger. Correlation coefficients appear in ellipses and non-significant correlations are marked with an “X”.CC0 · PubMed Central
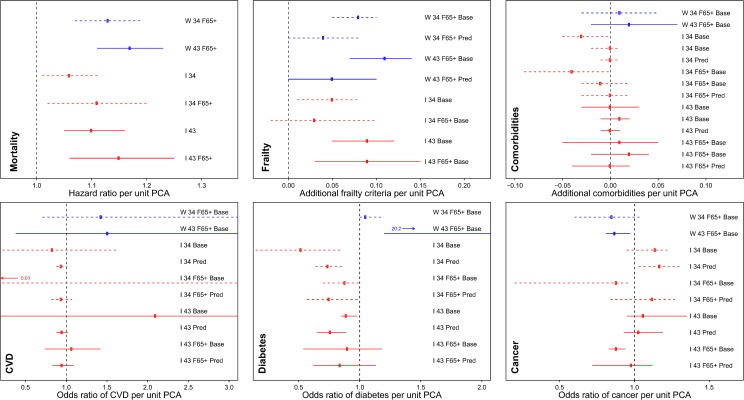
Fig 11 Point estimates with 95% CIs for regression models predicting health outcomes based on PCA1. Blue indicates WHAS and red indicates InCHIANTI. Solid lines are for 43-variable models and dashed lines for 34-variable models. W or I for WHAS or InCHIANTI respectively; 34 or 43 for the number of variables; F65+ if the model only included women aged 65+ (all models for WHAS); Base if the model was a cross-sectional analysis of baseline values, and Pred for models predicting a change in the parameter at the subsequent visit. Poisson regressions not shown; see S1 Results.
Fig 11 Point estimates with 95% CIs for regression models predicting health outcomes based on PCA1. Blue indicates WHAS and red indicates InCHIANTI. Solid lines are for 43-variable models and dashed lines for 34-variable models. W or I for WHAS or InCHIANTI respectively; 34 or 43 for the number of variables; F65+ if the model only included women aged 65+ (all models for WHAS); Base if the model was a cross-sectional analysis of baseline values, and Pred for models predicting a change in the parameter at the subsequent visit. Poisson regressions not shown; see S1 Results.CC0 · PubMed Central

Verification

Claims the paper makes

The claims and statistics of this paper haven’t been checked yet.

Run the check — free, no account needed. It reads the open-access text and checks the sources it cites.

A few free checks a day · papers already verified open instantly · results are public

Claims other papers make about this one

Each is checked against this paper’s own text: does it say what the citing paper says it does?

Self-check

Percentages, sums and reported differences re-computed from the paper’s own numbers.

The self-check needs the paper’s full text.

Citations

Cites

Research works printed but not linked: 38

  1. SM Harman, 2001, Longitudinal Effects of Aging on Serum Total and Free Testosterone Levels in Healthy Men, Journal of Clinical Endocrinology & Metabolism, 86, 724, 10.1210/jcem.86.2.7219 · DOI · Paper page
  2. TE Johnson, 2006, Recent results: Biomarkers of aging, Experimental Gerontology, 41, 1243, 10.1016/j.exger.2006.09.006 · DOI · Paper page
  3. C Franceschi, 2000, Inflamm-aging: An Evolutionary Perspective on Immunosenescence, Annals of the New York Academy of Sciences, 908, 244, 10.1111/j.1749-6632.2000.tb06651.x · DOI · Paper page
  4. AA Cohen, 2012, Physiological regulatory networks: ecological roles and evolutionary constraints, Trends in Ecology & Evolution, 27, 428, 10.1016/j.tree.2012.04.008 · DOI
  5. JH Holland, 1992, Complex Adaptive Systems, Daedalus, 121, 17
  6. JA Dunne, 2002, Food-web structure and network theory: The role of connectance and size, Proceedings of the National Academy of Sciences, 99, 12917, 10.1073/pnas.192407699 · DOI
  7. Lipsitz LA (2004) Physiological Complexity, Aging, and the Path to Frailty. Sci Aging Knowl Environ 2004: pe16-. · DOI
  8. S Vasunilashorn, 2010, Blood lipids, infection, and inflammatory markers in the Tsimane of Bolivia, American Journal of Human Biology, 22, 731, 10.1002/ajhb.21074 · DOI · Paper page
  9. AA Cohen, 2014, Cross-population validation of statistical distance as a measure of physiological dysregulation during aging, Experimental Gerontology, 57, 203, 10.1016/j.exger.2014.04.016 · DOI
  10. AA Cohen, 2013, A novel statistical approach shows evidence for multi-system physiological dysregulation during aging, Mechanisms of Ageing and Development, 134, 110, 10.1016/j.mad.2013.01.004 · DOI
  11. E Nakamura, 1988, Assessment of biological age by principal component analysis, Mechanisms of Ageing and Development, 46, 1, 10.1016/0047-6374(88)90109-1 · DOI · Paper page
  12. J Park, 2009, Developing a biological age assessment equation using principal component analysis and clinical biomarkers of aging in Korean men, Archives of gerontology and geriatrics, 49, 7, 10.1016/j.archger.2008.04.003 · DOI
  13. AS Karlamangla, 2002, Allostatic load as a predictor of functional decline: MacArthur studies of successful aging, Journal of Clinical Epidemiology, 55, 696, 10.1016/S0895-4356(02)00399-2 · DOI · Paper page
  14. P Klemera, 2006, A new approach to the concept and computation of biological age, Mechanisms of ageing and development, 127, 240, 10.1016/j.mad.2005.10.004 · DOI
  15. ME Levine, 2013, Modeling the rate of senescence: can estimated biological age predict mortality more accurately than chronological age?, The Journals of Gerontology Series A: Biological Sciences and Medical Sciences, 68, 667, 10.1093/gerona/gls233 · DOI
  16. L Ferrucci, 2009, The Baltimore Longitudinal Study on Aging: a 50 year long journey and plans for the future, Giornale di Gerontologia, 57, 3
  17. LP Fried, 2000, Preclinical mobility disability predicts incident mobility disability in older women, Journal of gerontology Series A, Biological sciences and medical sciences, 55, M43, 10.1093/gerona/55.1.M43 · DOI
  18. L Ferrucci, 2000, Subsystems contributing to the decline in ability to walk: bridging the gap between epidemiology and geriatric practice in the InCHIANTI study, Journal of the American Geriatrics Society, 48, 1618, 10.1111/j.1532-5415.2000.tb03873.x · DOI
  19. LP Fried, 2001, Frailty in Older Adults: Evidence for a Phenotype Journal of gerontology Series A, Biological sciences and medical sciences, 56, M146
  20. AA Cohen, 2010, The Summary Index of Malaria Surveillance (SIMS): a stable index of malaria within India, Population Health Metrics, 8, 1, 10.1186/1478-7954-8-1 · DOI
  21. JD Hadfield, 2010, MCMC methods for multi-response generalized linear mixed models: The MCMCglmm R package, Journal of Statistical Software, 33, 1, 10.18637/jss.v033.i02 · DOI
  22. A Wagner, 1999, Causality in Complex Systems, Biology and Philosophy, 14, 83, 10.1023/A:1006580900476 · DOI
  23. AM Matteini, 2010, Heritability Estimates of Endophenotypes of Long and Health Life: The Long Life Family Study., The Journals of Gerontology Series A: Biological Sciences and Medical Sciences, 65A, 1375, 10.1093/gerona/glq154 · DOI
  24. E Nemeth, 2003, Hepcidin, a putative mediator of anemia of inflammation, is a type II acute-phase protein, Blood, 101, 2461, 10.1182/blood-2002-10-3235 · DOI · Paper page
  25. L Détivaud, 2005, Hepcidin levels in humans are correlated with hepatic iron stores, hemoglobin levels, and hepatic function, Blood, 106, 746, 10.1182/blood-2004-12-4855 · DOI
  26. Y Xu, 2011, Hepcidin increases intracellular Ca2+ of osteoblast hFOB1.19 through L-type Ca2+ channels, Regulatory Peptides, 172, 58, 10.1016/j.regpep.2011.08.009 · DOI
  27. L Ferrucci, 2010, Proinflammatory state, hepcidin, and anemia in older persons, Blood, 115, 3810, 10.1182/blood-2009-02-201087 · DOI · Paper page
  28. JP de Magalhães, 2009, Meta-analysis of age-related gene expression profiles identifies common signatures of aging, Bioinformatics, 25, 875, 10.1093/bioinformatics/btp073 · DOI · Paper page
  29. Hoffman JM, Soltow QA, Li S, Sidik A, Jones DP, et al. (2014) Effects of age, sex, and genotype on high-sensitivity metabolomic profiles in the fruit fly, Drosophila melanogaster. Aging Cell. · DOI
  30. TBL Kirkwood, 2011, Systems biology of ageing and longevity, Philosophical Transactions of the Royal Society B: Biological Sciences, 366, 64, 10.1098/rstb.2010.0275 · DOI
  31. SM Haffner, 2006, The Metabolic Syndrome: Inflammation, Diabetes Mellitus, and Cardiovascular Disease, The American Journal of Cardiology, 97, 3, 10.1016/j.amjcard.2005.11.010 · DOI
  32. H Kitano, 2002, Computational systems biology, Nature, 420, 206, 10.1038/nature01254 · DOI · Paper page
  33. V Morrisette-Thomas, 2014, Inflamm-aging does not simply reflect increases in pro-inflammatory markers, Mechanisms of Ageing and Development, 139, 49, 10.1016/j.mad.2014.06.005 · DOI · Paper page
  34. L Guarente, 2000, Genetic pathways that regulate ageing in model organisms, Nature, 408, 255, 10.1038/35041700 · DOI
  35. AM Kulminski, 2013, Unraveling genetic origin of aging-related traits: evolving concepts, Rejuvenation research, 16, 304, 10.1089/rej.2013.1441 · DOI
  36. L Hood, 2003, Systems biology: integrating technology, biology, and computation, Mechanisms of Ageing and Development, 124, 9, 10.1016/S0047-6374(02)00164-1 · DOI
  37. H Xue, 2007, A modular network model of aging, Molecular Systems Biology, 3
  38. CA Pearson, 2013, Network Class Superposition Analyses, PloS one, 8, e59046, 10.1371/journal.pone.0059046 · DOI

Cited by

Sorted by citations

See all 75

Metadata

Authors
Cohen, A. A., Milot, E., Li, Q., Bergeron, P., Poirier, R., Dusseault-Bélanger, F., Fülöp, T., Leroux, M., Legault, V., Metter, E. J., Fried, L. P., & Ferrucci, L.
Venue
PLOS ONE
Published
2015-03-11
Volume
10
Issue
3
Pages
e0116489
ISSN
1932-6203
Cited by
75
References
6
Language
en

About these checks

Registry, retraction, Cites and statistics results are computed, not judged, with one exception: a printed reference that no index lists is read once by a model before it counts as a citation error. Claims are extracted by a model and kept only when their quote appears verbatim in the text; each cited source is then checked, with a model’s help, for whether it says what the claim relies on. Those verdicts can be wrong — read the claim’s quote and the cited source before relying on one.

Statistics and arithmetic are recomputed, not judged.

Confidence bands are shown only for fields calibrated on our annotated test set. None is calibrated yet, so no band is shown.

What counts as a claim ›How we measure confidence ›How we check this ›

Are you an author, or do you see a problem with this page? Request a review