

The DOI matches its Crossref record; 17 of the 19 references it cites were found in a registry or an index, and 1 are not checked yet.
Patterns and Emerging Trends in Global Ocean Health
Open accessAbstract
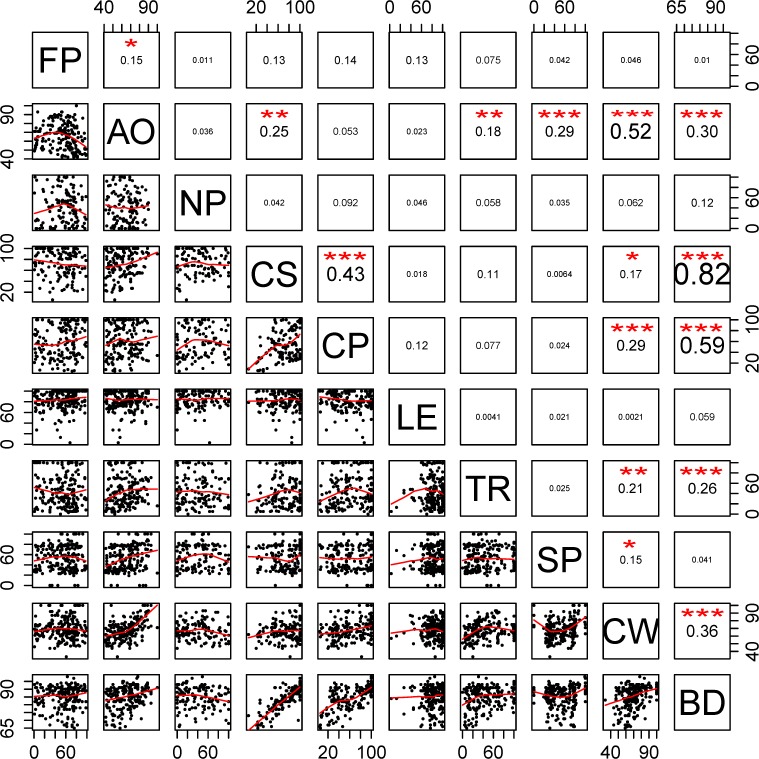
International and regional policies aimed at managing ocean ecosystem health need quantitative and comprehensive indices to synthesize information from a variety of sources, consistently measure progress, and communicate with key constituencies and the public. Here we present the second annual global assessment of the Ocean Health Index, reporting current scores and annual changes since 2012, recalculated using updated methods and data based on the best available science, for 221 coastal countries and territories. The Index measures performance of ten societal goals for healthy oceans on a quantitative scale of increasing health from 0 to 100, and combines these scores into a single Index score, for each country and globally. The global Index score improved one point (from 67 to 68), while many country-level Index and goal scores had larger changes. Per-country Index scores ranged from 41-95 and, on average, improved by 0.06 points (range -8 to +12). Globally, average scores increased for individual goals by as much as 6.5 points (coastal economies) and decreased by as much as 1.2 points (natural products). Annual updates of the Index, even when not all input data have been updated, provide valuable information to scientists, policy makers, and resource managers because patterns and trends can emerge from the data that have been updated. Changes of even a few points indicate potential successes (when scores increase) that merit recognition, or concerns (when scores decrease) that may require mitigative action, with changes of more than 10-20 points representing large shifts that deserve greater attention. Goal scores showed remarkably little covariance across regions, indicating low redundancy in the Index, such that each goal delivers information about a different facet of ocean health. Together these scores provide a snapshot of global ocean health and suggest where countries have made progress and where a need for further improvement exists.
Overview
The claims and statistics of this paper haven’t been checked yet.
Run the check — free, no account needed. It reads the open-access text and checks the sources it cites.
Integrity signals
Registry
Cites
Statistics
Figures
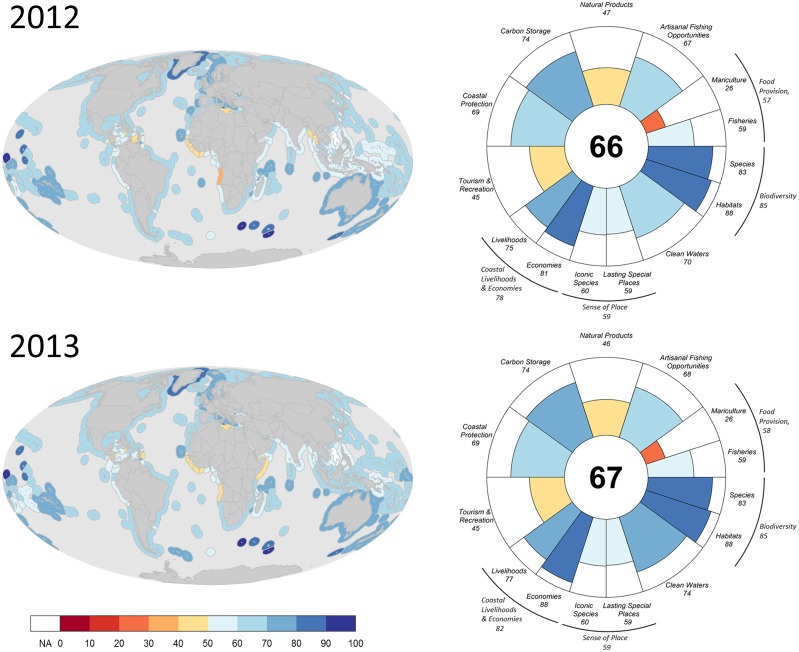
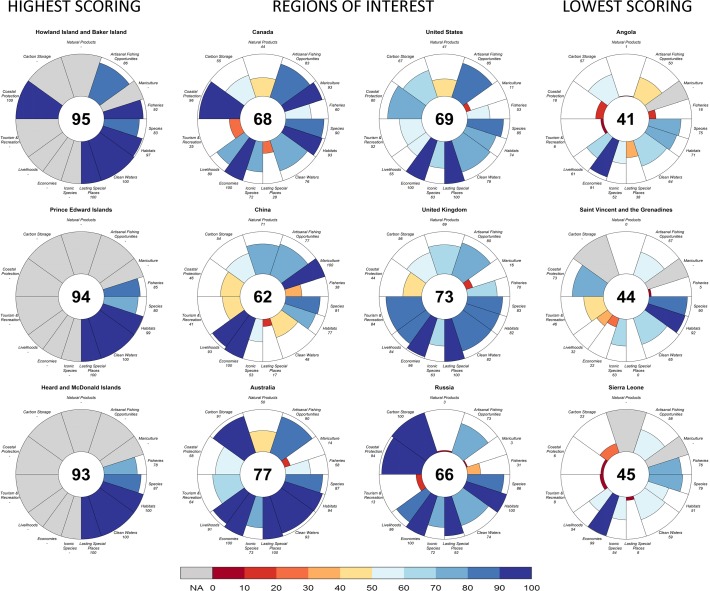
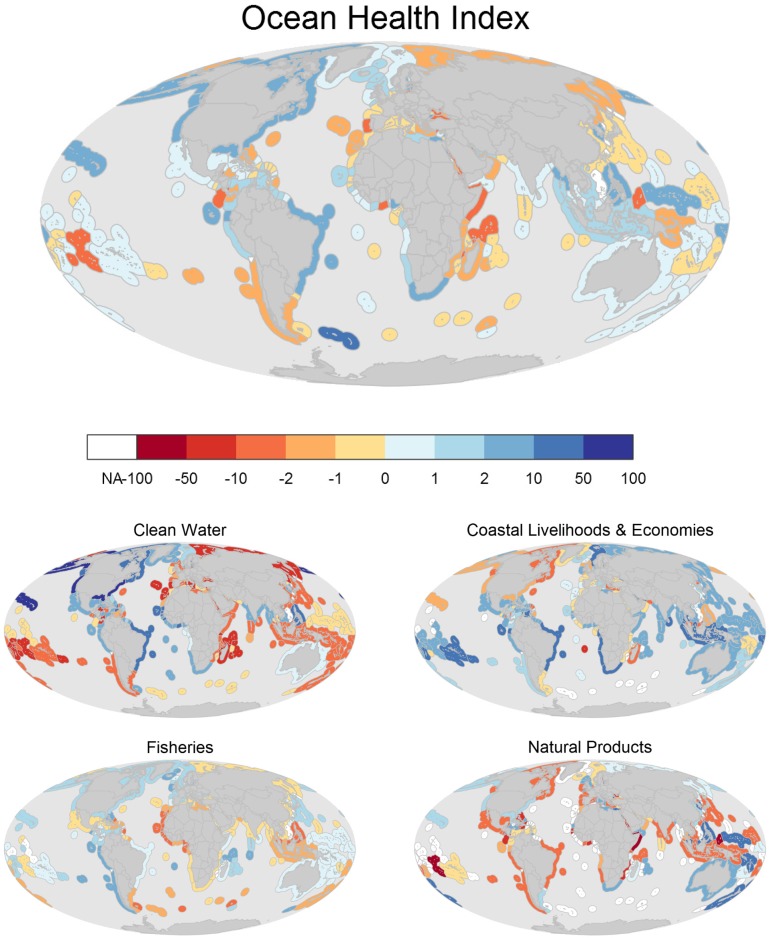
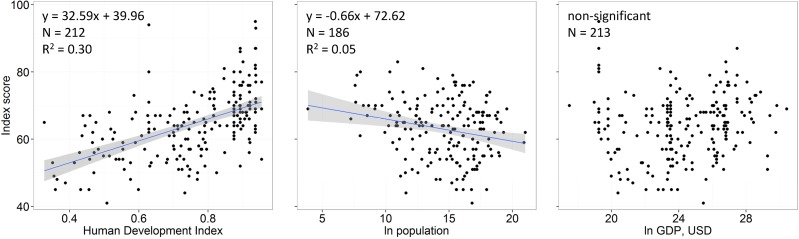
Verification
Claims the paper makes
The claims and statistics of this paper haven’t been checked yet.
Run the check — free, no account needed. It reads the open-access text and checks the sources it cites.
Claims other papers make about this one
Each is checked against this paper’s own text: does it say what the citing paper says it does?
The check wasn’t confident either way, so it gives no verdict — never disputed.
In the citing paper
“66% of ocean surface is experiencing increasing cumulative impacts ( 20 )”
From Pervasive human-driven decline of life on Earth points to the need for transformative change (2019) · cites this paper as [20]
Experimental — accuracy not yet measured
Self-check
Percentages, sums and reported differences re-computed from the paper’s own numbers.
The self-check needs the paper’s full text.
Citations
Cites
The United Nations Development Programme
Oestreich, J. E. (2017) · Oxford University Press eBooks · doi:10.1093/acprof:oso/9780190637347.003.0003 · Cited by 4,875
Population diversity and the portfolio effect in an exploited species
Schindler, D. E., Hilborn, R., Chasco, B., Boatright, C. P., Quinn, T. P., Rogers, L. A., & Webster, M. S. (2010) · Nature · doi:10.1038/nature09060 · Cited by 1,605
An index to assess the health and benefits of the global ocean
Halpern, B. S., Longo, C., Hardy, D. R., McLeod, K. L., Samhouri, J. F., Katona, S. K., Kleisner, K. M., Lester, S. E., O’Leary, J. K., Ranelletti, M., et al. (2012) · Nature · doi:10.1038/nature11397 · Cited by 965
Self-citationStatus and Solutions for the World’s Unassessed Fisheries
Costello, C., Ovando, D., Hilborn, R., Gaines, S. D., Deschenes, O., & Lester, S. E. (2012) · Science · doi:10.1126/science.1223389 · Cited by 796
World Development Indicators 2013
Bank, W. (2013) · doi:10.1596/978-0-8213-9824-1 · Cited by 724
Warfare in Biodiversity Hotspots
Hanson, T. R., Brooks, T. M., da Fonseca, G. A. B., Hoffmann, M., Lamoreux, J. F., Machlis, G. E., Mittermeier, C. G., Mittermeier, R. A., & Pilgrim, J. D. (2009) · Conservation Biology · doi:10.1111/j.1523-1739.2009.01166.x · Cited by 382
A simple method for estimating MSY from catch and resilience
Martell, S. J. D., & Froese, R. (2012) · Fish and Fisheries · doi:10.1111/j.1467-2979.2012.00485.x · Cited by 328
Food security implications of global marine catch losses due to overfishing
Srinivasan, U. T., Cheung, W. W. L., Watson, R., & Sumaila, U. R. (2010) · Journal of Bioeconomics · doi:10.1007/s10818-010-9090-9 · Cited by 220
Marine Strategy Framework Directive
Froese, R. (2013) · Cited by 174
Sea sick? Setting targets to assess ocean health and ecosystem services
Samhouri, J. F., Lester, S. E., Selig, E. R., Halpern, B. S., Fogarty, M. J., Longo, C., & McLeod, K. L. (2012) · Ecosphere · doi:10.1890/es11-00366.1 · Cited by 110
Self-citation
Research works printed but not linked: 1
- BS Halpern, 2013, Reply to Branch et al, Nature, 495, E7
Cited by
Sorted by citations
Pervasive human-driven decline of life on Earth points to the need for transformative change
Díaz, S., Settele, J., Brondízio, E. S., Ngo, H. T., Agard, J., Arneth, A., Balvanera, P., Brauman, K. A., Butchart, S. H. M., Chan, K. M. A., et al. (2019) · Science · doi:10.1126/science.aax3100 · Cited by 2,926
Global patterns in mangrove soil carbon stocks and losses
Atwood, T. B., Connolly, R. M., Almahasheer, H., Carnell, P. E., Duarte, C. M., Ewers Lewis, C. J., Irigoien, X., Kelleway, J. J., Lavery, P. S., Macreadie, P. I., et al. (2017) · Nature Climate Change · doi:10.1038/nclimate3326 · Cited by 706
Underestimating the Challenges of Avoiding a Ghastly Future
Bradshaw, C. J. A., Ehrlich, P. R., Beattie, A. J., Ceballos, G., Crist, E. L., Diamond, J., Dirzo, R., Ehrlich, A. H., Harte, J., Harte, M. E., et al. (2021) · Frontiers in Conservation Science · doi:10.3389/fcosc.2020.615419 · Cited by 591
Environmental sustainability: challenges and viable solutions
Arora, N. K., Fatima, T., Mishra, I., Verma, M., Mishra, J., & Mishra, V. K. (2018) · Environmental Sustainability · doi:10.1007/s42398-018-00038-w · Cited by 367
Overview of Integrative Assessment of Marine Systems: The Ecosystem Approach in Practice
Borja, Á., Elliott, M., Andersen, J. H., Berg, T., Carstensen, J., Halpern, B. S., Heiskanen, A., Korpinen, S., Lowndes, J. S., Martin, G., et al. (2016) · Frontiers in Marine Science · doi:10.3389/fmars.2016.00020 · Cited by 345
Self-citationOur path to better science in less time using open data science tools
Lowndes, J. S., Best, B. D., Scarborough, C., Afflerbach, J. C., Frazier, M. R., O’Hara, C. C., Jiang, N., & Halpern, B. S. (2017) · Nature Ecology & Evolution · doi:10.1038/s41559-017-0160 · Cited by 304
Self-citationMapping human pressures on biodiversity across the planet uncovers anthropogenic threat complexes
Bowler, D. E., Bjorkman, A. D., Dornelas, M., Myers‐Smith, I. H., Navarro, L. M., Niamir, A., Supp, S. R., Waldock, C., Winter, M., Vellend, M., et al. (2020) · People and Nature · doi:10.1002/pan3.10071 · Cited by 287
Miya, M. U., Gotoh, R. O., & Sado, T. (2020) · Fisheries Science · doi:10.1007/s12562-020-01461-x · Cited by 288
Strong sustainability in coastal areas: a conceptual interpretation of SDG 14
Neumann, B., Ott, K., & Kenchington, R. A. (2017) · Sustainability Science · doi:10.1007/s11625-017-0472-y · Cited by 254
Navigating uncertainty in environmental composite indicators
Burgass, M. J., Halpern, B. S., Nicholson, E., & Milner-Gulland, E. J. (2017) · Ecological Indicators · doi:10.1016/j.ecolind.2016.12.034 · Cited by 176
Self-citationFisheries management impacts on target species status
Melnychuk, M. C., Peterson, E., Elliott, M., & Hilborn, R. W. (2016) · Proceedings of the National Academy of Sciences · doi:10.1073/pnas.1609915114 · Cited by 176
Ocean commitments under the Paris Agreement
Gallo, N. D., Victor, D. G., & Levin, L. A. (2017) · Nature Climate Change · doi:10.1038/nclimate3422 · Cited by 149
New High-Tech Flexible Networks for the Monitoring of Deep-Sea Ecosystems
Aguzzi, J., Chatzievangelou, D., Marini, S., Fanelli, E., Danovaro, R., Flögel, S., Bris, N. L., Juanes, F., Léo, F. C. D., Fernández, J. D. R., et al. (2019) · Environmental Science & Technology · doi:10.1021/acs.est.9b00409 · Cited by 142
Global and regional priorities for marine biodiversity protection
Jenkins, C. N., & Houtan, K. S. V. (2016) · Biological Conservation · doi:10.1016/j.biocon.2016.10.005 · Cited by 128
The ocean’s movescape: fisheries management in the bio-logging decade (2018–2028)
Lowerre‐Barbieri, S. K., Kays, R., Thorson, J. T., & Wikelski, M. C. (2018) · ICES Journal of Marine Science · doi:10.1093/icesjms/fsy211 · Cited by 104
Rickels, W., Dovern, J., Hoffmann, J., Quaas, M. F., Schmidt, J. O., & Visbeck, M. H. (2016) · Earth s Future · doi:10.1002/2016ef000353 · Cited by 98
The state of Western Australia’s coral reefs
Gilmour, J., Cook, K. L., Ryan, N. M., Puotinen, M. L., Green, R. H., Shedrawi, G., Hobbs, J., Thomson, D. P., Babcock, R. C., Buckee, J., et al. (2019) · Coral Reefs · doi:10.1007/s00338-019-01795-8 · Cited by 89
Cochrane, K. L. (2020) · Fish and Fisheries · doi:10.1111/faf.12521 · Cited by 102
Franke, A., Blenckner, T., Duarte, C. M., Ott, K., Fleming, L. E., Antia, A., Reusch, T. B. H., Bertram, C., Hein, J., Kronfeld-Goharani, U., et al. (2020) · One Earth · doi:10.1016/j.oneear.2020.05.013 · Cited by 79
Evaluation, Gap Analysis, and Potential Expansion of the Finnish Marine Protected Area Network
Virtanen, E., Viitasalo, M., Lappalainen, J., & Moilanen, A. (2018) · Frontiers in Marine Science · doi:10.3389/fmars.2018.00402 · Cited by 86
Halpern, B. S., Longo, C., Scarborough, C., Hardy, D. R., Best, B. D., Doney, S. C., Katona, S. K., McLeod, K. L., Rosenberg, A. A., & Samhouri, J. F. (2014) · PLoS ONE · doi:10.1371/journal.pone.0098995 · Cited by 71
Self-citationHemispheric asymmetry in ocean change and the productivity of ecosystem sentinels
Sydeman, W. J., Schoeman, D. S., Thompson, S. A., Hoover, B. A., García‐Reyes, M., Daunt, F., Agnew, P., Anker‐Nilssen, T., Barbraud, C., Barrett, R. T., et al. (2021) · Science · doi:10.1126/science.abf1772 · Cited by 67
Getting to 2030 - Scaling effort to ambition through a narrative model of the SDGs
Obura, D. O. (2020) · Marine Policy · doi:10.1016/j.marpol.2020.103973 · Cited by 74
Buttigieg, P. L., Fadeev, E., Bienhold, C., Hehemann, L., Offre, P., & Boëtius, A. (2018) · Current Opinion in Microbiology · doi:10.1016/j.mib.2018.01.015 · Cited by 70
Ekardt, F., Günther, P., Hagemann, K., Garske, B., Heyl, K., & Weyland, R. (2023) · Environmental Sciences Europe · doi:10.1186/s12302-023-00786-5 · Cited by 88
Circles of Coastal Sustainability: A Framework for Coastal Management
de Alencar, N. M. P., Tissier, M. D. A. L., Paterson, S. K., & Newton, A. (2020) · Sustainability · doi:10.3390/su12124886 · Cited by 61
Silburn, B., Kröger, S., Parker, E. R., Sivyer, D. B., Hicks, N., Powell, C., Johnson, M. T., & Greenwood, N. (2017) · Biogeochemistry · doi:10.1007/s10533-017-0323-z · Cited by 68
Coastal Development: Resilience, Restoration and Infrastructure Requirements
Steven, A., Addo, K. A., Llewellyn, G., Ca, V. T., Boateng, I., Bustamante, R., Doropoulos, C., Gillies, C., Hemer, M., Lopes, P., et al. (2023) · Springer eBooks · doi:10.1007/978-3-031-16277-0_7 · Cited by 61
Drivers and implications of change in global ocean health over the past five years
Halpern, B. S., Frazier, M. R., Afflerbach, J. C., O’Hara, C. C., Katona, S. K., Lowndes, J. S., Jiang, N., Pacheco, E. J., Scarborough, C., & Polsenberg, J. F. (2017) · PLoS ONE · doi:10.1371/journal.pone.0178267 · Cited by 55
Self-citationBuilding on a Decade of the Ocean Health Index
Halpern, B. S. (2020) · One Earth · doi:10.1016/j.oneear.2019.12.011 · Cited by 54
Self-citationCochrane, S., Andersen, J. H., Berg, T., Blanchet, H., Borja, Á., Carstensen, J., Elliott, M., Hummel, H., Niquil, N., & Renaud, P. E. (2016) · Frontiers in Marine Science · doi:10.3389/fmars.2016.00248 · Cited by 55
Won, N., Kim, K., Kang, J. H., Park, S. W., & Lee, H. (2017) · International Journal of Environmental Research and Public Health · doi:10.3390/ijerph14020130 · Cited by 53
Pavlidou, A., Simboura, N., Pagou, Κ., Assimakopoulou, G., Gerakaris, V., Hatzianestis, I., Panayotidis, P., Pantazi, M., Papadopoulou, N. K., Reizopoulou, S., et al. (2018) · Ecological Indicators · doi:10.1016/j.ecolind.2018.09.007 · Cited by 52
The Baltic Health Index (BHI): Assessing the social–ecological status of the Baltic Sea
Blenckner, T., Möllmann, C., Lowndes, J. S., Griffiths, J., Campbell, E., Cervo, A. D., Belgrano, A., Boström, C., Fleming, V., Frazier, M. R., et al. (2021) · People and Nature · doi:10.1002/pan3.10178 · Cited by 53
Self-citationMovescapes and eco‐evolutionary movement strategies in marine fish: Assessing a connectivity hotspot
Lowerre-Barbieri, S., Friess, C., Griffin, L., Morley, D., Skomal, G., Bickford, J., Hammerschlag, N., Rider, M., Smukall, M. J., Bergmann, M. V. Z. V. Z., et al. (2021) · Fish and Fisheries · doi:10.1111/faf.12589 · Cited by 45
Blueprints of Effective Biodiversity and Conservation Knowledge Products That Support Marine Policy
Weatherdon, L. V., Appeltans, W., Bowles-Newark, N., Brooks, T. M., Davis, F. E., Despot-Belmonte, K., Fletcher, S., Garilao, C., Hilton‐Taylor, C., Hirsch, T., et al. (2017) · Frontiers in Marine Science · doi:10.3389/fmars.2017.00096 · Cited by 50
Mardones, F. O., Paredes, F., Medina, M. H., Tello, A., Valdivia, V., Ibarra, R., Correa, J. A., & Gelcich, S. (2017) · Aquaculture · doi:10.1016/j.aquaculture.2017.09.048 · Cited by 48
Marine mammals as indicators of Anthropocene Ocean Health
Plön, S., Andra, K., Auditore, L.-M., Claire, G., Hale, P. J., Hampe, O., Ramilo-Henry, M., Burkhardt‐Holm, P., Jaigirdar, A. M., Klein, L., et al. (2024) · npj Biodiversity · doi:10.1038/s44185-024-00055-5 · Cited by 59
Management approaches to conserve Australia’s marine ecosystem under climate change
Bay, L. K., Gilmour, J., Muir, B., & Hardisty, P. E. (2023) · Science · doi:10.1126/science.adi3023 · Cited by 44
Measuring indicators of ocean health for an island nation: The ocean health index for Fiji
Selig, E. R., Frazier, M. R., O’Leary, J. K., Jupiter, S. D., Halpern, B. S., Longo, C., Kleisner, K., Sivo, L., & Ranelletti, M. (2015) · Ecosystem Services · doi:10.1016/j.ecoser.2014.11.007 · Cited by 43
Self-citationRockwood, R. C., Elliott, M. L., Saenz, B. T., Nur, N., & Jahncke, J. (2020) · PLoS ONE · doi:10.1371/journal.pone.0235603 · Cited by 42
Aligning marine species range data to better serve science and conservation
O’Hara, C. C., Afflerbach, J. C., Scarborough, C., Kaschner, K., & Halpern, B. S. (2017) · PLoS ONE · doi:10.1371/journal.pone.0175739 · Cited by 38
Self-citationProper antibiotics use in the Chilean salmon industry: Policy and technology bottlenecks
Avendaño-Herrera, R. E. (2018) · Aquaculture · doi:10.1016/j.aquaculture.2018.06.072 · Cited by 34
Wu, Z., Chen, R., Meadows, M. E., & Liu, X. (2021) · Ecological Indicators · doi:10.1016/j.ecolind.2021.107650 · Cited by 33
Preparing for the future: integrating spatial ecology into ecosystem-based management
Lowerre‐Barbieri, S. K., Catalán, I. A., Opdal, A. F., & Jørgensen, C. (2019) · ICES Journal of Marine Science · doi:10.1093/icesjms/fsy209 · Cited by 33
Best practices for assessing ocean health in multiple contexts using tailorable frameworks
Lowndes, J. S., Pacheco, E. J., Best, B. D., Scarborough, C., Longo, C., Katona, S. K., & Halpern, B. S. (2015) · PeerJ · doi:10.7717/peerj.1503 · Cited by 31
Self-citationde Oliveira, B. M., Boumans, R. M. J., Fath, B. D., & Harari, J. (2022) · Ecological Modelling · doi:10.1016/j.ecolmodel.2022.109953 · Cited by 29
Longo, C., Frazier, M. R., Doney, S. C., Rheuban, J. E., Humberstone, J. M., & Halpern, B. S. (2017) · Frontiers in Marine Science · doi:10.3389/fmars.2017.00020 · Cited by 27
Self-citationIncorporating public priorities in the Ocean Health Index: Canada as a case study
Daigle, R., Archambault, P., Halpern, B. S., Lowndes, J. S., & Côté, I. M. (2017) · PLoS ONE · doi:10.1371/journal.pone.0178044 · Cited by 27
Self-citationA pan-Arctic assessment of the status of marine social-ecological systems
Burgass, M. J., Milner-Gulland, E., Lowndes, J. S. S., O'Hara, C., Afflerbach, J., & Halpern, B. (2018) · Regional Environmental Change · doi:10.1007/s10113-018-1395-6 · Cited by 24
Self-citationBusiness for ocean sustainability: Early responses of ocean governance in the private sector
Sardá, R., Pogutz, S., Silvio, M. D., Allevi, V., Saputo, A., Daminelli, R., Fumagalli, F., Totaro, L., Rizzi, G., Magni, G., et al. (2022) · AMBIO · doi:10.1007/s13280-022-01784-2 · Cited by 26
Baltic Sea: A Recovering Future From Decades of Eutrophication
Heiskanen, A., Bonsdorff, E., & Joas, M. (2019) · Elsevier eBooks · doi:10.1016/b978-0-12-814003-1.00020-4 · Cited by 28
Perspectives on a Global Observing System to Assess Ocean Health
Duarte, C. M., Poiner, I. R., & Gunn, J. (2018) · Frontiers in Marine Science · doi:10.3389/fmars.2018.00265 · Cited by 25
Bryhn, A. C., Bergek, S., Bergström, U., Casini, M., Dahlgren, E., Ek, C., Hjelm, J., Königson, S. J., Ljungberg, P., Lundström, K., et al. (2022) · Ocean & Coastal Management · doi:10.1016/j.ocecoaman.2022.106154 · Cited by 29
Mapping Uncertainty Due to Missing Data in the Global Ocean Health Index
Frazier, M. R., Longo, C., & Halpern, B. S. (2016) · PLoS ONE · doi:10.1371/journal.pone.0160377 · Cited by 24
Self-citationFerreira, M., Monteiro, S., Torres, J., Oliveira, I., Sequeira, M., López, A., Vingada, J. V., & Eira, C. (2016) · Environmental Pollution · doi:10.1016/j.envpol.2016.01.027 · Cited by 23
Fulfilling global marine commitments; lessons learned from Gabon
Metcalfe, K., WHITE, L. J. T., Lee, M. E., Fay, J. M., Abitsi, G., Parnell, R. J., Smith, R. J., Agamboué, P. D., Bayet, J. P., Beh, J. H. M., et al. (2022) · Conservation Letters · doi:10.1111/conl.12872 · Cited by 21
ecocomDP: A flexible data design pattern for ecological community survey data
O'Brien, M. C., Smith, C. A., Sokol, E. R., Gries, C., Lany, N. K., Record, S., & Castorani, M. C. N. (2021) · Ecological Informatics · doi:10.1016/j.ecoinf.2021.101374 · Cited by 21
Moullec, F., Asselot, R., Auch, D., Blöcker, A. M., Börner, G., Färber, L., Ofelio, C., Petzold, J., Santelia, M. E., Schwermer, H., et al. (2021) · Environmental Evidence · doi:10.1186/s13750-021-00234-y · Cited by 21
Zuo, J., Zhang, L., Chen, B., Liao, J., Hashim, M., Sutrisno, D., Hasan, M. E., Mahmood, R., & Sani, D. A. (2023) · Heliyon · doi:10.1016/j.heliyon.2023.e17440 · Cited by 19
The geography of the Anthropocene differs between the land and the seaPreprint
Bowler, D. E., Bjorkman, A. D., Dornelas, M., Myers‐Smith, I. H., Navarro, L. M., Niamir, A., Supp, S. R., Waldock, C. A., Vellend, M., Blowes, S. A., et al. (2018) · bioRxiv (Cold Spring Harbor Laboratory) · doi:10.1101/432880 · Cited by 18
Method for the quantitative evaluation of ecosystem services in coastal regions
Okada, T., Yugo, M. I. T. O., Iseri, E., Takahashi, T., Sugano, T., Akiyama, Y., Watanabe, K., Tanaya, T., Sugino, H., Tokunaga, K., et al. (2019) · PeerJ · doi:10.7717/peerj.6234 · Cited by 17
Navigating the seascape of ocean management: waypoints on the voyage toward sustainable usePreprint
Katona, S. K., Polsenberg, J. F., Lowndes, J. S., Halpern, B. S., Pacheco, E. J., Mosher, L., Kilponen, A., Papacostas, K. J., Guzmán-Mora, A. G., Farmer, G., et al. (2017) · doi:10.31230/osf.io/79w2d · Cited by 16
Self-citationLewis, J., Collison, J., & Pillay, D. (2022) · Scientific Reports · doi:10.1038/s41598-022-09099-8 · Cited by 15
Castro-Cadenas, M. D., Loiseau, C., Reimer, J. M., & Claudet, J. (2022) · The Science of The Total Environment · doi:10.1016/j.scitotenv.2022.156423 · Cited by 14
Biodiversity, coastal protection and resource endowment: Policy options for improving ocean health
Nguyen, K. A. T., Jolly, C. M., & Nguelifack, B. M. (2018) · Journal of Policy Modeling · doi:10.1016/j.jpolmod.2018.02.002 · Cited by 17
Strengthening resilience potential assessments for coral reef management
Gudka, M., Obura, D. O., Treml, E. A., & Nicholson, E. (2024) · Methods in Ecology and Evolution · doi:10.1111/2041-210x.14303 · Cited by 12
Heinze, C., Blenckner, T., Brown, P. J., Fröb, F., Morée, A. L., New, A. L., Nissen, C., Rynders, S., Seguro, I., Aksenov, Y., et al. (2023) · BGD · doi:10.5194/bg-2023-182 · Cited by 11
Giménez, J., Cañadas, A., de Stephanis, R., & Ramírez, F. (2021) · Marine Environmental Research · doi:10.1016/j.marenvres.2021.105305 · Cited by 10
Hull, T., Greenwood, N., Birchill, A. J., Beaton, A. D., Palmer, M. R., & Kaiser, J. (2021) · Biogeosciences · doi:10.5194/bg-18-6167-2021 · Cited by 10
Tan, İ., Atabay, H., Evcen, A., Kurt, G., Taşkın, E., & Beken, Ç. P. (2023) · Marine Pollution Bulletin · doi:10.1016/j.marpolbul.2023.115424 · Cited by 9
Marine permaculture: Design principles for productive seascapes
Spillias, S., Herzen, B. P. V., & Holmgren, D. (2024) · One Earth · doi:10.1016/j.oneear.2024.01.012 · Cited by 11
Han, X., Gill, M. J., Hamilton, H., Vergara, S. G., & Young, B. E. (2019) · Environmental and Sustainability Indicators · doi:10.1016/j.indic.2019.100017 · Cited by 10
Speciesism, Science, and Society
Swartz, B., & Mishler, B. D. (2022) · Springer eBooks · doi:10.1007/978-3-030-99031-2_1 · Cited by 8
Seaweed community traits reveal transient shifts and a stable attractor on tropical reefs
Fong, C. R., Smith, L. L., Barbee, B., Layton, J., Velasco, B., Barber, P. H., & Fong, P. (2025) · Environmental Research Letters · doi:10.1088/1748-9326/adbd57 · Cited by 8
Rieder, J., Jahnke, M., André, C., Christiansen, H., Wit, P. D., Faust, E., Green, L., Jonsson, P. R., Laikre, L., Laugen, A. T., et al. (2025) · Marine Policy · doi:10.1016/j.marpol.2025.106867 · Cited by 8
Assessing marine ecosystem risks through unsupervised methods
Pavirani, L., Bove, P., & Coro, G. (2025) · Ecological Informatics · doi:10.1016/j.ecoinf.2025.103334 · Cited by 7
MAPPING THE ANTHROPOGENIC OCEAN: A CRITICAL GIS APPROACH
Warren, S., Bampton, M., Cornick, L. A., & Patolo, N. (2023) · Geographical Review · doi:10.1080/00167428.2023.2168542 · Cited by 7
Establishing historical benthic cover levels for coral reefs of the Western Indian Ocean
Gudka, M., Aboud, S. A., & Obura, D. O. (2023) · Western Indian Ocean Journal of Marine Science · doi:10.4314/wiojms.v22i1.11 · Cited by 7
Changes in ocean health in British Columbia from 2001 to 2016
O’Hara, C. C., Scarborough, C., Hunter, K. L., Afflerbach, J. C., Bodtker, K. M., Frazier, M. R., Lowndes, J. S., Perry, R. I., & Halpern, B. S. (2020) · PLoS ONE · doi:10.1371/journal.pone.0227502 · Cited by 7
Self-citationOcean health in the Northeast United States from 2005 to 2017
Montgomery, J. C., Scarborough, C., Shumchenia, E. J., Verstaen, J., Napoli, N., & Halpern, B. S. (2021) · People and Nature · doi:10.1002/pan3.10223 · Cited by 6
Self-citationIncreased signal of fishing pressure on community life‐history traits at larger spatial scales
McKeon, C. M., Buckley, Y. M., Moriarty, M., Lundy, M. G., & Kelly, R. (2024) · Global Ecology and Biogeography · doi:10.1111/geb.13815 · Cited by 6
Islam, S. M. (2015) · Maritime Commons The Digital Repository of World Maritime University (World Maritime University) · Cited by 6
Riera, R., Vasconcelos, J., Baden, S. P., Martínez, A., & Infantes, E. (2025) · PLoS ONE · doi:10.1371/journal.pone.0334934 · Cited by 5
O’Carroll, J. P. J., Kennedy, R. M., Ren, L., Nash, S., Hartnett, M., & Brown, C. (2017) · Estuarine Coastal and Shelf Science · doi:10.1016/j.ecss.2017.08.005 · Cited by 5
D’Onofrio, R., Vitelletti, M. L., Riminucci, F., Rossi, V., & Capotondi, L. (2025) · Biology · doi:10.3390/biology14040421 · Cited by 4
Quantifying uncertainty in the wild‐caught fisheries goal of the Ocean Health Index
Afflerbach, J. C., Frazier, M. R., Froehlich, H. E., Anderson, S. C., & Halpern, B. S. (2019) · Fish and Fisheries · doi:10.1111/faf.12346 · Cited by 4
Self-citationDerycke, S., Maes, S., den Bulcke, L. V., Vanhollebeke, J., Wittoeck, J., Hillewaert, H., Ampe, B., Haegeman, A., Hostens, K., & Backer, A. D. (2020) · doi:10.22541/au.159665093.39993653 · Cited by 4
Riccialdelli, L., Diez, M. J., Boy, C. C., Cabreira, A. G., Menna, B. V., & Lovrich, G. A. (2025) · Marine Ecology Progress Series · doi:10.3354/meps14873 · Cited by 3
Lima, A. D. F., C., G., Santos, M. C. M., Bezerra, L. E. A., & Cavalcante, R. M. (2025) · Chemosphere · doi:10.1016/j.chemosphere.2025.144729 · Cited by 3
Gene expression and wildlife health: varied interpretations based on perspective
Bowen, L., Yee, J. L., Bodkin, J. L., Waters, S. C., Murray, M. J., Coletti, H. A., Ballachey, B. E., Monson, D. H., & Miles, A. K. (2023) · Frontiers in Ecology and Evolution · doi:10.3389/fevo.2023.1157700 · Cited by 3
Trueb, L., Gacutan, J., Praphotjanaporn, T., Blazquez, M. A., & Milligan, B. M. (2024) · Marine Policy · doi:10.1016/j.marpol.2024.106410 · Cited by 3
Corrales, X. (2019) · UPCommons institutional repository (Universitat Politècnica de Catalunya) · doi:10.5821/dissertation-2117-131431 · Cited by 3
Tahir, S., Safeer, E., & Ahmad, F. (2024) · The Springer series in applied machine learning · doi:10.1007/978-3-031-64642-3_9 · Cited by 2
de Quirós, Y. B., Arregui, M., Arbelo, M., Castro‐Alonso, A., Câmara, N., Clayton, Z. S., Consoli, F., Fahlman, A., Palomino‐Schätzlein, M., Puig‐Lozano, R., et al. (2024) · Marine Mammal Science · doi:10.1111/mms.13200 · Cited by 2
Ecosystem Risk Assessment Through Stressor Concurrency Identification: A Comparative Analysis
Pavirani, L., Bove, P., & Coro, G. (2025) · MTS/IEEE OCEANS Conference (OCEANS) · doi:10.1109/oceans58557.2025.11104682 · Cited by 2
Abri, I. A., Gülseven, O., & Akintola, A. (2025) · Food and Humanity · doi:10.1016/j.foohum.2025.100942 · Cited by 2
Composite indices for the comprehensive assessment of coastal wetlands: a global systematic review
de Souza, G. M., Ruiz‐Campos, G., Seingier, G., Villada-Canela, M., Gudiño‐Elizondo, N., & Ramírez-Herrejón, J. P. (2026) · Wetlands Ecology and Management · doi:10.1007/s11273-026-10123-1 · Cited by 2
Nguyen, K. A. T., Jolly, C. M., Nguelifack, B. M., & Nguyen, T. A. T. (2022) · Environmental Management · doi:10.1007/s00267-022-01696-7 · Cited by 3
de Piura, U., & Yesan, P. L. Z. (2023) · Vox juris · doi:10.24265/voxjuris.2023.v41n2.08 · Cited by 2
Metadata
- Authors
- Halpern, B. S., Longo, C., Lowndes, J. S. S., Best, B. D., Frazier, M., Katona, S. K., Kleisner, K. M., Rosenberg, A. A., Scarborough, C., & Selig, E. R.
- Affiliations
- University of California, Santa Barbara (US)
- National Center for Ecological Analysis and Synthesis (US)
- Duke University (US)
- Conservation International (US)
- University of British Columbia (CA)
- Union of Concerned Scientists (US)
- Corresponding author
- Halpern, Benjamin S.
- ORCID
- Venue
- PLOS ONE
- Publisher
- Public Library of Science (PLoS)
- Published
- 2015-03-16
- Volume
- 10
- Issue
- 3
- Pages
- e0117863
- ISSN
- 1932-6203 (ISSN-L)
- PMC
- PMC4361765
- OpenAlex
- W2163939760
- Cited by
- 139
- References
- 19
- Citations by year
- 2026: 7 · 2025: 11 · 2024: 14 · 2023: 15 · 2022: 10 · 2021: 16 · 2020: 10 · 2019: 14 · 2018: 12 · 2017: 15 · 2016: 8 · 2015: 6
- FWCI
- 38.51
- Type
- journal article
- Language
- en
- Open access
- gold
- doi.org
- Licence
- Locations
- PLoS ONE (publishedVersion, cc-by)
- Europe PMC (PubMed Central) (publishedVersion, cc-by)
- PubMed Central (publishedVersion, cc-by)
- PubMed (publishedVersion)
- DOAJ (DOAJ: Directory of Open Access Journals) (submittedVersion, cc-by-sa)
- eScholarship (California Digital Library) (submittedVersion)
- eScholarship (California Digital Library) (submittedVersion, cc-by)
- Funders
- David and Lucile Packard Foundation
- Oak Foundation
- National Geographic Society
- Topics
- Physical Sciences › Environmental Science › Management, Monitoring, Policy and Law › Coastal and Marine Management
- Physical Sciences › Environmental Science › Management, Monitoring, Policy and Law › Sustainable Development and Environmental Policy
- Life Sciences › Agricultural and Biological Sciences › Aquatic Science › Marine and fisheries research
- Keywords
- Ocean Health Index, ocean health, marine ecosystem health, coastal countries, marine policy, coastal economy, natural products
- MeSH terms
- Conservation of Natural Resources, Fisheries, Oceans and Seas, Ecosystem, Internationality, Ecological and Environmental Phenomena
About these checks
Registry, retraction, Cites and statistics results are computed, not judged, with one exception: a printed reference that no index lists is read once by a model before it counts as a citation error. Claims are extracted by a model and kept only when their quote appears verbatim in the text; each cited source is then checked, with a model’s help, for whether it says what the claim relies on. Those verdicts can be wrong — read the claim’s quote and the cited source before relying on one.
Statistics and arithmetic are recomputed, not judged.
Confidence bands are shown only for fields calibrated on our annotated test set. None is calibrated yet, so no band is shown.
What counts as a claim ›How we measure confidence ›How we check this ›
Are you an author, or do you see a problem with this page? Request a review
