

The DOI matches its Crossref record; 33 of the 33 references it cites were found in a registry or an index.
HIF-1α Promotes Epithelial-Mesenchymal Transition and Metastasis through Direct Regulation of ZEB1 in Colorectal Cancer
Open accessAbstract
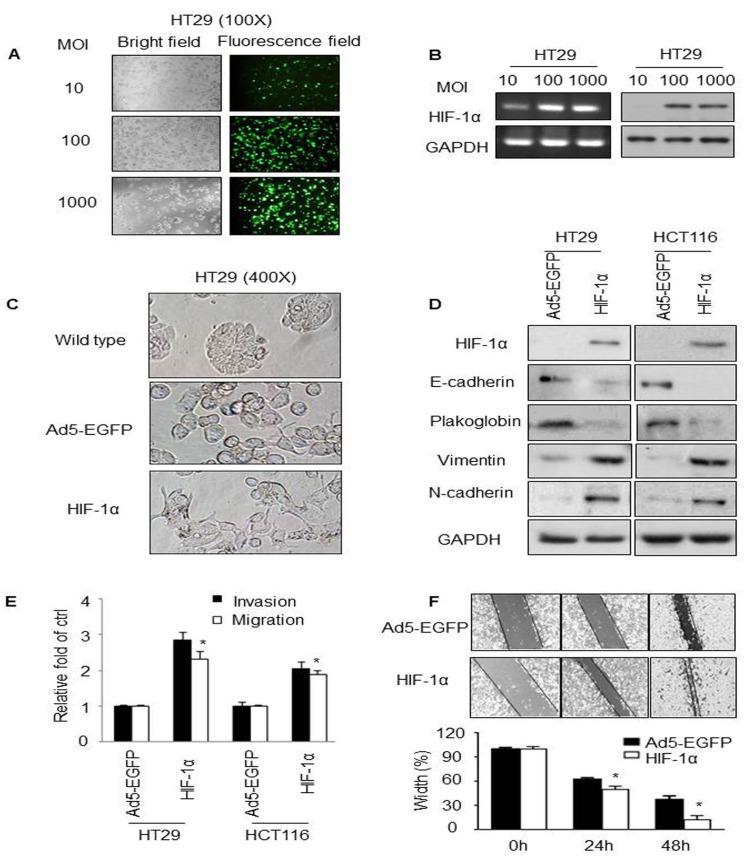
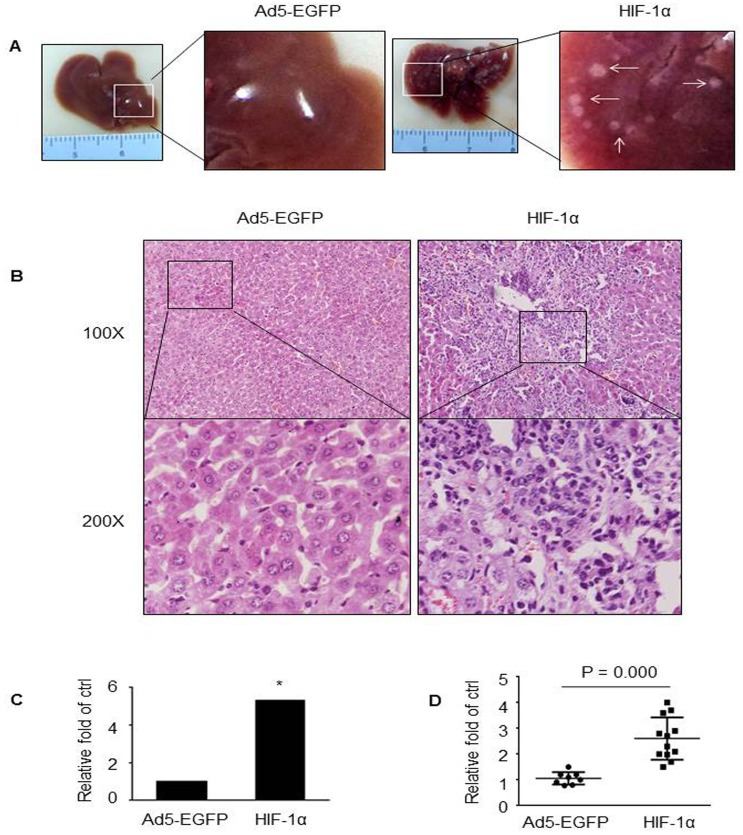
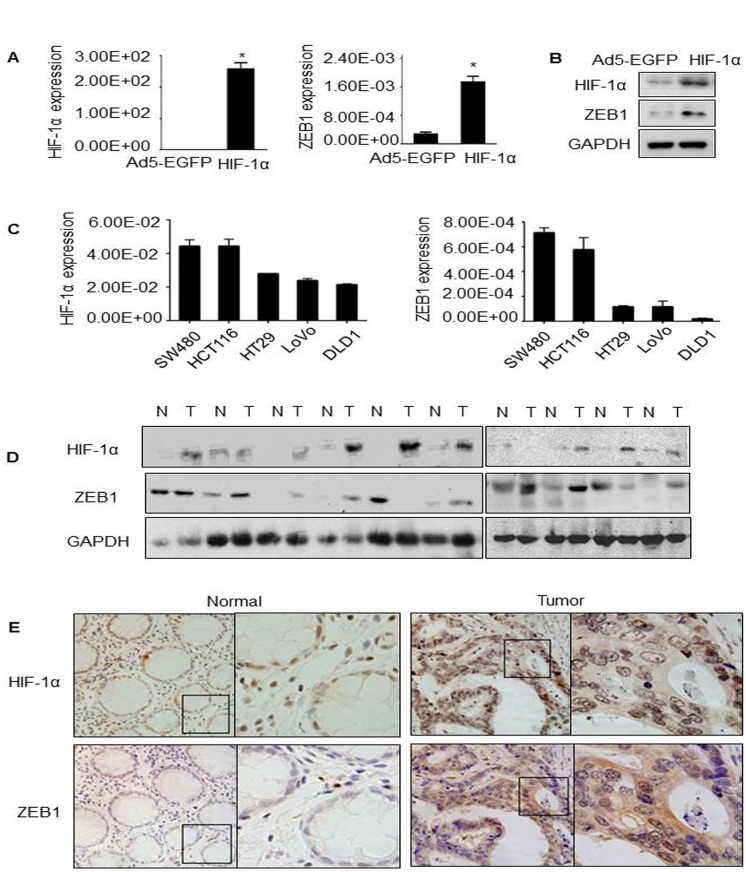
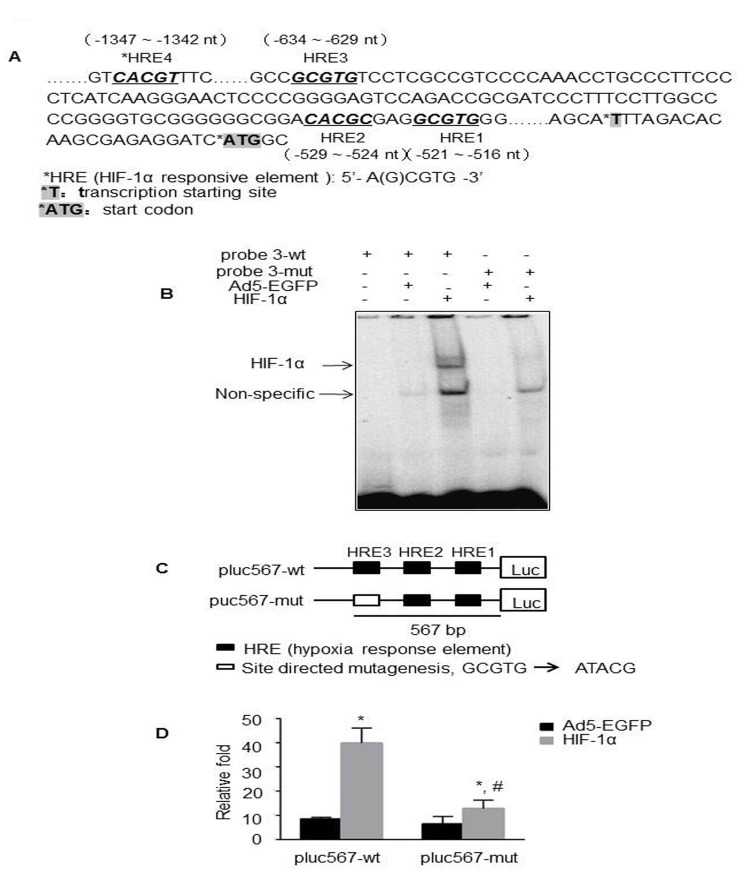
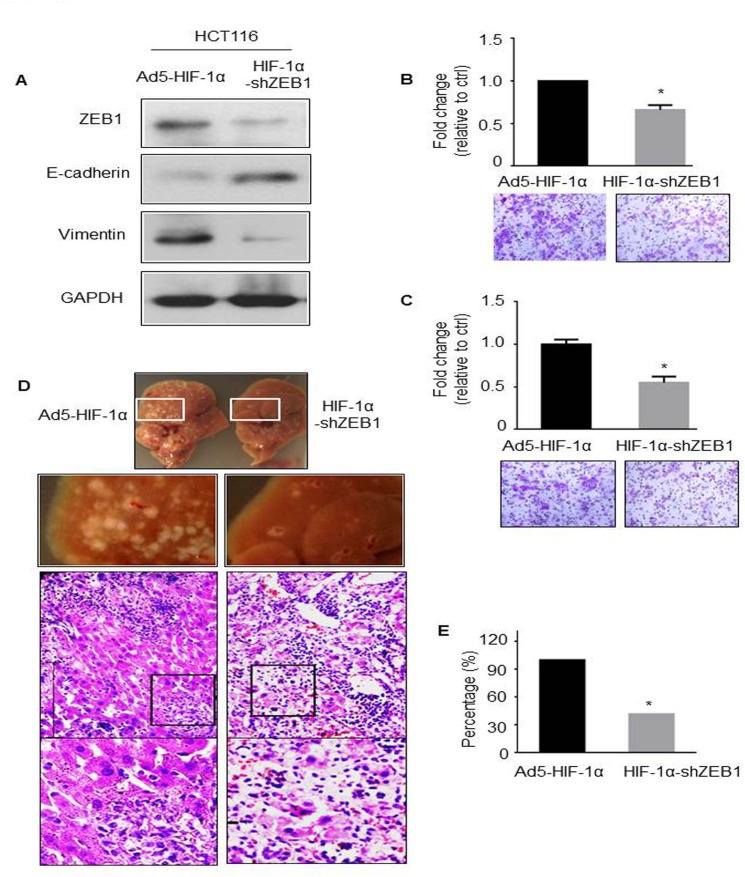
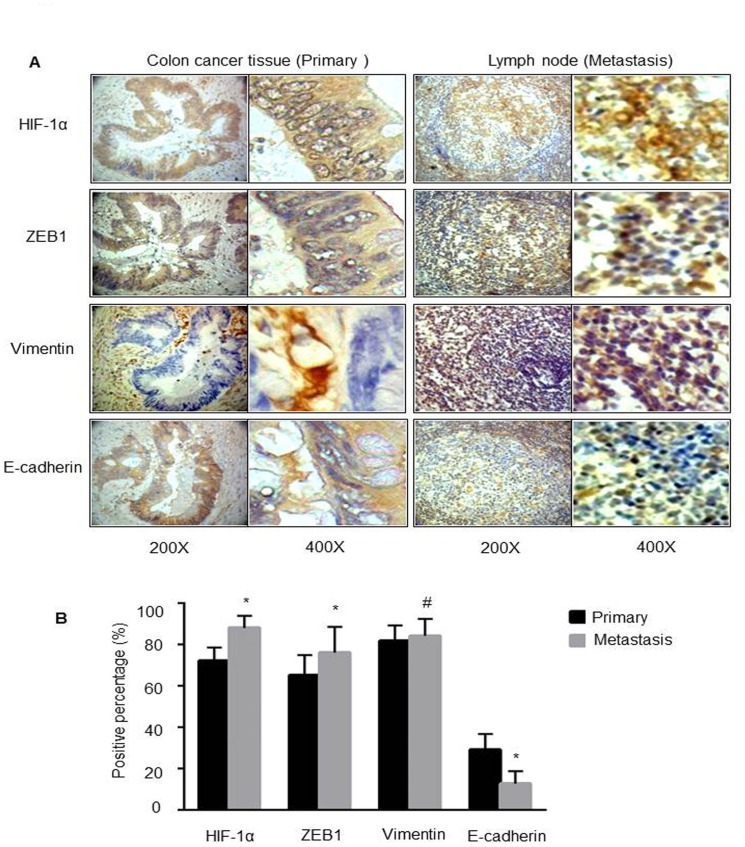
It is well recognized that hypoxia-inducible factor 1 alpha (HIF-1α) is involved in cancer metastasis, chemotherapy and poor prognosis. We previously found that deferoxamine, a hypoxia-mimetic agent, induces epithelial-mesenchymal transition (EMT) in colorectal cancer. Therefore, here we explored a new molecular mechanism for HIF-1α contributing to EMT and cancer metastasis through binding to ZEB1. In this study, we showed that overexpression of HIF-1α with adenovirus infection promoted EMT, cell invasion and migration in vitro and in vivo. On a molecular level, HIF-1α directly binding to the proximal promoter of ZEB1 via hypoxia response element (HRE) sites thus increasing the transactivity and expression of ZEB1. In addition, inhibition of ZEB1 was able to abrogate the HIF-1α-induced EMT and cell invasion. HIF-1α expression was highly correlated with the expression of ZEB1 in normal colorectal epithelium, primary and metastatic CRC tissues. Interestingly, both HIF-1α and ZEB1 were positively associated with Vimentin, an important mesenchymal marker of EMT, whereas negatively associated with E-cadherin expression. These findings suggest that HIF-1α enhances EMT and cancer metastasis by binding to ZEB1 promoter in CRC. HIF-1α and ZEB1 are both widely considered as tumor-initiating factors, but our results demonstrate that ZEB1 is a direct downstream of HIF-1α, suggesting a novel molecular mechanism for HIF-1α-inducing EMT and cancer metastasis.
Overview
The claims and statistics of this paper haven’t been checked yet.
Run the check — free, no account needed. It reads the open-access text and checks the sources it cites.
Integrity signals
Registry
Cites
Statistics
Figures
Verification
Claims the paper makes
The claims and statistics of this paper haven’t been checked yet.
Run the check — free, no account needed. It reads the open-access text and checks the sources it cites.
Claims other papers make about this one
Each is checked against this paper’s own text: does it say what the citing paper says it does?
In the citing paper
“Studies have demonstrated that HIF has a direct regulatory effect on EMT‐related proteins, such as zinc finger E‐box binding homeobox 1, Snail and Twist.”
From Hypoxia signaling in cancer: Implications for therapeutic interventions (2023) · cites this paper as [87]
In the citing paper
“A direct role for HIF in the regulation of key EMT transcription factors such as ZEB1, Snail, and Twist has been demonstrated through the identification of functional hypoxia response elements (HREs) within the regulatory elements of these genes”
From Hypoxic control of metastasis (2016) · cites this paper as [73]
Self-check
Percentages, sums and reported differences re-computed from the paper’s own numbers.
The self-check needs the paper’s full text.
Citations
Cites
The basics of epithelial-mesenchymal transition
Kalluri, R., & Weinberg, R. A. (2009) · Journal of Clinical Investigation · doi:10.1172/jci39104 · Cited by 10,196
Biomarkers for epithelial-mesenchymal transitions
Zeisberg, M., & Neilson, E. G. (2009) · Journal of Clinical Investigation · doi:10.1172/jci36183 · Cited by 2,299 · cited 1×
“homeobox 1 (ZEB1), ZEB2, and/or E47, which can bind to E-cadherin promoter and inhibit its transcription activity and expression [2].”
BackgroundDirect regulation of TWIST by HIF-1α promotes metastasis
Yang, M.-H., Wu, M.-Z., Chiou, S.-H., Chen, P.-M., Chang, S.-Y., Liu, C.-J., Teng, S.-C., & Wu, K.-J. (2008) · Nature Cell Biology · doi:10.1038/ncb1691 · Cited by 1,345
Self-citationHypoxia promotes fibrogenesis in vivo via HIF-1 stimulation of epithelial-to-mesenchymal transition
Higgins, D. F., Kimura, K., Bernhardt, W. M., Shrimanker, N., Akai, Y., Hohenstein, B., Saito, Y., Johnson, R. S., Kretzler, M., Cohen, C. D., et al. (2007) · Journal of Clinical Investigation · doi:10.1172/jci30487 · Cited by 976
Eger, A., Aigner, K., Sonderegger, S., Dampier, B., Oehler, S., Schreiber, M., Berx, G., Cano, A., Beug, H., & Foisner, R. (2005) · Oncogene · doi:10.1038/sj.onc.1208429 · Cited by 808
HIF-1 as a target for drug development
Giaccia, A., Siim, B. G., & Johnson, R. S. (2003) · Nature Reviews Drug Discovery · doi:10.1038/nrd1199 · Cited by 631
The Transcriptional Repressor ZEB1 Promotes Metastasis and Loss of Cell Polarity in Cancer
Spaderna, S., Schmalhofer, O., Wahlbuhl, M., Dimmler, A. W., Bauer, K., Sultan, A., Hlubek, F., Jung, A., Strand, D. J., Eger, A., et al. (2008) · Cancer Research · doi:10.1158/0008-5472.can-07-5682 · Cited by 558
Interaction between β-catenin and HIF-1 promotes cellular adaptation to hypoxia
Kaidi, A., Williams, A. C., & Paraskeva, C. (2007) · Nature Cell Biology · doi:10.1038/ncb1534 · Cited by 529
Krishnamachary, B., Zagzag, D., Nagasawa, H., Rainey, K., Okuyama, H., Baek, J. H., & Semenza, G. L. (2006) · Cancer Research · doi:10.1158/0008-5472.can-05-3719 · Cited by 415
Tsai, C., Chen, Y.-J., Yew, T., Chen, L., Wang, J., Chiu, C., & Hung, S. (2010) · Blood · doi:10.1182/blood-2010-05-287508 · Cited by 389
Self-citation
Cited by
Sorted by citations
Items 201–264 of 264
RBCK1 regulates the progression of ER-positive breast cancer through the HIF1α signaling
Niu, Z., Fan, J., Chen, F., Yang, H., Li, X., Zhuang, T., Guo, C., Cao, Q., Zhu, J., Wang, H., et al. (2022) · Cell Death and Disease · doi:10.1038/s41419-022-05473-6 · Cited by 7
A multi-gene expression profile panel for predicting liver metastasis: An algorithmic approach
Shah, K., Patel, S., Mirza, S., & Rawal, R. (2018) · PLoS ONE · doi:10.1371/journal.pone.0206400 · Cited by 7
Lv, K., Kong, L., Yang, M., Zhang, L., Chu, S., Zhang, L., Yu, J., Zhong, G., Shi, Y., Wang, X., et al. (2022) · Frontiers in Pharmacology · doi:10.3389/fphar.2021.760908 · Cited by 6
Epithelial–mesenchymal transition: an organizing principle of mammalian regeneration
Bedelbaeva, K., Cameron, B., Latella, J., Aslanukov, A., Gourevitch, D., Davuluri, R. V., & Heber‐Katz, E. (2023) · Frontiers in Cell and Developmental Biology · doi:10.3389/fcell.2023.1101480 · Cited by 6
Deciphering Radiotherapy Resistance: A Proteomic Perspective
Perico, D., & Mauri, P. (2025) · Proteomes · doi:10.3390/proteomes13020025 · Cited by 5
Cheng, C., Wang, J., Zhong, Z., Dai, Z., Wang, Q., Dong, W., Shi, H., Liu, Q., & Du, J. (2017) · PubMed Central · doi:10.3785/j.issn.1008-9292.2017.02.06 · Cited by 5
Self-citationCritical Steps in Epithelial-Mesenchymal Transition as Target for Cancer Treatment
Denisov, E. V., Jolly, M. K., Шубин, В. П., Цуканов, А. С., & Чердынцева, Н. В. (2020) · Human perspectives in health sciences and technology · doi:10.1007/978-3-030-32857-3_10 · Cited by 5
CYR61 promotes colorectal carcinoma progression via activating epithelial-mesenchymal transition.
Rasool, S., Ismaeel, Q. A., & Arif, S. H. (2023) · PubMed Central · Cited by 5
Kuo, H.-T., Jheng, J.-H., Lo, M., Chen, W.-L., Wang, S., & Lee, H.-M. (2018) · Free Radical Research · doi:10.1080/10715762.2018.1476691 · Cited by 5
Association of HIF-1α and NDRG2 expression with EMT in gastric cancer tissues
Wang, R., Ou, X.-W., Kang, M., & Zhou, Z. (2019) · Open Life Sciences · doi:10.1515/biol-2019-0025 · Cited by 5
Ascorbate and Tumor Cell Iron Metabolism: The Evolving Story and Its Link to Pathology
Bae, D.-H., Azad, M. G., Kalinowski, D. S., Lane, D. J. R., Jansson, P. J., & Richardson, D. R. (2019) · Antioxidants and Redox Signaling · doi:10.1089/ars.2019.7903 · Cited by 6
Shah, K., & Rawal, R. (2024) · Scientific Reports · doi:10.1038/s41598-024-63252-z · Cited by 4
SPDEF promotes the classical subtype of pancreatic ductal adenocarcinomaPreprint
Tonelli, C., Yordanov, G. N., Yuan, H., Deschênes, A., Klingbeil, O., Ting, H.-C., Brosnan, E., Doshi, A., Park, Y., Vakoc, C. R., et al. (2022) · bioRxiv (Cold Spring Harbor Laboratory) · doi:10.1101/2022.03.18.484951 · Cited by 4
LncRNAs in hypoxic microenvironment; insight in their impact in cancer biology
Kuriakose, B. B., Hjazi, A., Saleh, R. O., Bishoyi, A. K., Jyothi, S. R., Almalki, S. G., Sridevi, G., Chaudhary, K., Zwamel, A. H., & Matchonov, O. (2025) · Functional & Integrative Genomics · doi:10.1007/s10142-025-01635-9 · Cited by 3
Zefferino, R., & Conese, M. (2023) · Vaccines · doi:10.3390/vaccines11111701 · Cited by 3
Kamal, T., Biswas, A. U. H., Bhuiyan, A. R., Hossain, A.-A., Barai, C., Kabir, Y., & Islam, F. (2026) · Current Issues in Molecular Biology · doi:10.3390/cimb48030276 · Cited by 3
Zarin, B., Nedaeinia, R., Laher, I., Manian, M., & Javanmard, S. H. (2023) · Tumor Biology · doi:10.3233/tub-220020 · Cited by 3
Role of Hypoxia-Inducible Factor (HIF) in the Initiation of Cancer and Its Therapeutic Inhibitors
Eda, S. R., Vadde, R., & Jinka, R. (2017) · Springer eBooks · doi:10.1007/978-981-10-6728-0_10 · Cited by 3
Greene, G., Zonfa, I., & Regan, E. R. (2025) · PLoS Computational Biology · doi:10.1371/journal.pcbi.1012735 · Cited by 3
Research progress on NUSAP1 and its role in digestive system neoplasms
Fu, S., Zhuo, Y., & Yu, T. (2025) · Frontiers in Oncology · doi:10.3389/fonc.2025.1582361 · Cited by 2
Prokaryotic organelle mitochondria drive tumorigenesis: “the original sin”
Wang, C., Luo, M., Zhou, J., Zhang, Q., Xiawei, J., He, J., Wang, L., Huang, Y., Xu, X., & 王方岩 (2026) · Frontiers in Oncology · doi:10.3389/fonc.2025.1632702 · Cited by 3
Lo, M., Chen, M., Hsueh, Y.-T., Kuo, H.-T., & Lee, H.-M. (2018) · Free Radical Research · doi:10.1080/10715762.2018.1489129 · Cited by 2
Ma, J., Yu, Y., Tao, D.-T., Yin, J., Chen, L., Cui, Y., Wang, Y., Hu, C.-L., Tian, M., & Wang, Q. (2022) · Contrast Media & Molecular Imaging · doi:10.1155/2022/4486104 · Cited by 2
RetractedThe correlation of p22phox and chemosensitivity in EGFR-TKI resistant lung adenocarcinoma
Kobayashi, M., Saito, R., Miki, Y., Nanamiya, R., Inoue, C., Abe, J., Sato, I., Okada, Y., & Sasano, H. (2019) · Oncotarget · doi:10.18632/oncotarget.26637 · Cited by 2
Nakamichi, K., Yamamoto, Y., Semba, K., & Nakayama, J. (2023) · Genes to Cells · doi:10.1111/gtc.13092 · Cited by 2
The Role of Periodontal Bacteria and Epigenetic Modifications on Human Papillomavirus Pathogenicity
Glasspoole, C. (2020) · Carolina Digital Repository (University of North Carolina at Chapel Hill) · doi:10.17615/946n-bx30 · Cited by 2
Ye, Y., Srisai, D., & Barsky, S. H. (2025) · Biomedicines · doi:10.3390/biomedicines13122890 · Cited by 1
Ai, X., Li, A., Feng, R., Xu, H., Yue, H., Wang, Z., & Dai, Y. (2026) · Frontiers in Medicine · doi:10.3389/fmed.2025.1703982 · Cited by 1
Luqmani, Y. A. (2026) · Medical Principles and Practice · doi:10.1159/000552146 · Cited by 1
The Lymphatic System in Colorectal Cancer
Ceelen, W. (2022) · Elsevier eBooks · doi:10.1016/c2020-0-01507-0 · Cited by 1
Zhao, X., He, X., Chen, C., Pei, Y., & Wang, Y. (2023) · Materials Express · doi:10.1166/mex.2023.2411 · Cited by 1
Epithelial–mesenchymal transition in an EcPV2 ‐positive vulvar squamous cell carcinoma of a mare
Paolis, L. D., Armando, F., Montemurro, V., Petrizzi, L., Straticò, P., Mecocci, S., Guarnieri, C., Pezzolato, M., Fruscione, F., Passeri, B., et al. (2023) · Equine Veterinary Journal · doi:10.1111/evj.13965 · Cited by 1
Wu, X. (2016) · IUScholarWorks (Indiana University) · doi:10.7912/c2s89r · Cited by 1
Zhao, S., Zhou, L., Dicker, D. T., Lev, A., Zhang, S., & El‐Deiry, W. S. (2020) · bioRxiv (Cold Spring Harbor Laboratory) · doi:10.1101/2020.10.20.347633 · Cited by 1
Ren, Z., Dharmaratne, M., Liang, H., Benard, O., Morales-Gallego, M., Suyama, K., Fard, A. T., Mar, J. C., Prystowsky, M. B., Norton, L., et al. (2022) · bioRxiv (Cold Spring Harbor Laboratory) · doi:10.1101/2022.08.29.503508 · Cited by 1
Microbial and epigenetic factors in the pathogenesis of nasopharyngeal carcinoma
Zhou, X. (2015) · Figshare
Harb, O. A., Elhasadi, I., Adim, A. M. A., Said, W., Ammari, S., Shafaay, B., Habib, F., & Gertallah, L. (2018) · International Journal of Advanced Research · doi:10.21474/ijar01/6516
Hypoxia-inducible factor-1α expression in colorectal carcinoma
El-Aziz, A. M. A., ElHamid, H. S. A., Mostafa, R. R., & Shalaby, Y. R. (2018) · Egyptian Journal of Pathology · doi:10.1097/01.xej.0000534712.68027.d8
Lee, L. Y. W., Woolley, C. E., Starkey, T., Freeman-Mills, L., Bassett, A. R., Franchini, F., Wang, L. M., Lewis, A., Arnold, R. R., & Tomlinson, I. P. M. (2019) · bioRxiv (Cold Spring Harbor Laboratory) · doi:10.1101/613356
Characterising the role of Zeb1 in the adult haematopoietic system
Almotiri, A. (2019) · ORCA Online Research @Cardiff (Cardiff University)
Hypoxia-Regulated Gene Expression and Metastasis
Karlıtepe, A., Pi̇levneli̇, H., & Eren, M. K. (2023) · Springer eBooks · doi:10.1007/978-981-99-0313-9_6
Kurebayashi, J., Iwamoto, T., Koike, Y., Mikami, T., Sanuki, F., Moriya, T., Yamamoto, Y., & Taira, N. (2023) · Preprints.org · doi:10.20944/preprints202310.0190.v1
Shah, K., & Rawal, R. (2023) · bioRxiv (Cold Spring Harbor Laboratory) · doi:10.1101/2023.12.12.571044
Wu, Q., Zhou, X., Li, P., Ding, M., You, S., Xu, Z., Ye, J., Chen, X., Tan, M., Wang, J., et al. (2021) · Figshare · doi:10.6084/m9.figshare.14558953
Self-citationCancer Stem Cells in Gastrointestinal Cancers
Li, M., Li, J., He, D., & Liu, M. (2024) · Stem cell biology and regenerative medicine · doi:10.1007/978-3-031-74842-4_12
Hypoxia-inducible factor-1α at the invasive tumor front in oral squamous cell carcinoma
Silveira, F. M., Schuch, L. F., Pereira‐Prado, V., Molina‐Frechero, N., López‐Verdín, S., Palacio‐Gastélum, M. G., Arocena, M., Niklander, S. E., Sicco, E., & Bologna‐Molina, R. E. (2025) · World Journal of Experimental Medicine · doi:10.5493/wjem.v15.i2.102175
Hosny, N., Li, S., Amend, S. R., Gatenby, R. A., Pienta, K. J., Brown, J. S., Qu, J., & Austin, R. H. (2025) · bioRxiv (Cold Spring Harbor Laboratory) · doi:10.1101/2025.09.03.673887
Oncostatin M orchestrates collective epithelial migration via HIF1A activation
McLean, I. C., Gross, S. M., Liby, T. A., Dane, M. A., Derrick, D. S., & Heiser, L. M. (2026) · npj Systems Biology and Applications · doi:10.1038/s41540-026-00778-0
Huang, A., Sun, Z., Hong, H., Yang, Y., Chen, J., Gao, Z., & Gu, J. (2024) · Figshare · doi:10.6084/m9.figshare.26737023
Huang, A., Sun, Z., Hong, H., Yang, Y., Chen, J., Gao, Z., & Gu, J. (2024) · Figshare · doi:10.6084/m9.figshare.26737026
Feng, S., Ding, B., Dai, Z., Yin, H., Ding, Y., Liu, S., Zhang, K., Lin, H., Zhongdang, X. I. A. O., & Shen, Y. (2024) · Figshare · doi:10.6084/m9.figshare.26693826
Self-citationSpatial heterogeneity of malignant molecular markers in glioma revealed by stereotactic biopsy
Qiu, C., Wei, K., Wang, C., Wang, C., Ming, Y., Peng, L., He, H., & Zeng, S. (2026) · Discover Oncology · doi:10.1007/s12672-026-04720-y
Lymphocytes T mémoires et conséquences sur la réponse inflammatoire épidermique et la pigmentation
Martins, C. (2020) · theses.fr (ABES) · doi:10.70675/dbfdf5d8z2beez442dzb1a1z99b4860df70a
Le rôle de deux alarmines extracellulaires, HMGB1 et l’ATP, dans le cadre du cancer colorectal
Dillard, C. (2021) · theses.fr (ABES) · doi:10.70675/51029938z640az4398za0f8z6a69fb660b30
Ehm, P. A. H., & Rehbach, C. (2026) · Hemato · doi:10.3390/hemato7020014
Samejima, H., Kojima, K., Shimizu, S., Tokunaga, T., Okishio, K., & Yoon, H. (2026) · Cancer Imaging · doi:10.1186/s40644-026-01054-4
Shi, J. H., Yi, M., Xie, S., Wang, Z., Zhang, X., Zhang, Y., Tang, R., Yang, Y., & Liu, Y. (2026) · Advanced Science · doi:10.1002/advs.202520273 · Cited by 1
白日兰, Li, Y., Zhou, L., Yu, Y. X., Wen, X., Li, H., Zhao, Y., Hoffman, A. R., Li, W., Hu, J., et al. (2026) · Biomarker Research · doi:10.1186/s40364-026-00946-8
Perumal, S., Abdulla, N., Aronson, R., & Kaur, M. (2026) · Cancer Medicine · doi:10.1002/cam4.72070
Domka, W., Misiołek, M., Myśliwiec, A., Kubrak, T. P., Przygórzewska, A., Bartusik‐Aebisher, D., & Aebisher, D. (2026) · Biomedicines · doi:10.3390/biomedicines14071611
Mechanisms Underlying the Coordination of EMT and Glycolysis Mediated by Hypoxia and Glucose
Lu, W., Wang, H., Zhang, X., & Wang, W. (2026) · Current Issues in Molecular Biology · doi:10.3390/cimb48090907
Metadata
- Authors
- Zhang, W., Shi, X., Peng, Y., Wu, M., Zhang, P., Xie, R., Wu, Y., Yan, Q., Liu, S., & Wang, J.
- Affiliations
- Kunming University of Science and Technology (CN)
- Nanfang Hospital (CN)
- Corresponding author
- Liu, Side
- Wang, Jide
- Venue
- PLOS ONE
- Publisher
- Public Library of Science (PLoS)
- Published
- 2015-06-09
- Volume
- 10
- Issue
- 6
- Pages
- e0129603
- ISSN
- 1932-6203 (ISSN-L)
- PMC
- PMC4461314
- OpenAlex
- W621464006
- Cited by
- 261
- References
- 33
- Citations by year
- 2026: 13 · 2025: 11 · 2024: 14 · 2023: 25 · 2022: 28 · 2021: 28 · 2020: 35 · 2019: 24 · 2018: 34 · 2017: 26 · 2016: 18 · 2015: 5
- FWCI
- 9.14
- Type
- journal article
- Language
- en
- Open access
- gold
- doi.org
- Licence
- Locations
- PLoS ONE (publishedVersion, cc-by)
- Europe PMC (PubMed Central) (publishedVersion, cc-by)
- PubMed Central (publishedVersion, cc-by)
- PubMed (publishedVersion)
- DOAJ (DOAJ: Directory of Open Access Journals) (submittedVersion, cc-by-sa)
- Funders
- National Natural Science Foundation of China
- Southern Medical University
- Nanfang Hospital (G201227)
- Topics
- Life Sciences › Biochemistry, Genetics and Molecular Biology › Cancer Research › Cancer, Hypoxia, and Metabolism
- Health Sciences › Medicine › Oncology › Cancer Cells and Metastasis
- Life Sciences › Biochemistry, Genetics and Molecular Biology › Molecular Biology › Mechanisms of cancer metastasis
- Keywords
- HIF-1α, ZEB1, epithelial-mesenchymal transition, colorectal cancer, metastasis, hypoxia response element, transcriptional regulation, cell invasion, cell migration, vimentin, E-cadherin, deferoxamine, tumor suppressor
- MeSH terms
- Zinc Finger E-box-Binding Homeobox 1, Animals, Base Sequence, Humans, Liver Neoplasms, Mice, Nude, Molecular Sequence Data, Transcription Factors, Vimentin, Colorectal Neoplasms, Cadherins, Gene Expression Regulation, Neoplastic, Homeodomain Proteins, HT29 Cells, Response Elements, HCT116 Cells, Hypoxia-Inducible Factor 1, alpha Subunit, Epithelial-Mesenchymal Transition
About these checks
Registry, retraction, Cites and statistics results are computed, not judged, with one exception: a printed reference that no index lists is read once by a model before it counts as a citation error. Claims are extracted by a model and kept only when their quote appears verbatim in the text; each cited source is then checked, with a model’s help, for whether it says what the claim relies on. Those verdicts can be wrong — read the claim’s quote and the cited source before relying on one.
Statistics and arithmetic are recomputed, not judged.
Confidence bands are shown only for fields calibrated on our annotated test set. None is calibrated yet, so no band is shown.
What counts as a claim ›How we measure confidence ›How we check this ›
Are you an author, or do you see a problem with this page? Request a review
