

The DOI matches its Crossref record; 62 of the 63 references it cites were found in a registry or an index.
Nisin ZP, a Bacteriocin and Food Preservative, Inhibits Head and Neck Cancer Tumorigenesis and Prolongs Survival
Open accessAbstract
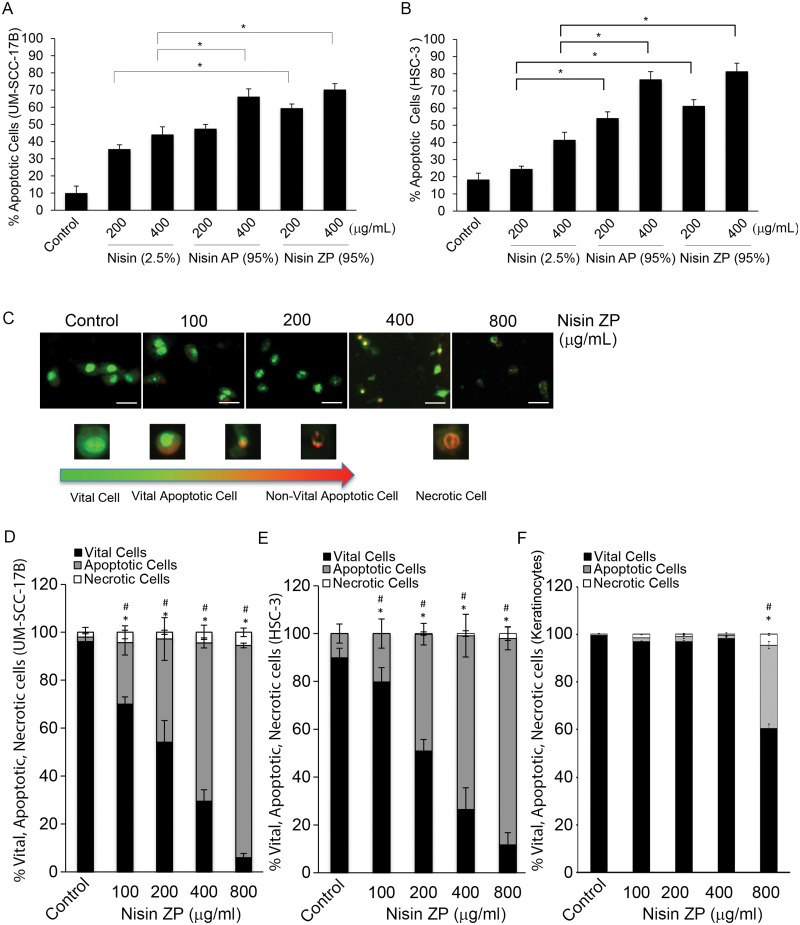
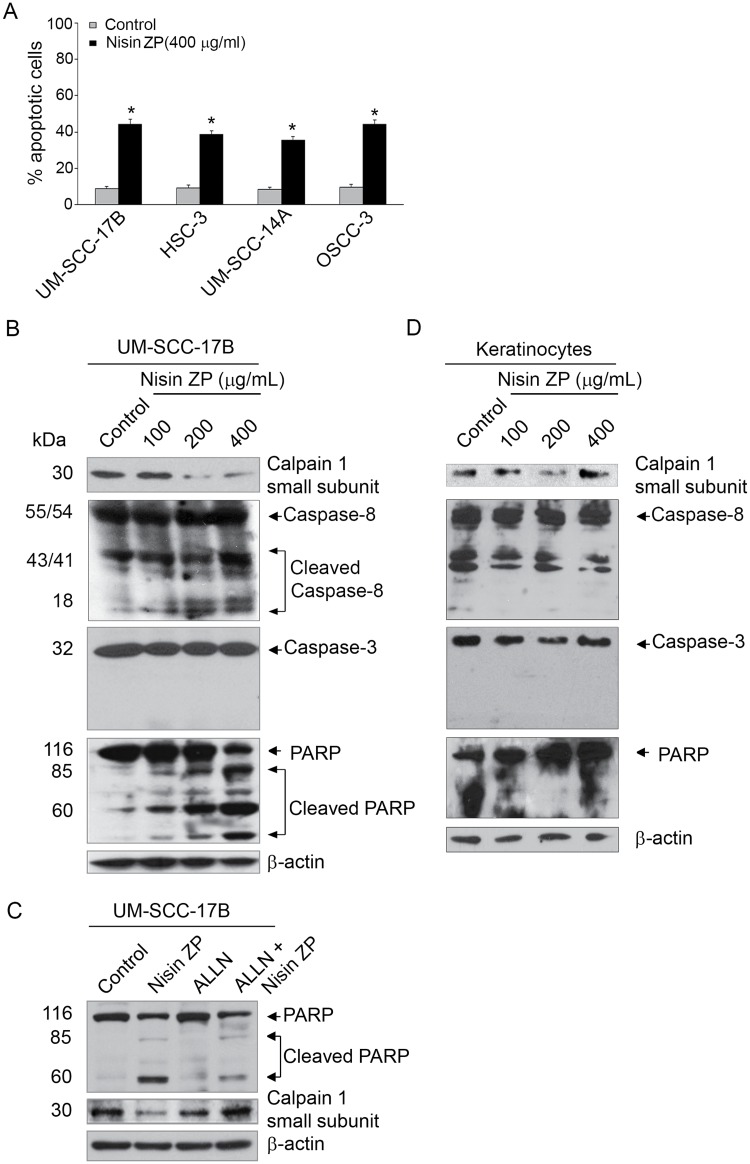
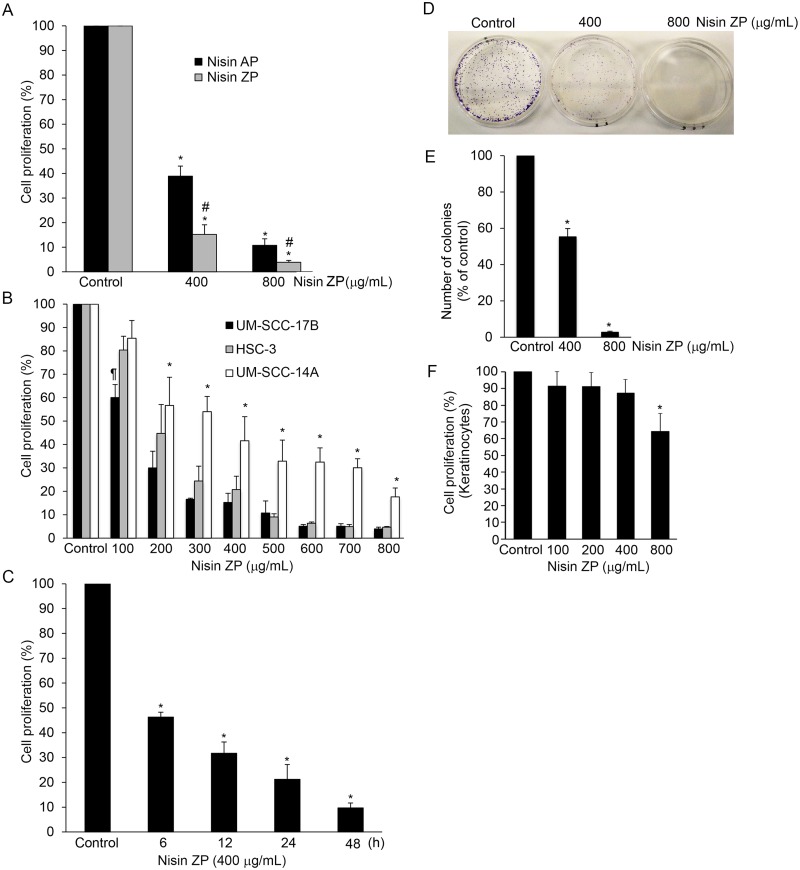
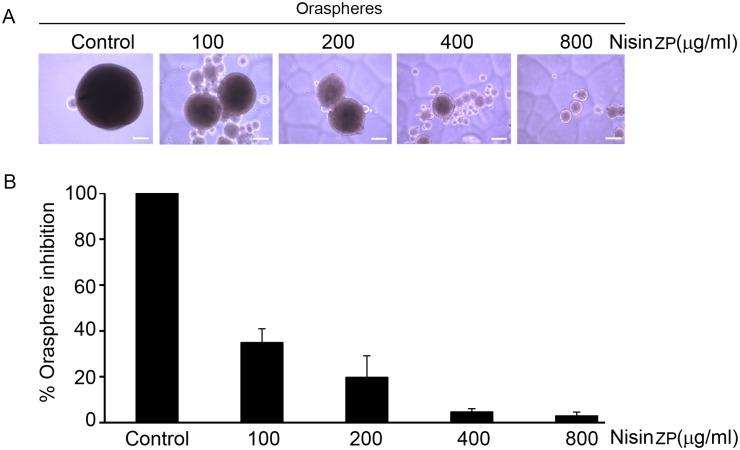
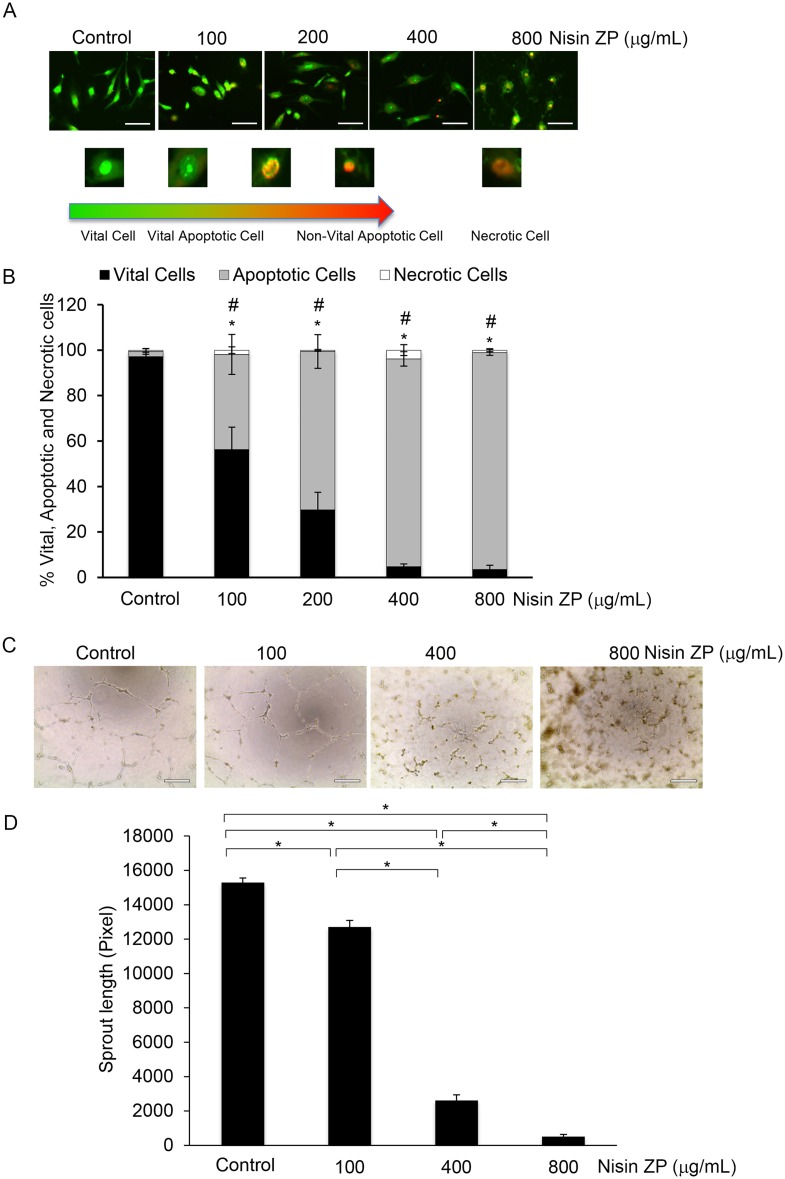
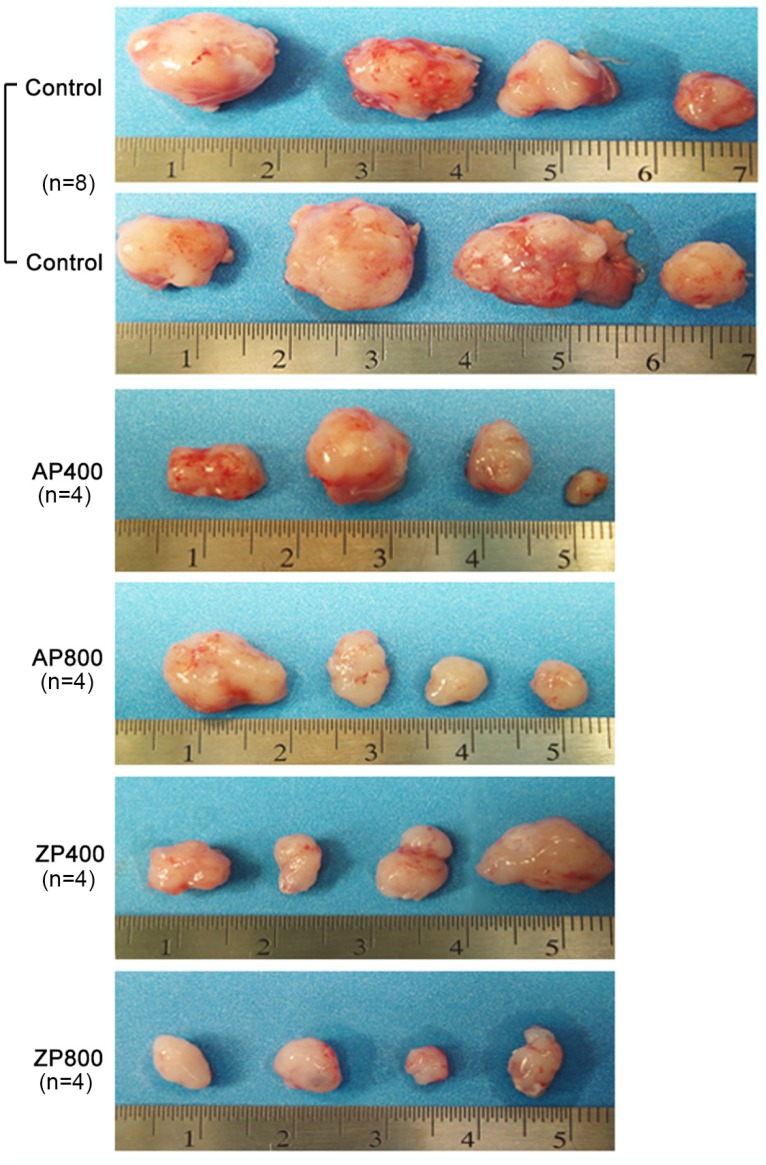
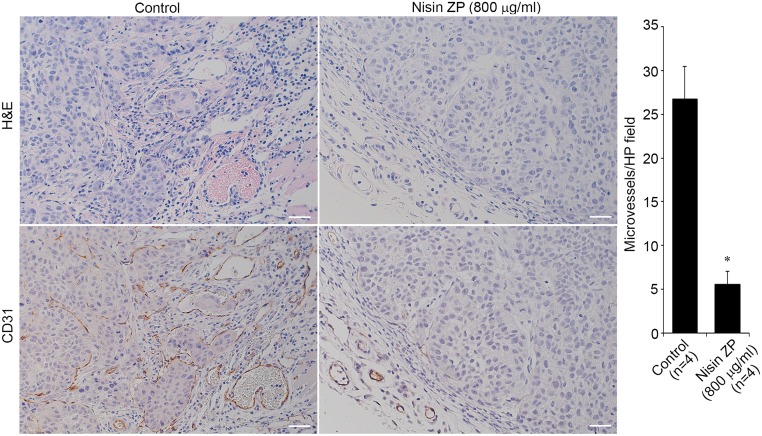
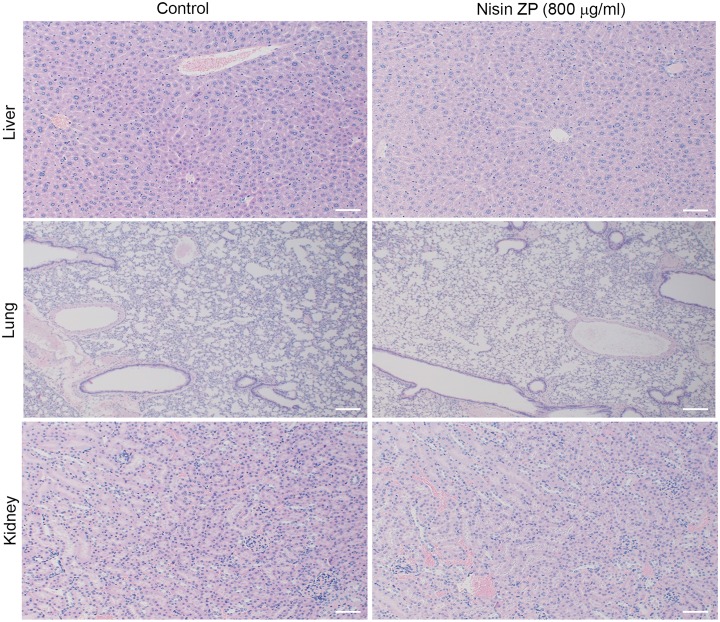
The use of small antimicrobial peptides or bacteriocins, like nisin, to treat cancer is a new approach that holds great promise. Nisin exemplifies this new approach because it has been used safely in humans for many years as a food preservative, and recent laboratory studies support its anti-tumor potential in head and neck cancer. Previously, we showed that nisin (2.5%, low content) has antitumor potential in head and neck squamous cell carcinoma (HNSCC) in vitro and in vivo. The current studies explored a naturally occurring variant of nisin (nisin ZP; 95%, high content) for its antitumor effects in vitro and in vivo. Nisin ZP induced the greatest level of apoptosis in HNSCC cells compared to low content nisin. HNSCC cells treated with increasing concentrations of nisin ZP exhibited increasing levels of apoptosis and decreasing levels of cell proliferation, clonogenic capacity, and sphere formation. Nisin ZP induced apoptosis through a calpain-dependent pathway in HNSCC cells but not in human oral keratinocytes. Nisin ZP also induced apoptosis dose-dependently in human umbilical vein endothelial cells (HUVEC) with concomitant decreases in vascular sprout formation in vitro and reduced intratumoral microvessel density in vivo. Nisin ZP reduced tumorigenesis in vivo and long-term treatment with nisin ZP extended survival. In addition, nisin treated mice exhibited normal organ histology with no evidence of inflammation, fibrosis or necrosis. In summary, nisin ZP exhibits greater antitumor effects than low content nisin, and thus has the potential to serve as a novel therapeutic for HNSCC.
Overview
The claims and statistics of this paper haven’t been checked yet.
Run the check — free, no account needed. It reads the open-access text and checks the sources it cites.
Integrity signals
Registry
Cites
Statistics
Figures
Verification
Claims the paper makes
The claims and statistics of this paper haven’t been checked yet.
Run the check — free, no account needed. It reads the open-access text and checks the sources it cites.
Claims other papers make about this one
Each is checked against this paper’s own text: does it say what the citing paper says it does?
In the citing paper
“Lactococcus lactis, a commensal of the oral microbiota, produces nisin, a bacteriocin that has been shown to reduce oral tumorigenesis and extend the life span of mice with tumors.165, 166”
From The oral microbiome: Role of key organisms and complex networks in oral health and disease (2021) · cites this paper as [166]
Self-check
Percentages, sums and reported differences re-computed from the paper’s own numbers.
The self-check needs the paper’s full text.
Citations
Cites
Siegel, R., Naishadham, D., & Jemal, A. (2012) · CA: A Cancer Journal for Clinicians · doi:10.3322/caac.20138 · Cited by 10,679
Bacteriocins: safe, natural antimicrobials for food preservation.
Cleveland, J., Montville, T. J., Nes, I. F., & Chikindas, M. L. (2001) · International Journal of Food Microbiology · doi:10.1016/s0168-1605(01)00560-8 · Cited by 1,835
Studies on anticancer activities of antimicrobial peptides
Hoskin, D. W., & Ramamoorthy, A. (2007) · Biochimica et Biophysica Acta (BBA) - Biomembranes · doi:10.1016/j.bbamem.2007.11.008 · Cited by 1,297
Self-citationA simple technique for quantifying apoptosis in 96-well plates
Ribble, D., Goldstein, N. B., Norris, D. A., & Shellman, Y. G. (2005) · BMC Biotechnology · doi:10.1186/1472-6750-5-12 · Cited by 854
Wiedemann, I., Breukink, E. J., van Kraaij, C., Kuipers, O. P., Bierbaum, G., KRUIJFF, B. D., & Sahl, H. (2001) · Journal of Biological Chemistry · doi:10.1074/jbc.m006770200 · Cited by 793
Identification and characterization of the lantibiotic nisin Z, a natural nisin variant
Mulders, J. W. M., Boerrigter, I. J., Rollema, H. S., Siezen, R. J., & de Vos, W. M. (1991) · European Journal of Biochemistry · doi:10.1111/j.1432-1033.1991.tb16317.x · Cited by 429
Mungrue, I. N., Pagnon, J. C., Omid Kohannim, A., Gargalovic, P. S., & Lusis, A. J. (2009) · The Journal of Immunology · doi:10.4049/jimmunol.182.1.466 · Cited by 332
Ihle, N. T., Williams, R. R., Chow, S., Chew, W. M., Berggren, M. I., Paine-Murrieta, G. D., Minion, D. J., Halter, R. J., Wipf, P., Abraham, R. T., et al. (2004) · Molecular Cancer Therapeutics · doi:10.1158/1535-7163.763.3.7 · Cited by 317
Koczulla, A. R., & Bals, R. (2003) · Drugs · doi:10.2165/00003495-200363040-00005 · Cited by 309
Genotyping of 73 UM‐SCC head and neck squamous cell carcinoma cell lines
Brenner, J. C., Graham, M. P., Kumar, B., Saunders, L. M., Kupfer, R., Lyons, R. H., Bradford, C. R., & Carey, T. E. (2010) · Head & Neck · doi:10.1002/hed.21198 · Cited by 304
Nisin, an apoptogenic bacteriocin and food preservative, attenuates HNSCC tumorigenesis via CHAC 1
Joo, N. E., Ritchie, K., Kamarajan, P., Miao, D., & Kapila, Y. L. (2012) · Cancer Medicine · doi:10.1002/cam4.35 · Cited by 279
Self-citationStructure, function, and differentiation of the keratinocyte
Eckert, R. L. (1989) · Physiological Reviews · doi:10.1152/physrev.1989.69.4.1316 · Cited by 242
E-cadherin Regulates Anchorage-independent Growth and Survival in Oral Squamous Cell Carcinoma Cells
Kantak, S. S., & Kramer, R. H. (1998) · Journal of Biological Chemistry · doi:10.1074/jbc.273.27.16953 · Cited by 229
Pozo‐Guisado, E., Merino, J. M., Mulero‐Navarro, S., Lorenzo‐Benayas, M. J., Centeno, F., Alvarez, A. M., & Fernández‐Salguero, P. M. (2005) · International Journal of Cancer · doi:10.1002/ijc.20856 · Cited by 223
Zhang, Y., & Bhavnani, B. R. (2006) · BMC Neuroscience · doi:10.1186/1471-2202-7-49 · Cited by 212
Sirtuin-3 (SIRT3), a novel potential therapeutic target for oral cancer
Alhazzazi, T. Y., Kamarajan, P., Joo, N., Huang, J., Verdin, E., D'Silva, N. J., & Kapila, Y. L. (2011) · Cancer · doi:10.1002/cncr.25676 · Cited by 208
Self-citationAIF‐mediated caspase‐independent necroptosis: A new chance for targeted therapeutics
Delavallée, L., Cabon, L., Galán‐Malo, P., Lorenzo, H. K., & Susín, S. A. (2011) · IUBMB Life · doi:10.1002/iub.432 · Cited by 189
Efficacy of Nisin in Treatment of Clinical Mastitis in Lactating Dairy Cows
Cao, L., Wu, J.-Q., Xie, F., Hu, S., & Mo, Y. (2007) · Journal of Dairy Science · doi:10.3168/jds.2007-0153 · Cited by 168
Evaluating the supportive care costs of severe radiochemotherapy‐induced mucositis and pharyngitis
Nonzee, N. J., Dandade, N., Markossian, T. W., Agulnik, M., Argiris, A. E., Patel, J. D., Kern, R. C., Munshi, H. G., Calhoun, E. A., & Bennett, C. L. (2008) · Cancer · doi:10.1002/cncr.23714 · Cited by 159
Tube Formation: an In Vitro Matrigel Angiogenesis Assay
Ponce, M. L. (2008) · Methods in molecular biology · doi:10.1007/978-1-59745-241-0_10 · Cited by 154
Brötz, H. (2000) · Journal of Antimicrobial Chemotherapy · doi:10.1093/jac/46.1.1 · Cited by 147
Therapeutic Effect of Nisin Z on Subclinical Mastitis in Lactating Cows
Wu, J.-Q., Hu, S., & Cao, L. (2007) · Antimicrobial Agents and Chemotherapy · doi:10.1128/aac.00629-07 · Cited by 139
Fernández, L., Delgado, S., Herrero, H., Maldonado‐Barragán, A., & Rodríguez, J. M. (2008) · Journal of Human Lactation · doi:10.1177/0890334408317435 · Cited by 124
Qiao, C. U. I., Yu, J., Wu, J.-N., Tashiro, S., Onodera, S., Minami, M., & Ikejima, T. (2007) · Acta Pharmacologica Sinica · doi:10.1111/j.1745-7254.2007.00588.x · Cited by 122
Squamous Cell Carcinoma Cell Aggregates Escape Suspension-induced, p53-mediated Anoikis
Zhang, Y., Lü, H., Dazin, P. F., & Kapila, Y. L. (2004) · Journal of Biological Chemistry · doi:10.1074/jbc.m407953200 · Cited by 117
Self-citationAntibacterial and Antitumorigenic Properties of Microcin E492, a Pore- Forming Bacteriocin
Lagos, R., Tello, M., Mercado, G., Garcia, V., & Monasterio, O. (2009) · Current Pharmaceutical Biotechnology · doi:10.2174/138920109787048643 · Cited by 104
Role of transmembrane pH gradient and membrane binding in nisin pore formation
Moll, G. N., Clark, J., Chan, W. C., Bycroft, B. W., Roberts, G. C. K., Konings, W. N., & Driessen, A. J. M. (1997) · Journal of Bacteriology · doi:10.1128/jb.179.1.135-140.1997 · Cited by 99
The bacterial colicin active against tumor cells in vitro and in vivo is verotoxin 1.
Farkas-Himsley, H., Hill, R. P., Rosen, B. P., Arab, S., & Lingwood, C. A. (1995) · Proceedings of the National Academy of Sciences · doi:10.1073/pnas.92.15.6996 · Cited by 94
Tripathi, P., Kamarajan, P., Somashekar, B. S., MacKinnon, N., Chinnaiyan, A. M., Kapila, Y. L., Rajendiran, T. M., & Ramamoorthy, A. (2012) · The International Journal of Biochemistry & Cell Biology · doi:10.1016/j.biocel.2012.06.025 · Cited by 93
Self-citationHuman CD59 Inhibitor Sensitizes Rituximab-Resistant Lymphoma Cells to Complement-Mediated Cytolysis
Hu, W., Ge, X., You, T., Xu, T., Zhang, J., Wu, G., Peng, Z., Chorev, M., Aktas, B. H., Halperin, J. A., et al. (2011) · Cancer Research · doi:10.1158/0008-5472.can-10-3016 · Cited by 91
A study of an in vitro model for invasion of oral squamous cell carcinoma
Matsumoto, K., Horikoshi, M., Rikimaru, K., & Enomoto, S. (1989) · Journal of Oral Pathology and Medicine · doi:10.1111/j.1600-0714.1989.tb01350.x · Cited by 86
Squamous Cell Carcinoma of the Oral Tissues: A Comprehensive Review for Oral Healthcare Providers
Bsoul, S. A., Terézhalmy, G. T., & Huber, M. A. (2005) · The Journal of Contemporary Dental Practice · doi:10.5005/jcdp-6-4-1 · Cited by 86
Bao, J., Le, X., Wang, R., Yuan, J., Wang, L., Atkinson, E. N., LaPushin, R., Andreeff, M., Fang, B., Yu, Y., et al. (2002) · PubMed · Cited by 76
Qiao, Q., Cui, C., Jinghua, Yu, F., Jinnan, Wu, Shinichi, S., TASHIRO, T., Satoshi, S., Onodera, et al. (2007) · 中国药理学报:英文版 · Cited by 72
The biological effects of food additives. I.—Nisin
Frazer, A. C., Sharratt, M., & Hickman, J. R. (1962) · Journal of the Science of Food and Agriculture · doi:10.1002/jsfa.2740130106 · Cited by 64
Kaur, G., Singh, T. P., & Malik, R. K. (2013) · Brazilian Journal of Microbiology · doi:10.1590/s1517-83822013005000025 · Cited by 64
Yoo, J., Lim, Y., Kim, Y., & Ha, K. (2012) · Journal of Biological Chemistry · doi:10.1074/jbc.m111.326074 · Cited by 54
Artus, C., Maquarre, E., Moubarak, R. S., Delettre, C., Jasmin, C., Susín, S. A., & Robert-Lézénès, J. (2006) · Oncogene · doi:10.1038/sj.onc.1209581 · Cited by 50
Antineoplastic Properties of Bacteriocins
Cornut, G., Fortin, C., & Soulières, D. (2008) · American Journal of Clinical Oncology · doi:10.1097/coc.0b013e31815e456d · Cited by 45
Selimović, D., Ahmad, M., El‐Khattouti, A., Hannig, M., Haïkel, Y., & Hassan, M. (2011) · Carcinogenesis · doi:10.1093/carcin/bgr112 · Cited by 45
Lu, J.-R., Lu, W.-W., Lai, J.-Z., Tsai, F.-L., Wu, S., Lin, C., & Kung, S. (2013) · Journal of General Virology · doi:10.1099/vir.0.047753-0 · Cited by 43
You, T., Hu, W., Ge, X., Shen, J., & Qin, X. (2011) · Cellular and Molecular Immunology · doi:10.1038/cmi.2010.35 · Cited by 43
Giffard, C. J., Ladha, S., Mackie, A. R., Clark, D. C., & Sanders, D. (1996) · The Journal of Membrane Biology · doi:10.1007/s002329900079 · Cited by 40
Jeong, J., Shin, W. Y., Kim, T. H., Kwon, C., Kim, J. H., Kim, Y. K., & Kim, K. (2011) · Journal of experimental & clinical cancer research : CR · doi:10.1186/1756-9966-30-44 · Cited by 40
Ponec, M., Havekes, L. M., Kempenaar, J. A., Lavrijsen, S., & Vermeer, B. J. (1984) · Journal of Investigative Dermatology · doi:10.1111/1523-1747.ep12273538 · Cited by 39
Kamarajan, P., Alhazzazi, T. Y., Danciu, T., D’Silva, N. J., Verdin, E. M., & Kapila, Y. L. (2012) · Cancer · doi:10.1002/cncr.27655 · Cited by 38
Self-citationSand, S. L., Haug, T. M., Nissen-Meyer, J., & Sand, O. (2007) · The Journal of Membrane Biology · doi:10.1007/s00232-007-9030-3 · Cited by 36
Regulation of lipid synthesis in relation to keratinocyte differentiation capacity
Ponec, M., Kempenaar, J. A., & Boonstra, J. (1987) · Biochimica et Biophysica Acta (BBA) - Lipids and Lipid Metabolism · doi:10.1016/0005-2760(87)90079-8 · Cited by 35
ADAM 17‐mediated CD 44 cleavage promotes orasphere formation or stemness and tumorigenesis in HNSCC
Kamarajan, P., Shin, J. M., Qian, X., Matte, B. F., Zhu, J. Y., & Kapila, Y. L. (2013) · Cancer Medicine · doi:10.1002/cam4.147 · Cited by 32
Self-citationBai, X., Kinney, W. H., Su, W., Bai, A., Ovrutsky, A. R., Honda, J. R., Netea, M. G., Henao-Tamayo, M. I., Ordway, D. J., Dinarello, C. A., et al. (2015) · BMC Microbiology · doi:10.1186/s12866-015-0366-z · Cited by 30
Gasparoni, A., Fonzi, L., Schneider, G. B., Wertz, P. W., Johnson, G. K., & Squier, C. A. (2004) · Archives of Oral Biology · doi:10.1016/j.archoralbio.2004.02.010 · Cited by 27
Duramycin exhibits antiproliferative properties and induces apoptosis in tumour cells
Yates, K. R., Welsh, J., Udegbunam, N. O., Greenman, J., Maraveyas, A., & Madden, L. A. (2012) · Blood Coagulation & Fibrinolysis · doi:10.1097/mbc.0b013e3283538875 · Cited by 25
Kang, H., Han, B.-S., Kim, S., & Oh, Y. J. (2012) · APOPTOSIS · doi:10.1007/s10495-012-0699-0 · Cited by 22
Saito, H., & Watanabe, T. (1979) · PubMed · Cited by 21
Shaikh, F., Abhinand, P. A., & Ragunath, P. (2012) · Bioinformation · doi:10.6026/97320630008589 · Cited by 20
The antiproliferative cytostatic effects of a self-activating viridin prodrug
Smith, A. E., Blois, J. T., Yuan, H., Aikawa, E. R., Ellson, C. D., Figueiredo, J., Weissleder, R., Köhler, R. H., Yaffe, M. B., Cantley, L. C., et al. (2009) · Molecular Cancer Therapeutics · doi:10.1158/1535-7163.mct-08-1012 · Cited by 18
Karmakar, S., Choudhury, S. R., Banik, N. L., & Ray, S. K. (2010) · Journal of Cancer Science & Therapy · doi:10.4172/1948-5956.1000033 · Cited by 16
Lateral mobility of plasma membrane lipids in normal and transformed keratinocytes
Tertoolen, L. G. J., Kempenaar, J. A., Boonstra, J., de Laat, S. W., & Ponec, M. (1988) · Biochemical and Biophysical Research Communications · doi:10.1016/s0006-291x(88)80064-0 · Cited by 14
Partially purified bacteriocin kills malignant cells by apoptosis: programmed cell death.
Farkas-Himsley, H., Zhang, Y., Yuan, M., & Musclow, C. E. (1992) · PubMed · Cited by 10
Diwakarla, S., Mercer, L. D., Lee-Kardashyan, L., Chu, P. W. Y., Shin, Y. S., Lau, C. L., Hughes, M. L. R., Nagley, P., & Beart, P. M. (2009) · Journal of Neurochemistry · doi:10.1111/j.1471-4159.2009.05937.x · Cited by 10
Delves‐Broughton, J., & Thomas, L. (2005) · Food science and technology · doi:10.1201/9781420028737.ch7 · Cited by 8
Anti-tumor activity of de novo designed small globular protein (SGP) in vivo.
Tsugu, H., Onishi, H., Fukushima, T., & Lee, S. (2006) · PubMed · Cited by 4
Cited by
Sorted by citations
The oral microbiome: Role of key organisms and complex networks in oral health and disease
Sedghi, L., DiMassa, V., Harrington, A., Lynch, S. V., & Kapila, Y. L. (2021) · Periodontology 2000 · doi:10.1111/prd.12393 · Cited by 755
Self-citationBiomedical applications of nisin
Shin, J. M., Gwak, J. W., Kamarajan, P., Fenno, J. C., Rickard, A. H., & Kapila, Y. L. (2016) · Journal of Applied Microbiology · doi:10.1111/jam.13033 · Cited by 607
Self-citationBacteriocins as a new generation of antimicrobials: toxicity aspects and regulations
Soltani, S., Hammami, R., Cotter, P. D., Rebuffat, S., Said, L. B., Gaudreau, H., Bédard, F., Biron, É., Drider, D., & Fliss, I. (2020) · FEMS Microbiology Reviews · doi:10.1093/femsre/fuaa039 · Cited by 585
Kumariya, R., Garsa, A. K., Rajput, Y. S., Sood, S. K., Akhtar, N., & Patel, S. (2019) · Microbial Pathogenesis · doi:10.1016/j.micpath.2019.01.002 · Cited by 455
Bacteriocins as Potential Anticancer Agents
Kaur, S., & Kaur, S. (2015) · Frontiers in Pharmacology · doi:10.3389/fphar.2015.00272 · Cited by 288
Metadata
- Authors
- Kamarajan, P., Hayami, T., Matte, B., Liu, Y., Danciu, T., Ramamoorthy, A., Worden, F., Kapila, S., & Kapila, Y.
- Affiliations
- University of Michigan (US)
- Corresponding author
- Kapila, Yvonne
- ORCID
- Venue
- PLOS ONE
- Publisher
- Public Library of Science (PLoS)
- Published
- 2015-07-01
- Volume
- 10
- Issue
- 7
- Pages
- e0131008
- ISSN
- 1932-6203 (ISSN-L)
- PMC
- PMC4489501
- OpenAlex
- W1871229721
- Cited by
- 214
- References
- 63
- Citations by year
- 2026: 12 · 2025: 22 · 2024: 26 · 2023: 27 · 2022: 31 · 2021: 33 · 2020: 24 · 2019: 9 · 2018: 9 · 2017: 13 · 2016: 5 · 2015: 3
- FWCI
- 8.42
- Type
- journal article
- Language
- en
- Open access
- gold
- doi.org
- Licence
- Locations
- PLoS ONE (publishedVersion, cc-by)
- Europe PMC (PubMed Central) (publishedVersion, cc-by)
- PubMed Central (publishedVersion, cc-by)
- PubMed (publishedVersion)
- eScholarship (California Digital Library) (submittedVersion)
- RePEc: Research Papers in Economics (submittedVersion)
- DOAJ (DOAJ: Directory of Open Access Journals) (submittedVersion, cc-by-sa)
- Funders
- University of Michigan
- Coordenação de Aperfeiçoamento de Pessoal de Nível Superior
- Conselho Nacional de Desenvolvimento Científico e Tecnológico
- Peking University
- Ciência sem Fronteiras
- Division of Graduate Education
- Topics
- Life Sciences › Immunology and Microbiology › Microbiology › Antimicrobial Peptides and Activities
- Life Sciences › Biochemistry, Genetics and Molecular Biology › Biotechnology › Bacterial Cancer Therapy
- Health Sciences › Medicine › Otorhinolaryngology › Head and Neck Cancer Studies
- Keywords
- bacteriocins, antimicrobial peptides, head and neck squamous cell carcinoma, anticancer activity, apoptosis, calpain, tumor angiogenesis, microvessel density, carcinogenesis, survival, food preservatives, oral keratinocytes, endothelial cells
- MeSH terms
- Animals, Carcinoma, Squamous Cell, Dose-Response Relationship, Drug, Flow Cytometry, Head and Neck Neoplasms, Humans, Mice, Nude, Mouth Neoplasms, Neoplasms, Experimental, Neovascularization, Pathologic, Nisin, Blotting, Western, Apoptosis, Cell Line, Tumor, Cell Proliferation, Mice, Microvessels, Carcinogenesis
About these checks
Registry, retraction, Cites and statistics results are computed, not judged, with one exception: a printed reference that no index lists is read once by a model before it counts as a citation error. Claims are extracted by a model and kept only when their quote appears verbatim in the text; each cited source is then checked, with a model’s help, for whether it says what the claim relies on. Those verdicts can be wrong — read the claim’s quote and the cited source before relying on one.
Statistics and arithmetic are recomputed, not judged.
Confidence bands are shown only for fields calibrated on our annotated test set. None is calibrated yet, so no band is shown.
What counts as a claim ›How we measure confidence ›How we check this ›
Are you an author, or do you see a problem with this page? Request a review
