

The DOI matches its Crossref record; 46 of the 48 references it cites were found in a registry or an index.
Forest Loss in Protected Areas and Intact Forest Landscapes: A Global Analysis
Open accessAbstract
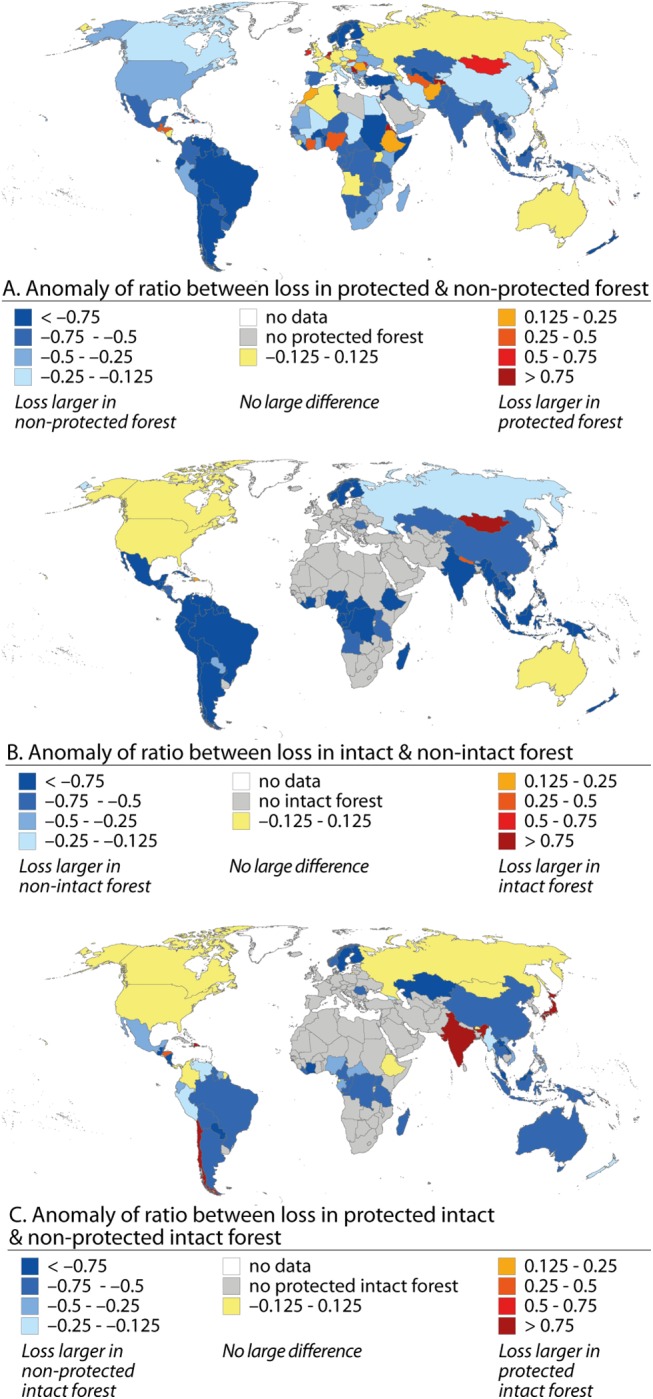
In spite of the high importance of forests, global forest loss has remained alarmingly high during the last decades. Forest loss at a global scale has been unveiled with increasingly finer spatial resolution, but the forest extent and loss in protected areas (PAs) and in large intact forest landscapes (IFLs) have not so far been systematically assessed. Moreover, the impact of protection on preserving the IFLs is not well understood. In this study we conducted a consistent assessment of the global forest loss in PAs and IFLs over the period 2000-2012. We used recently published global remote sensing based spatial forest cover change data, being a uniform and consistent dataset over space and time, together with global datasets on PAs' and IFLs' locations. Our analyses revealed that on a global scale 3% of the protected forest, 2.5% of the intact forest, and 1.5% of the protected intact forest were lost during the study period. These forest loss rates are relatively high compared to global total forest loss of 5% for the same time period. The variation in forest losses and in protection effect was large among geographical regions and countries. In some regions the loss in protected forests exceeded 5% (e.g. in Australia and Oceania, and North America) and the relative forest loss was higher inside protected areas than outside those areas (e.g. in Mongolia and parts of Africa, Central Asia, and Europe). At the same time, protection was found to prevent forest loss in several countries (e.g. in South America and Southeast Asia). Globally, high area-weighted forest loss rates of protected and intact forests were associated with high gross domestic product and in the case of protected forests also with high proportions of agricultural land. Our findings reinforce the need for improved understanding of the reasons for the high forest losses in PAs and IFLs and strategies to prevent further losses.
Overview
The claims and statistics of this paper haven’t been checked yet.
Run the check — free, no account needed. It reads the open-access text and checks the sources it cites.
Integrity signals
Registry
Cites
Statistics
Figures
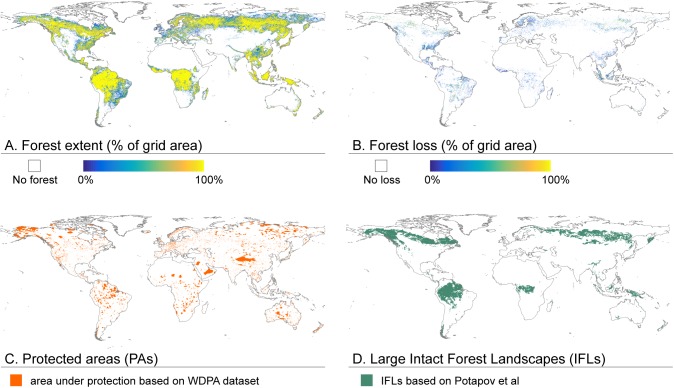
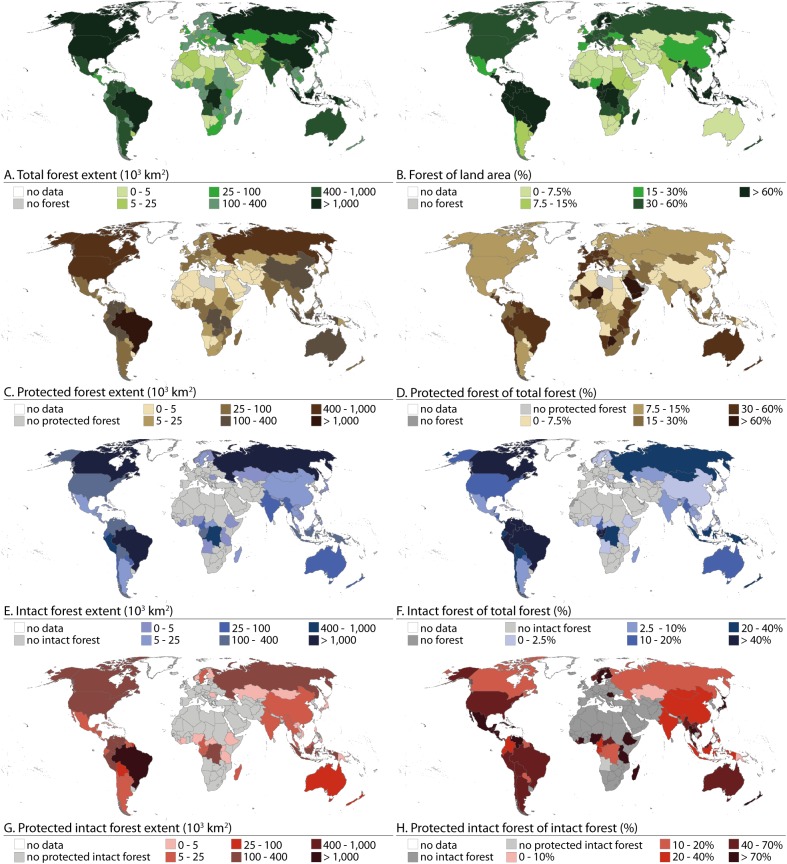
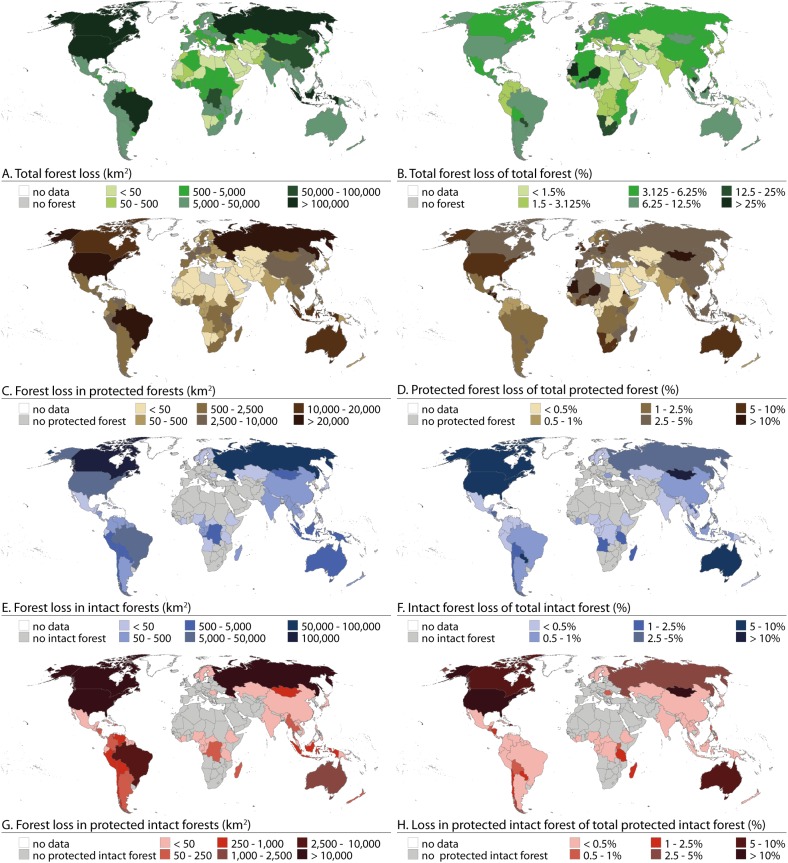
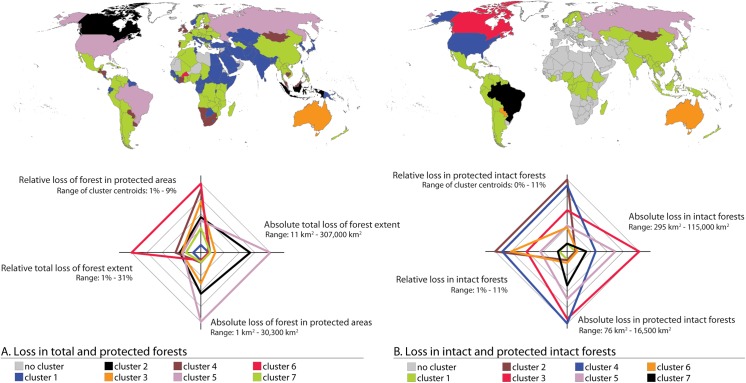
Verification
Claims the paper makes
The claims and statistics of this paper haven’t been checked yet.
Run the check — free, no account needed. It reads the open-access text and checks the sources it cites.
Claims other papers make about this one
Each is checked against this paper’s own text: does it say what the citing paper says it does?
The source backs part of the claim, not all of it — or backs it for a different population, condition or comparison.
In the citing paper
“Our results provide regional support for agricultural expansion and 'Urban expansion' being unambiguously linked to forest loss inside protected areas globally (Heino et al. 2015).”
From Forest loss during 2000–2019 in pygmy hippopotamus (Choeropsis liberiensis) habitats was driven by shifting agriculture (2024) · cites this paper as Heino et al. 2015
Experimental — accuracy not yet measured
Self-check
Percentages, sums and reported differences re-computed from the paper’s own numbers.
The self-check needs the paper’s full text.
Citations
Cites
High-Resolution Global Maps of 21st-Century Forest Cover Change
Hansen, M. C., Potapov, P. V., Moore, R., Hancher, M., Turubanova, S. A., Tyukavina, A., Thau, D., Stehman, S. V., Goetz, S. J., Loveland, T. R., et al. (2013) · Science · doi:10.1126/science.1244693 · Cited by 11,704
A large and persistent carbon sink in the world’s forests
Pan, Y., Birdsey, R. A., Fang, J., Houghton, R., Kauppi, P. E., Kurz, W. A., Phillips, O. L., Shvidenko, A., Lewis, S. L., Canadell, J. G., et al. (2011) · Science · doi:10.1126/science.1201609 · Cited by 8,458
Forests and Climate Change: Forcings, Feedbacks, and the Climate Benefits of Forests
Bonan, G. B. (2008) · Science · doi:10.1126/science.1155121 · Cited by 6,572
Proximate Causes and Underlying Driving Forces of Tropical Deforestation
GEIST, H. J., & LAMBIN, E. F. (2002) · BioScience · doi:10.1641/0006-3568(2002)052[0143:pcaudf]2.0.co;2 · Cited by 3,123 · cited 3×
“The dominant drivers, however, vary among the regions [8–13].”
BackgroundGuidelines for applying protected area management categories
Dudley, N. (2008) · IUCN eBooks · doi:10.2305/iucn.ch.2008.paps.2.en · Cited by 3,007 · cited 1×
“…fell within IUCN ’ s four strictest protection categories (I-IV) and 13.5% within IUCN ’ s all six protection categories (I-VI) (IUCN protection categories vary from strictly protected areas (I) to protected areas with sustainable resource use (VI); for more detailed category definition see [19]).”
BackgroundInfluentialFire as a global ‘herbivore’: the ecology and evolution of flammable ecosystems
BOND, W., & KEELEY, J. (2005) · Trends in Ecology & Evolution · doi:10.1016/j.tree.2005.04.025 · Cited by 2,484
Primary forests are irreplaceable for sustaining tropical biodiversity
Gibson, L., Lee, T. M., Koh, L. P., Brook, B. W., Gardner, T. A., Barlow, J., Peres, C. A., Bradshaw, C. J. A., Laurance, W. F., Lovejoy, T. E., et al. (2011) · Nature · doi:10.1038/nature10425 · Cited by 2,147 · cited 1×
“They maintain ecological diversity, regulate climate, store carbon, protect soil and water and provide resources and livelihoods for the world’s population [1–4].”
BackgroundSynergies among extinction drivers under global change
BROOK, B., SODHI, N., & BRADSHAW, C. (2008) · Trends in Ecology & Evolution · doi:10.1016/j.tree.2008.03.011 · Cited by 2,031
Deforestation driven by urban population growth and agricultural trade in the twenty-first century
DeFries, R. S., Rudel, T., Uriarte, M., & Hansen, M. (2010) · Nature Geoscience · doi:10.1038/ngeo756 · Cited by 1,413 · cited 3×
“The main drivers of global deforestation are linked to expansion of agriculture, wood extraction, infrastructure extension, population growth, and expansion of agriculture [8 – 13].”
BackgroundInfluentialAn assessment of deforestation and forest degradation drivers in developing countries
Hosonuma, N., Herold, M., De Sy, V., De Fries, R. S., Brockhaus, M., Verchot, L., Angelsen, A., & Romijn, E. (2012) · Environmental Research Letters · doi:10.1088/1748-9326/7/4/044009 · Cited by 1,366 · cited 3×
“The dominant drivers, however, vary among the regions [8–13].”
Background
Cited by
Sorted by citations
The direct drivers of recent global anthropogenic biodiversity loss
Jaureguiberry, P., Titeux, N., Wiemers, M., Bowler, D. E., Coscieme, L., Golden, A. S., Guerra, C. A., Jacob, U., Takahashi, Y., Settele, J., et al. (2022) · Science Advances · doi:10.1126/sciadv.abm9982 · Cited by 1,121
Potapov, P. V., Hansen, M. C., Pickens, A., Hernández-Serna, A., Tyukavina, A., Turubanova, S. A., Zalles, V., Li, X., Khan, A., Stolle, F., et al. (2022) · Frontiers in Remote Sensing · doi:10.3389/frsen.2022.856903 · Cited by 675
“The overlay of our forest and cropland change data with protected areas and primary forests highlights conservation priority targets (Heino et al., 2015; Turubanova et al., 2018).”
BackgroundGrantham, H. S., Duncan, A., Evans, T., Jones, K. R., Beyer, H. L., Schuster, R. H., Walston, J., Ray, J. C., Robinson, J. G., Callow, M., et al. (2020) · Nature Communications · doi:10.1038/s41467-020-19493-3 · Cited by 546
“We applied a canopy threshold of 20% based on related studies e.g. 31,61 , and resampled to 300 m resolution and used this resolution as the basis for the rest of the analysis (see Supplementary Note 1 for further methods).”
MethodUnderstanding the drivers of S outheast A sian biodiversity loss
Hughes, A. C. (2017) · Ecosphere · doi:10.1002/ecs2.1624 · Cited by 538
“86%), and the majority of countries show under 1% difference between the two (Heino et al. 2015).”
BackgroundInfluentialLeblois, A., Damette, O., & Wolfersberger, J. (2016) · World Development · doi:10.1016/j.worlddev.2016.11.012 · Cited by 252
“This is consistent with Ferretti-Gallon & Busch (2014) and Heino et al. (2015) results showing limited impact of protected areas on deforestation at the national level and high heterogeneity across countries.”
Result
Metadata
- Authors
- Heino, M., Kummu, M., Makkonen, M., Mulligan, M., Verburg, P. H., Jalava, M., & Räsänen, T. A.
- Affiliations
- Aalto University (FI)
- Natural Resources Institute Finland (FI)
- King's College London (GB)
- Vrije Universiteit Amsterdam (NL)
- Corresponding author
- Kummu, Matti
- ORCID
- Venue
- PLOS ONE
- Publisher
- Public Library of Science (PLoS)
- Published
- 2015-10-14
- Volume
- 10
- Issue
- 10
- Pages
- e0138918
- ISSN
- 1932-6203 (ISSN-L)
- PMC
- PMC4605629
- OpenAlex
- W2211614845
- Cited by
- 192
- References
- 48
- Citations by year
- 2026: 13 · 2025: 13 · 2024: 18 · 2023: 18 · 2022: 14 · 2021: 25 · 2020: 30 · 2019: 26 · 2018: 14 · 2017: 9 · 2016: 9 · 2015: 3
- FWCI
- 9.57
- Type
- journal article
- Language
- en
- Open access
- gold
- doi.org
- Licence
- Locations
- PLoS ONE (publishedVersion, cc-by)
- Europe PMC (PubMed Central) (publishedVersion, cc-by)
- PubMed Central (publishedVersion, cc-by)
- PubMed (publishedVersion)
- VU Research Portal (publishedVersion, other-oa)
- Jukuri (Natural Resources Institute Finland (Luke)) (submittedVersion, cc-by)
- RePEc: Research Papers in Economics (submittedVersion)
- Aaltodoc (Aalto University) (submittedVersion, cc-by)
- DOAJ (DOAJ: Directory of Open Access Journals) (submittedVersion, cc-by-sa)
- Figshare (submittedVersion, cc-by)
- Jukuri (Natural Resources Institute Finland (Luke)) (submittedVersion)
- Research Portal (King's College London) (submittedVersion, cc-by)
- Data Archiving and Networked Services (DANS) (submittedVersion, other-oa)
- Funders
- Academy of Finland (267463, 257919)
- Aalto-Yliopisto
- China Scholarship Council
- FP7 Ideas: European Research Council (311819)
- Topics
- Physical Sciences › Environmental Science › Global and Planetary Change › Conservation, Biodiversity, and Resource Management
- Physical Sciences › Environmental Science › Global and Planetary Change › Land Use and Ecosystem Services
- Life Sciences › Agricultural and Biological Sciences › Forestry › Forest Management and Policy
- Keywords
- forest loss, protected areas, intact forest landscapes, forest cover change, protected area effectiveness, gross domestic product, agricultural land, deforestation
- MeSH terms
- Africa, Agriculture, Americas, Asia, Australia, Conservation of Natural Resources, Europe, Humans, Trees, Forestry, Geographic Information Systems, Remote Sensing Technology, Forests
About these checks
Registry, retraction, Cites and statistics results are computed, not judged, with one exception: a printed reference that no index lists is read once by a model before it counts as a citation error. Claims are extracted by a model and kept only when their quote appears verbatim in the text; each cited source is then checked, with a model’s help, for whether it says what the claim relies on. Those verdicts can be wrong — read the claim’s quote and the cited source before relying on one.
Statistics and arithmetic are recomputed, not judged.
Confidence bands are shown only for fields calibrated on our annotated test set. None is calibrated yet, so no band is shown.
What counts as a claim ›How we measure confidence ›How we check this ›
Are you an author, or do you see a problem with this page? Request a review
