Cited by 107

The DOI matches its Crossref record; 3 of the 3 references it cites were found in a registry or an index.

Immune and Inflammatory Cell Composition of Human Lung Cancer Stroma

Banat, G-Andre, Tretyn, Aleksandra, Pullamsetti, Soni Savai, Wilhelm, Jochen, Weigert, Andreas, Olesch, Catherine, Ebel, Katharina, Stiewe, Thorsten, Grimminger, Friedrich, Seeger, Werner, Fink, Ludger, Savai, Rajkumar·2015·PLOS ONE

Overview

The claims and statistics of this paper haven’t been checked yet.

Run the check — free, no account needed. It reads the open-access text and checks the sources it cites.

A few free checks a day · papers already verified open instantly · results are public

Integrity signals

Registry

Crossref · 10.1371/journal.pone.0139073

Cites

3 of 3 references verified0 citation errors · 0 not checkable

Statistics

Figures

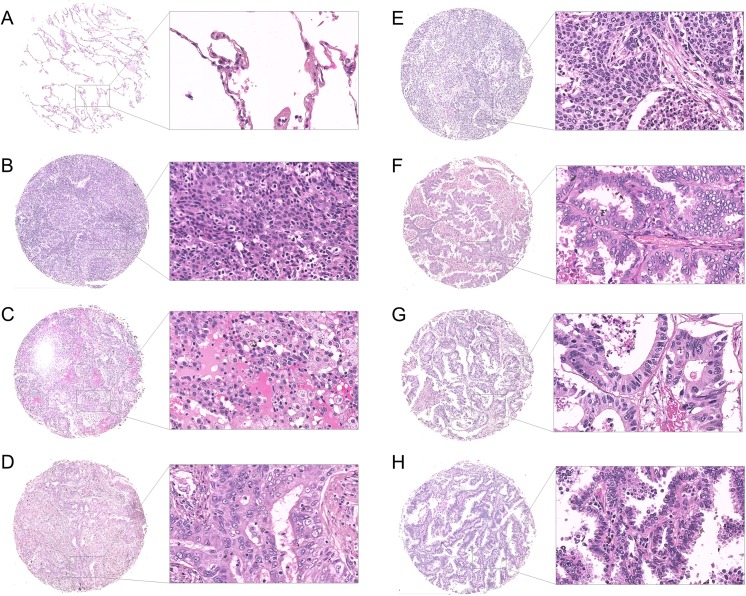
Fig 1 Morphological analysis of human lung specimens. Representative images of human lung sections stained with hematoxylin and eosin based on their pathology. (A) Healthy donor, (B) squamous cell carcinoma, (C) adenocarcinoma, (D) adenosquamous carcinoma, (E) small cell carcinoma, (F) papillary adenocarcinoma, (G) metastatic adenocarcinoma, and (H) bronchioloalveolar carcinoma. Scale bar = 250 μm.
Fig 1 Morphological analysis of human lung specimens. Representative images of human lung sections stained with hematoxylin and eosin based on their pathology. (A) Healthy donor, (B) squamous cell carcinoma, (C) adenocarcinoma, (D) adenosquamous carcinoma, (E) small cell carcinoma, (F) papillary adenocarcinoma, (G) metastatic adenocarcinoma, and (H) bronchioloalveolar carcinoma. Scale bar = 250 μm.CC BY · PubMed Central
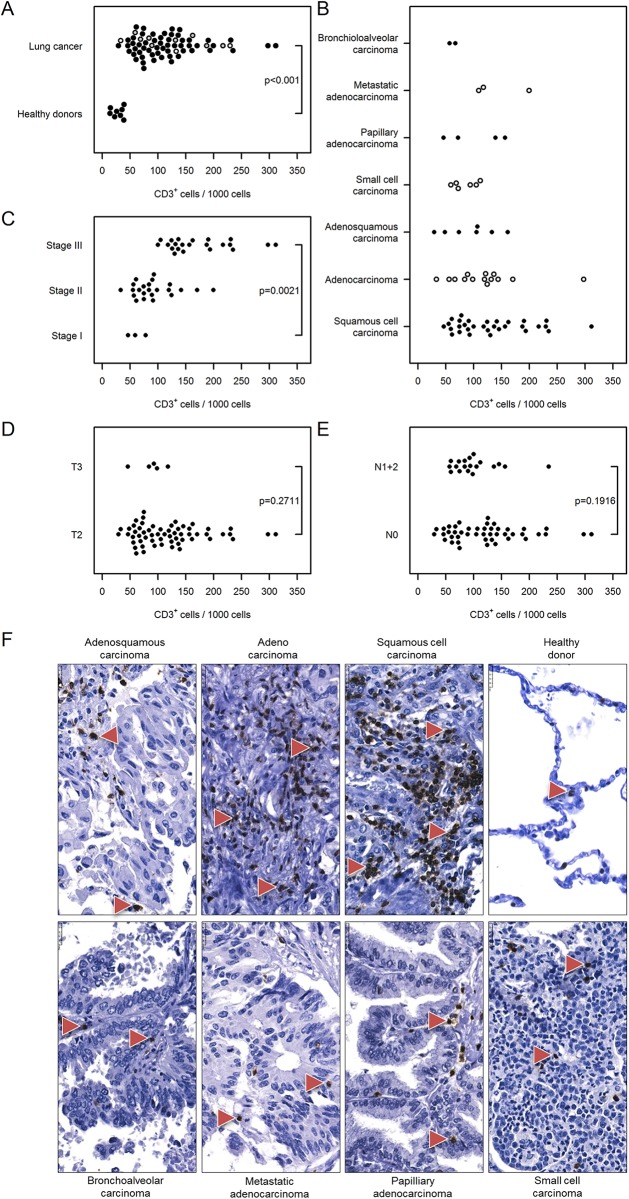
Fig 2 Immunohistochemical analysis and quantification of CD3-positive T lymphocytes in human lung cancer. Human lung cancer tissue array was stained with CD3 antibody to detect T lymphocytes. (A) Quantification of CD3+ cells in lung cancer vs. healthy donor specimens. (B–E) Quantification of CD3+ cells based on (B) their pathology, (C) cancer stage, (D) tumor size, and (E) nodal status. Cell numbers are given as CD3-positive cells per 1000 cells. (F) Representative images of human lung sections stained with CD3 antibody based on their pathology. Scale bar = 25 μm.
Fig 2 Immunohistochemical analysis and quantification of CD3-positive T lymphocytes in human lung cancer. Human lung cancer tissue array was stained with CD3 antibody to detect T lymphocytes. (A) Quantification of CD3+ cells in lung cancer vs. healthy donor specimens. (B–E) Quantification of CD3+ cells based on (B) their pathology, (C) cancer stage, (D) tumor size, and (E) nodal status. Cell numbers are given as CD3-positive cells per 1000 cells. (F) Representative images of human lung sections stained with CD3 antibody based on their pathology. Scale bar = 25 μm.CC BY · PubMed Central
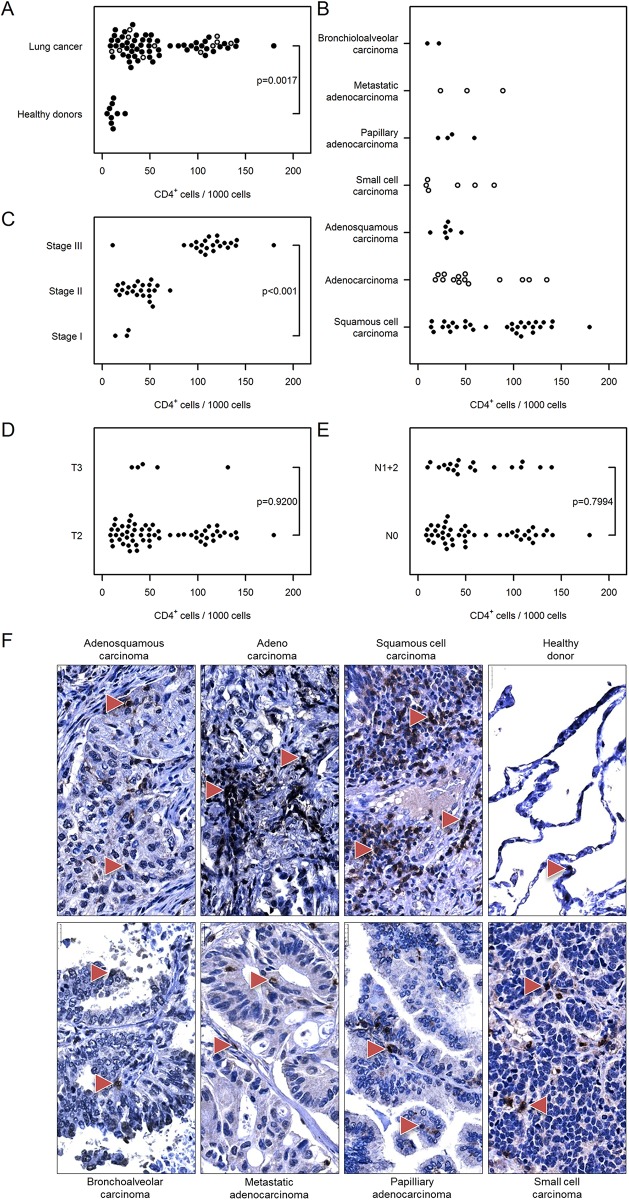
Fig 3 Immunohistochemical analysis and quantification of CD4-positive T lymphocytes in human lung cancer. Human lung cancer tissue array was stained with CD4 antibody to detect T helper cells. (A) Quantification of CD4+ cells in lung cancer vs. healthy donor specimens. (B–E) Quantification of CD4+ cells based on (B) their pathology, (C) cancer stage, (D) tumor size, and (E) nodal status. Cell numbers are given as CD4-positive cells per 1000 cells. (F) Representative images of human lung sections stained with CD4 antibody based on their pathology. Scale bar = 25 μm.
Fig 3 Immunohistochemical analysis and quantification of CD4-positive T lymphocytes in human lung cancer. Human lung cancer tissue array was stained with CD4 antibody to detect T helper cells. (A) Quantification of CD4+ cells in lung cancer vs. healthy donor specimens. (B–E) Quantification of CD4+ cells based on (B) their pathology, (C) cancer stage, (D) tumor size, and (E) nodal status. Cell numbers are given as CD4-positive cells per 1000 cells. (F) Representative images of human lung sections stained with CD4 antibody based on their pathology. Scale bar = 25 μm.CC BY · PubMed Central
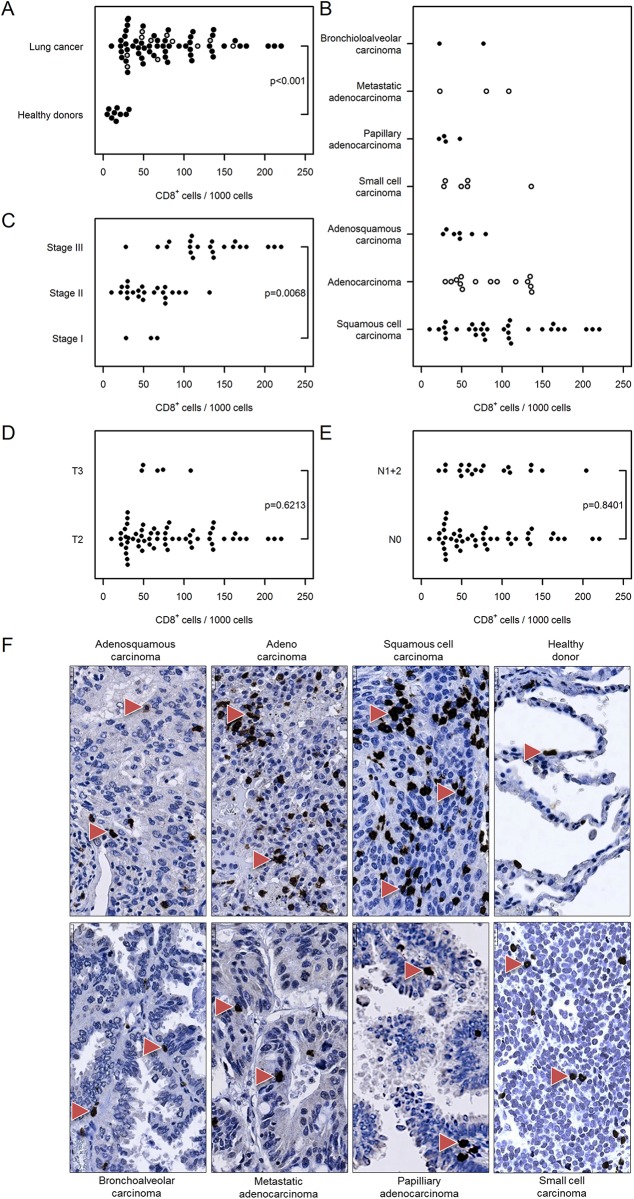
Fig 4 Immunohistochemical analysis and quantification of CD8-positive T lymphocytes in human lung cancer. Human lung cancer tissue array was stained with CD8 antibody to detect cytotoxic T lymphocytes. (A) Quantification of CD8+ cells in lung cancer vs. healthy donor specimens. (B–E) Quantification of CD8+ cells based on (B) their pathology, (C) cancer stage, (D) tumor size, and (E) nodal status. Cell numbers are given as CD8-positive cells per 1000 cells. (F) Representative images of human lung sections stained with CD8 antibody based on their pathology. Scale bar = 25 μm.
Fig 4 Immunohistochemical analysis and quantification of CD8-positive T lymphocytes in human lung cancer. Human lung cancer tissue array was stained with CD8 antibody to detect cytotoxic T lymphocytes. (A) Quantification of CD8+ cells in lung cancer vs. healthy donor specimens. (B–E) Quantification of CD8+ cells based on (B) their pathology, (C) cancer stage, (D) tumor size, and (E) nodal status. Cell numbers are given as CD8-positive cells per 1000 cells. (F) Representative images of human lung sections stained with CD8 antibody based on their pathology. Scale bar = 25 μm.CC BY · PubMed Central
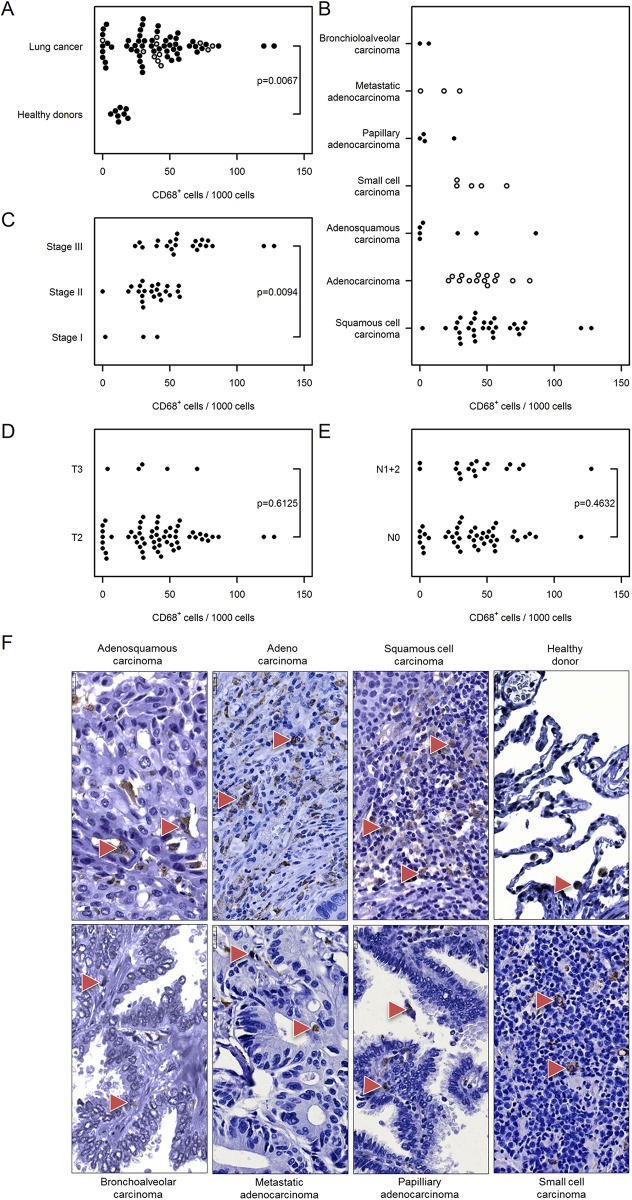
Fig 5 Immunohistochemical analysis and quantification of CD68-positive cells in human lung cancer. Human lung cancer tissue array was stained with CD68 antibody to detect macrophages. (A) Quantification of CD68+ cells in lung cancer vs. healthy donor specimens. (B–E) Quantification of CD68+ cells based on (B) their pathology, (C) cancer stage, (D) tumor size, and (E) nodal status. Cell numbers are given as CD68-positive cells per 1000 cells. (F) Representative images of human lung sections stained with CD68 antibody based on their pathology. Scale bar = 25 μm.
Fig 5 Immunohistochemical analysis and quantification of CD68-positive cells in human lung cancer. Human lung cancer tissue array was stained with CD68 antibody to detect macrophages. (A) Quantification of CD68+ cells in lung cancer vs. healthy donor specimens. (B–E) Quantification of CD68+ cells based on (B) their pathology, (C) cancer stage, (D) tumor size, and (E) nodal status. Cell numbers are given as CD68-positive cells per 1000 cells. (F) Representative images of human lung sections stained with CD68 antibody based on their pathology. Scale bar = 25 μm.CC BY · PubMed Central
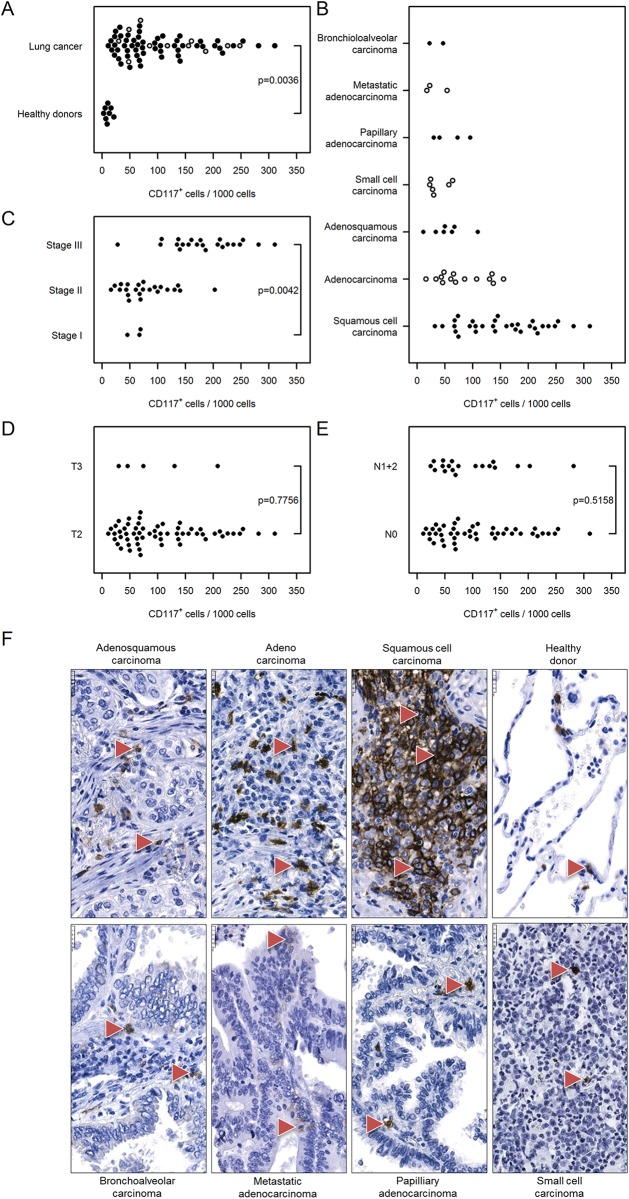
Fig 6 Immunohistochemical analysis and quantification of CD117-positive cells in human lung cancer. Human lung cancer tissue array was stained with CD117 (cKit) antibody to detect mast cells. (A) Quantification of CD117+ cells in lung cancer vs. healthy donor specimens. (B–E) Quantification of CD117+ cells based on (B) their pathology, (C) cancer stage, (D) tumor size, and (E) nodal status. Cell numbers are given as CD117-positive cells per 1000 cells. (F) Representative images of human lung sections stained with CD117 antibody based on their pathology. Scale bar = 25 μm.
Fig 6 Immunohistochemical analysis and quantification of CD117-positive cells in human lung cancer. Human lung cancer tissue array was stained with CD117 (cKit) antibody to detect mast cells. (A) Quantification of CD117+ cells in lung cancer vs. healthy donor specimens. (B–E) Quantification of CD117+ cells based on (B) their pathology, (C) cancer stage, (D) tumor size, and (E) nodal status. Cell numbers are given as CD117-positive cells per 1000 cells. (F) Representative images of human lung sections stained with CD117 antibody based on their pathology. Scale bar = 25 μm.CC BY · PubMed Central
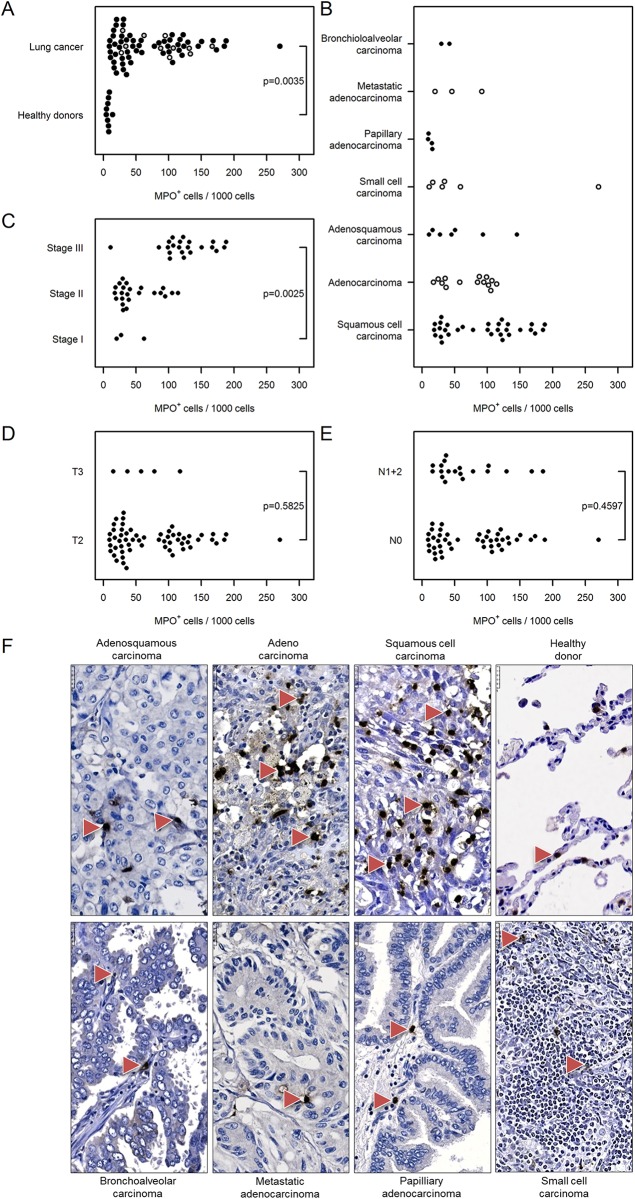
Fig 7 Immunohistochemical analysis and quantification of MPO-positive cells in human lung cancer. Human lung cancer tissue array was stained with MPO antibody to detect neutrophil granulocytes. (A) Quantification of MPO+ cells in lung cancer vs. healthy donor specimens. (B–E) Quantification of MPO+ cells based on (B) their pathology, (C) cancer stage, (D) tumor size, and (E) nodal status. Cell numbers are given as MPO-positive cells per 1000 cells. (F) Representative images of human lung sections stained with MPO antibody based on their pathology. Scale bar = 25 μm.
Fig 7 Immunohistochemical analysis and quantification of MPO-positive cells in human lung cancer. Human lung cancer tissue array was stained with MPO antibody to detect neutrophil granulocytes. (A) Quantification of MPO+ cells in lung cancer vs. healthy donor specimens. (B–E) Quantification of MPO+ cells based on (B) their pathology, (C) cancer stage, (D) tumor size, and (E) nodal status. Cell numbers are given as MPO-positive cells per 1000 cells. (F) Representative images of human lung sections stained with MPO antibody based on their pathology. Scale bar = 25 μm.CC BY · PubMed Central
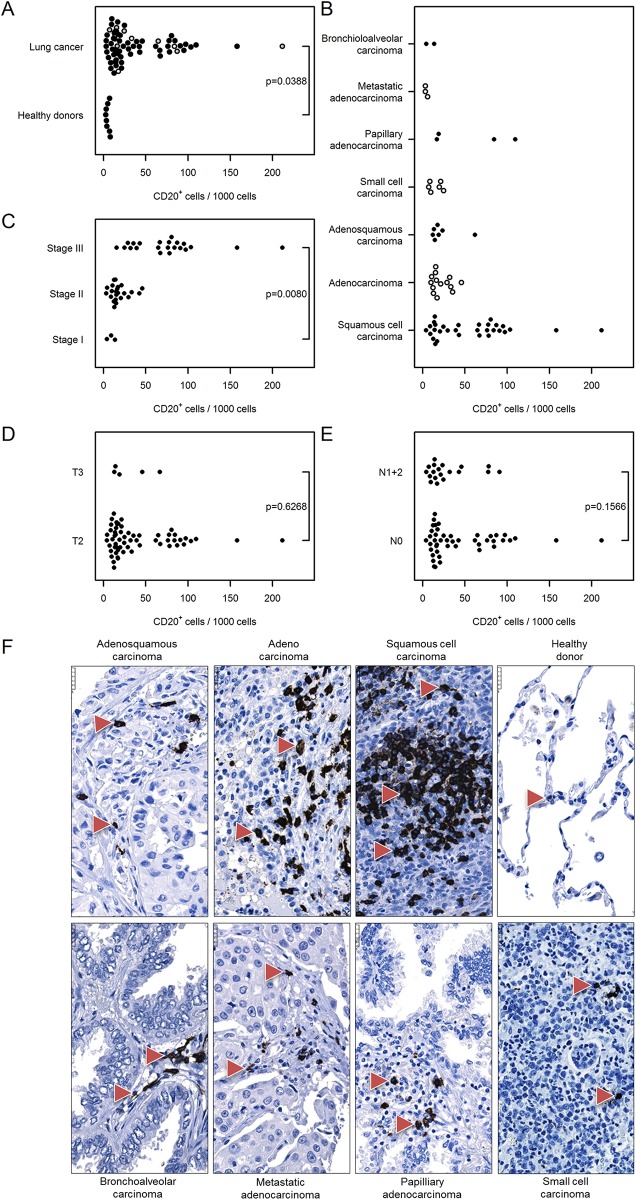
Fig 8 Immunohistochemical analysis and quantification of CD20-positive cells in human lung cancer. Human lung cancer tissue array was stained with CD20 antibody to detect B cells. (A) Quantification of CD20+ cells in lung cancer vs. healthy donor specimens. (B–E) Quantification of CD20+ cells based on (B) their pathology, (C) cancer stage, (D) tumor size, and (E) nodal status. Cell numbers are given as CD20-positive cells per 1000 cells. (F) Representative images of human lung sections stained with CD20 antibody based on their pathology. Scale bar = 25 μm.
Fig 8 Immunohistochemical analysis and quantification of CD20-positive cells in human lung cancer. Human lung cancer tissue array was stained with CD20 antibody to detect B cells. (A) Quantification of CD20+ cells in lung cancer vs. healthy donor specimens. (B–E) Quantification of CD20+ cells based on (B) their pathology, (C) cancer stage, (D) tumor size, and (E) nodal status. Cell numbers are given as CD20-positive cells per 1000 cells. (F) Representative images of human lung sections stained with CD20 antibody based on their pathology. Scale bar = 25 μm.CC BY · PubMed Central
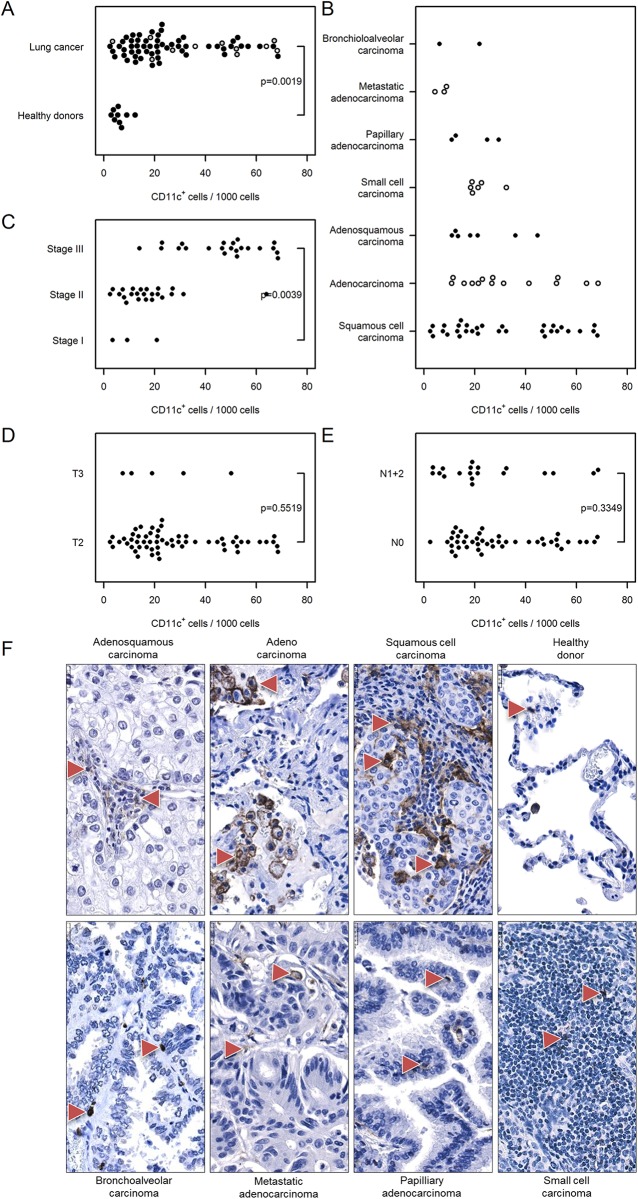
Fig 9 Immunohistochemical analysis and quantification of CD11c-positive cells in human lung cancer. Human lung cancer tissue array was stained with CD11c antibody to detect dendritic cells. (A) Quantification of CD11c+ cells in lung cancer vs. healthy donor specimens. (B–E) Quantification of CD11c+ cells based on (B) their pathology, (C) cancer stage, (D) tumor size, and (E) nodal status. Cell numbers are given as CD11c-positive cells per 1000 cells. (F) Representative images of human lung sections stained with CD11c antibody based on their pathology. Scale bar = 25 μm.
Fig 9 Immunohistochemical analysis and quantification of CD11c-positive cells in human lung cancer. Human lung cancer tissue array was stained with CD11c antibody to detect dendritic cells. (A) Quantification of CD11c+ cells in lung cancer vs. healthy donor specimens. (B–E) Quantification of CD11c+ cells based on (B) their pathology, (C) cancer stage, (D) tumor size, and (E) nodal status. Cell numbers are given as CD11c-positive cells per 1000 cells. (F) Representative images of human lung sections stained with CD11c antibody based on their pathology. Scale bar = 25 μm.CC BY · PubMed Central
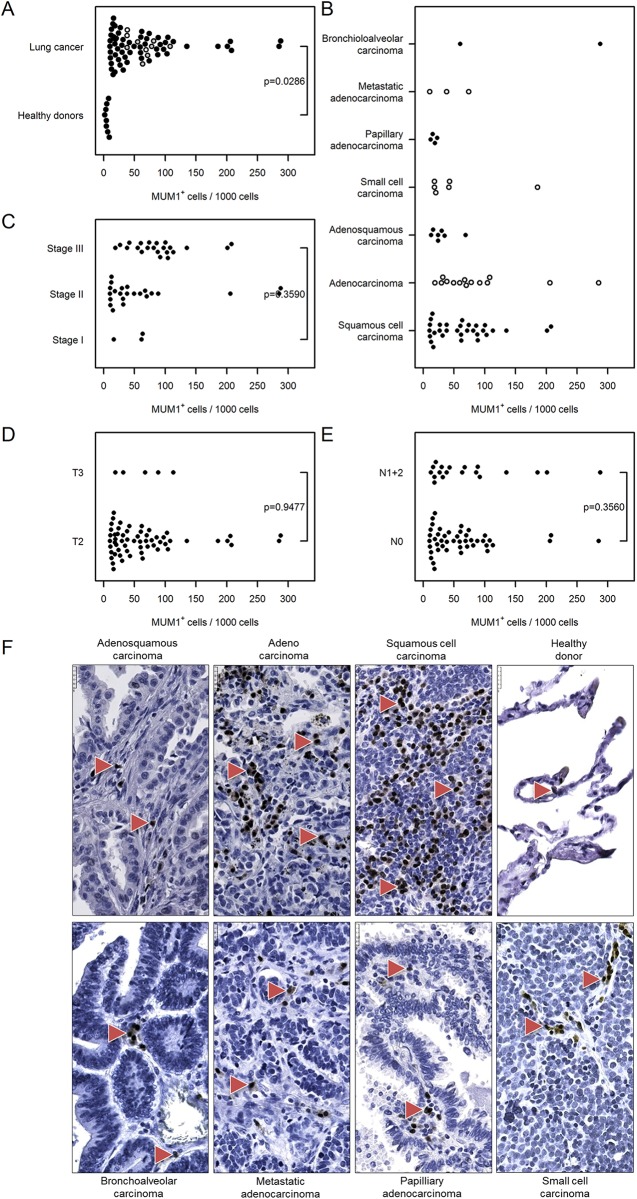
Fig 10 Immunohistochemical analysis and quantification of MUM1–positive cells in human lung cancer. Human lung cancer tissue array was stained with MUM1 antibody to detect plasma cells and activated T cells. (A) Quantification of MUM1+ cells in lung cancer vs. healthy donor specimens. (B–E) Quantification of MUM1+ cells based on (B) their pathology, (C) cancer stage, (D) tumor size, and (E) nodal status. Cell numbers are given as MUM1–positive cells per 1000 cells. (F) Representative images of human lung sections stained with MUM1 antibody based on their pathology. Scale bar = 25 μm.
Fig 10 Immunohistochemical analysis and quantification of MUM1–positive cells in human lung cancer. Human lung cancer tissue array was stained with MUM1 antibody to detect plasma cells and activated T cells. (A) Quantification of MUM1+ cells in lung cancer vs. healthy donor specimens. (B–E) Quantification of MUM1+ cells based on (B) their pathology, (C) cancer stage, (D) tumor size, and (E) nodal status. Cell numbers are given as MUM1–positive cells per 1000 cells. (F) Representative images of human lung sections stained with MUM1 antibody based on their pathology. Scale bar = 25 μm.CC BY · PubMed Central
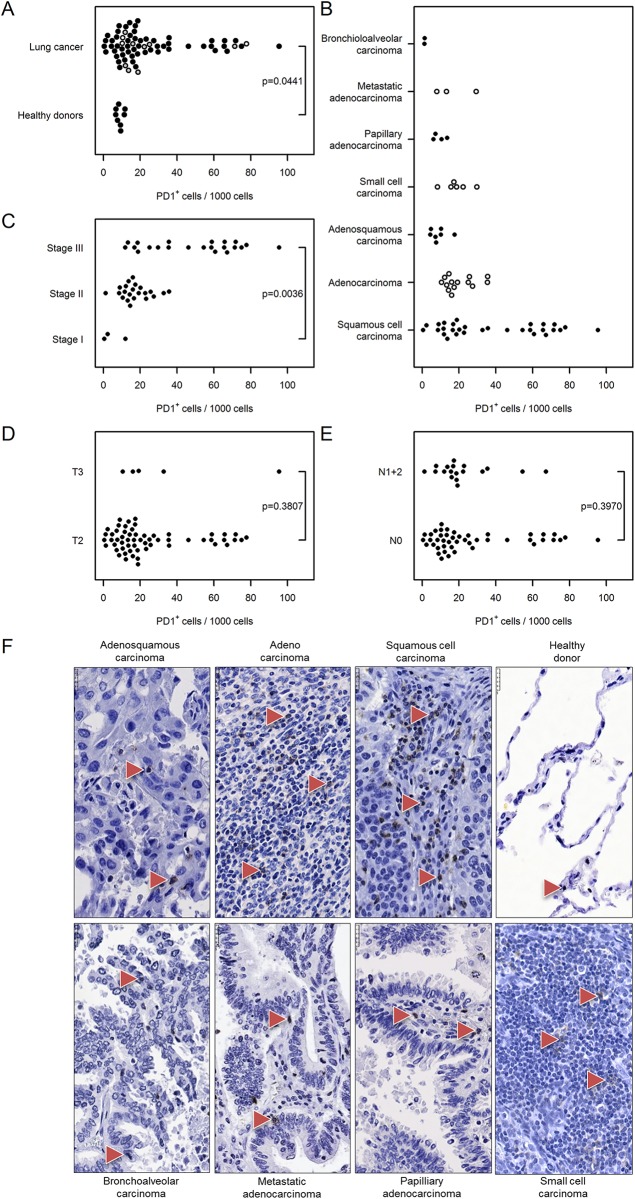
Fig 11 Immunohistochemical analysis and quantification of PD1–positive cells in human lung cancer. Human lung cancer tissue array was stained with PD1 antibody to detect activated T cells, B cells, myeloid cells, and a subset of thymocytes. (A) Quantification of PD1+ cells in lung cancer vs. healthy donor specimens. (B–E) Quantification of PD1+ cells based on (B) their pathology, (C) cancer stage, (D) tumor size, and (E) nodal status. Cell numbers are given as PD1–positive cells per 1000 cells. (F) Representative images of human lung sections stained with PD1 antibody based on their pathology. Scale bar = 25 μm.
Fig 11 Immunohistochemical analysis and quantification of PD1–positive cells in human lung cancer. Human lung cancer tissue array was stained with PD1 antibody to detect activated T cells, B cells, myeloid cells, and a subset of thymocytes. (A) Quantification of PD1+ cells in lung cancer vs. healthy donor specimens. (B–E) Quantification of PD1+ cells based on (B) their pathology, (C) cancer stage, (D) tumor size, and (E) nodal status. Cell numbers are given as PD1–positive cells per 1000 cells. (F) Representative images of human lung sections stained with PD1 antibody based on their pathology. Scale bar = 25 μm.CC BY · PubMed Central

Verification

Claims the paper makes

The claims and statistics of this paper haven’t been checked yet.

Run the check — free, no account needed. It reads the open-access text and checks the sources it cites.

A few free checks a day · papers already verified open instantly · results are public

Claims other papers make about this one

Each is checked against this paper’s own text: does it say what the citing paper says it does?

Self-check

Percentages, sums and reported differences re-computed from the paper’s own numbers.

The self-check needs the paper’s full text.

Citations

Cites

Research works printed but not linked: 38

  1. R Siegel, 2013, Cancer statistics, 2013, CA Cancer J Clin, 63, 11, 10.3322/caac.21166 · DOI · Paper page
  2. A Jemal, 2011, Global cancer statistics, CA: a cancer journal for clinicians, 61, 69
  3. SP Nana-Sinkam, 2013, Molecular biology of lung cancer: Diagnosis and management of lung cancer, 3rd ed: American College of Chest Physicians evidence-based clinical practice guidelines, Chest, 143, e30S, 10.1378/chest.12-2346 · DOI
  4. J Lorenz, 1994, Oncogene overexpression in non-small-cell lung cancer tissue: prevalence and clinicopathological significance, Clin Investig, 72, 156, 10.1007/BF00184595 · DOI
  5. M Peifer, 2012, Integrative genome analyses identify key somatic driver mutations of small-cell lung cancer, Nat Genet, 44, 1104, 10.1038/ng.2396 · DOI
  6. D Hanahan, 2011, Hallmarks of cancer: the next generation, Cell, 144, 646, 10.1016/j.cell.2011.02.013 · DOI · Paper page
  7. MA Swartz, 2012, Tumor microenvironment complexity: emerging roles in cancer therapy, Cancer Res, 72, 2473, 10.1158/0008-5472.CAN-12-0122 · DOI · Paper page
  8. R Remark, 2015, The non-small cell lung cancer immune contexture. A major determinant of tumor characteristics and patient outcome, Am J Respir Crit Care Med, 191, 377, 10.1164/rccm.201409-1671PP · DOI
  9. G Bindea, 2013, Spatiotemporal dynamics of intratumoral immune cells reveal the immune landscape in human cancer, Immunity, 39, 782, 10.1016/j.immuni.2013.10.003 · DOI
  10. A Schmall, 2015, Macrophage and cancer cell cross-talk via CCR2 and CX3CR1 is a fundamental mechanism driving lung cancer, Am J Respir Crit Care Med, 191, 437, 10.1164/rccm.201406-1137OC · DOI
  11. N El-Nikhely, 2012, Tumor-stromal interactions in lung cancer: novel candidate targets for therapeutic intervention, Expert Opin Investig Drugs, 21, 1107, 10.1517/13543784.2012.693478 · DOI
  12. E Tartour, 2013, Lung cancer: potential targets for immunotherapy, The Lancet Respiratory medicine, 1, 551, 10.1016/S2213-2600(13)70159-0 · DOI
  13. A Kataki, 2002, Tumor infiltrating lymphocytes and macrophages have a potential dual role in lung cancer by supporting both host-defense and tumor progression, J Lab Clin Med, 140, 320, 10.1067/mlc.2002.128317 · DOI
  14. E Ruffini, 2009, Clinical significance of tumor-infiltrating lymphocytes in lung neoplasms, Ann Thorac Surg, 87, 365, 10.1016/j.athoracsur.2008.10.067 · DOI
  15. O Kawai, 2008, Predominant infiltration of macrophages and CD8(+) T Cells in cancer nests is a significant predictor of survival in stage IV nonsmall cell lung cancer, Cancer, 113, 1387, 10.1002/cncr.23712 · DOI
  16. A Kilic, 2011, Density of tumor-infiltrating lymphocytes correlates with disease recurrence and survival in patients with large non-small-cell lung cancer tumors, J Surg Res, 167, 207, 10.1016/j.jss.2009.08.029 · DOI
  17. KI Al-Shibli, 2008, Prognostic effect of epithelial and stromal lymphocyte infiltration in non-small cell lung cancer, Clin Cancer Res, 14, 5220, 10.1158/1078-0432.CCR-08-0133 · DOI
  18. R Savai, 2012, Immune and inflammatory cell involvement in the pathology of idiopathic pulmonary arterial hypertension, Am J Respir Crit Care Med, 186, 897, 10.1164/rccm.201202-0335OC · DOI
  19. R Savai, 2014, Pro-proliferative and inflammatory signaling converge on FoxO1 transcription factor in pulmonary hypertension, Nat Med, 20, 1289, 10.1038/nm.3695 · DOI
  20. KC El Kasmi, 2014, Adventitial fibroblasts induce a distinct proinflammatory/profibrotic macrophage phenotype in pulmonary hypertension, J Immunol, 193, 597, 10.4049/jimmunol.1303048 · DOI
  21. H Turner, 2011, A peer-reviewed, open-access publication of the R Foundation for Statistical Computing, R Journal, 3, 3
  22. W Gardner, 1995, Regression analyses of counts and rates: Poisson, overdispersed Poisson, and negative binomial models, Psychological bulletin, 118, 392, 10.1037/0033-2909.118.3.392 · DOI
  23. RM Bremnes, 2011, The role of tumor-infiltrating immune cells and chronic inflammation at the tumor site on cancer development, progression, and prognosis: emphasis on non-small cell lung cancer, J Thorac Oncol, 6, 824, 10.1097/JTO.0b013e3182037b76 · DOI
  24. H Prado-Garcia, 2012, Tumor-induced CD8+ T-cell dysfunction in lung cancer patients, Clin Dev Immunol, 2012, 741741, 10.1155/2012/741741 · DOI
  25. TJ Welsh, 2005, Macrophage and mast-cell invasion of tumor cell islets confers a marked survival advantage in non-small-cell lung cancer, J Clin Oncol, 23, 8959, 10.1200/JCO.2005.01.4910 · DOI
  26. R Zaynagetdinov, 2011, A critical role for macrophages in promotion of urethane-induced lung carcinogenesis, J Immunol, 187, 5703, 10.4049/jimmunol.1100558 · DOI
  27. JJ Chen, 2005, Tumor-associated macrophages: the double-edged sword in cancer progression, J Clin Oncol, 23, 953, 10.1200/JCO.2005.12.172 · DOI
  28. H Ohnuki, 2014, Tumor-infiltrating myeloid cells activate Dll4/Notch/TGF-beta signaling to drive malignant progression, Cancer Res, 74, 2038, 10.1158/0008-5472.CAN-13-3118 · DOI
  29. A Bellocq, 1998, Neutrophil alveolitis in bronchioloalveolar carcinoma: induction by tumor-derived interleukin-8 and relation to clinical outcome, Am J Pathol, 152, 83
  30. DA Hume, 2008, Macrophages as APC and the dendritic cell myth, J Immunol, 181, 5829, 10.4049/jimmunol.181.9.5829 · DOI
  31. I Perrot, 2007, Dendritic cells infiltrating human non-small cell lung cancer are blocked at immature stage, J Immunol, 178, 2763, 10.4049/jimmunol.178.5.2763 · DOI
  32. KE de Visser, 2005, De novo carcinogenesis promoted by chronic inflammation is B lymphocyte dependent, Cancer Cell, 7, 411, 10.1016/j.ccr.2005.04.014 · DOI
  33. M Shapiro-Shelef, 2005, Regulation of plasma-cell development, Nat Rev Immunol, 5, 230, 10.1038/nri1572 · DOI
  34. M Lohr, 2013, The prognostic relevance of tumour-infiltrating plasma cells and immunoglobulin kappa C indicates an important role of the humoral immune response in non-small cell lung cancer, Cancer Lett, 333, 222, 10.1016/j.canlet.2013.01.036 · DOI
  35. M Fujimoto, 2013, Stromal plasma cells expressing immunoglobulin G4 subclass in non-small cell lung cancer, Hum Pathol, 44, 1569, 10.1016/j.humpath.2013.01.002 · DOI
  36. LM Francisco, 2010, The PD-1 pathway in tolerance and autoimmunity, Immunol Rev, 236, 219, 10.1111/j.1600-065X.2010.00923.x · DOI · Paper page
  37. N Patsoukis, 2012, Selective effects of PD-1 on Akt and Ras pathways regulate molecular components of the cell cycle and inhibit T cell proliferation, Sci Signal, 5, ra46, 10.1126/scisignal.2002796 · DOI · Paper page
  38. SL Topalian, 2012, Safety, activity, and immune correlates of anti-PD-1 antibody in cancer, The New England journal of medicine, 366, 2443, 10.1056/NEJMoa1200690 · DOI · Paper page

Cited by

Sorted by citations

See all 107

Metadata

Authors
Banat, G.-A., Tretyn, A., Pullamsetti, S. S., Wilhelm, J., Weigert, A., Olesch, C., Ebel, K., Stiewe, T., Grimminger, F., Seeger, W., Fink, L., & Savai, R.
Venue
PLOS ONE
Published
2015-09-28
Volume
10
Issue
9
Pages
e0139073
ISSN
1932-6203
Cited by
107
References
3
Language
en

About these checks

Registry, retraction, Cites and statistics results are computed, not judged, with one exception: a printed reference that no index lists is read once by a model before it counts as a citation error. Claims are extracted by a model and kept only when their quote appears verbatim in the text; each cited source is then checked, with a model’s help, for whether it says what the claim relies on. Those verdicts can be wrong — read the claim’s quote and the cited source before relying on one.

Statistics and arithmetic are recomputed, not judged.

Confidence bands are shown only for fields calibrated on our annotated test set. None is calibrated yet, so no band is shown.

What counts as a claim ›How we measure confidence ›How we check this ›

Are you an author, or do you see a problem with this page? Request a review