

A Comparison Study of Canonical Correlation Analysis Based Methods for Detecting Steady-State Visual Evoked Potentials
Open accessThe DOI matches its Crossref record; 36 of the 36 references it cites were found in a registry or an index.
Abstract
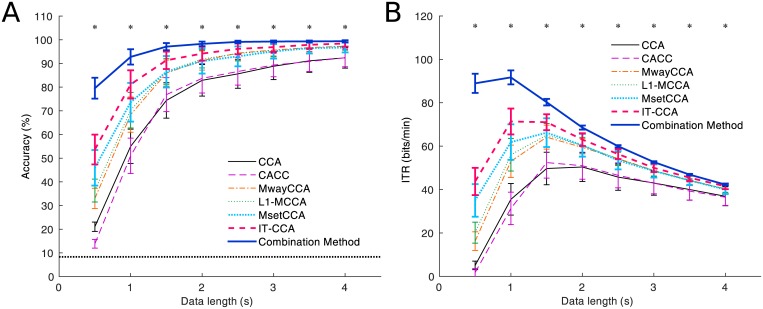
Canonical correlation analysis (CCA) has been widely used in the detection of the steady-state visual evoked potentials (SSVEPs) in brain-computer interfaces (BCIs). The standard CCA method, which uses sinusoidal signals as reference signals, was first proposed for SSVEP detection without calibration. However, the detection performance can be deteriorated by the interference from the spontaneous EEG activities. Recently, various extended methods have been developed to incorporate individual EEG calibration data in CCA to improve the detection performance. Although advantages of the extended CCA methods have been demonstrated in separate studies, a comprehensive comparison between these methods is still missing. This study performed a comparison of the existing CCA-based SSVEP detection methods using a 12-class SSVEP dataset recorded from 10 subjects in a simulated online BCI experiment. Classification accuracy and information transfer rate (ITR) were used for performance evaluation. The results suggest that individual calibration data can significantly improve the detection performance. Furthermore, the results showed that the combination method based on the standard CCA and the individual template based CCA (IT-CCA) achieved the highest performance.
Overview
The claims and statistics of this paper haven’t been checked yet.
Free: it reads the open-access text and checks the first 5 claims that cite a source we can check. Create a free account to check every claim.
Integrity signals
Registry
Cites
Statistics
Figures


Verification
Claims the paper makes
The claims and statistics of this paper haven’t been checked yet.
Free: it reads the open-access text and checks the first 5 claims that cite a source we can check. Create a free account to check every claim.
Claims other papers make about this one
Each is checked against this paper’s own text: does it say what the citing paper says it does?
The source backs part of the claim, not all of it — or backs it for a different population, condition or comparison.
In the citing paper
“CieConv1 are employed to extract the crosschannel correlation of the original input feature map, in which the correlation information assists in decoding EEG correctly.”
From IENet: a robust convolutional neural network for EEG based brain-computer interfaces (2022) · cites this paper as [64]
Experimental — accuracy not yet measuredThe source backs part of the claim, not all of it — or backs it for a different population, condition or comparison.
In the citing paper
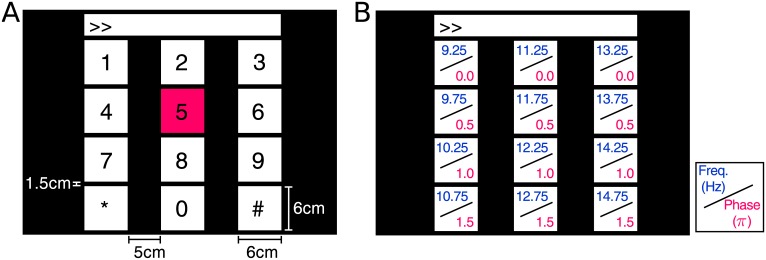
“We can see that temporal kernels of different lengths extract the frequency characteristics of the SSVEP, where the frequency range is consistent with that of the SSVEP experimental stimulus (9.25-14.75 Hz) [64].”
From IENet: a robust convolutional neural network for EEG based brain-computer interfaces (2022) · cites this paper as [64]
Experimental — accuracy not yet measured
Self-check
Percentages, sums and reported differences re-computed from the paper’s own numbers.
The self-check needs the paper’s full text.
Citations
Cites
Brainard, D. H. (1997) · Spatial Vision · doi:10.1163/156856897x00357 · Cited by 19,702 · cited 1×
“) using the Psychophysics Toolbox extensions [35].”
Brain–computer interfaces for communication and control
Wolpaw, J. R., Birbaumer, N., McFarland, D. J., Pfurtscheller, G., & Vaughan, T. M. (2002) · Clinical Neurophysiology · doi:10.1016/s1388-2457(02)00057-3 · Cited by 7,927 · cited 4×
“This study also evaluated the feature values for each method using r -square value (i.e., the proportion of the variance of the signal feature that is accounted for by the user ’ s intent) [1].”
BackgroundMethodInfluentialSteady-state visually evoked potentials: Focus on essential paradigms and future perspectives
Vialatte, F.-B., Maurice, M., Dauwels, J., & Cichocki, A. (2010) · Progress in Neurobiology · doi:10.1016/j.pneurobio.2009.11.005 · Cited by 1,066 · cited 2×
“Various target identification methods have been developed for detecting SSVEPs in BCIs [2 – 4].”
BackgroundMethodFrequency recognition based on canonical correlation analysis for SSVEP-based BCIs
Lin, Z., Zhang, C., Wu, W., & Gao, X. (2007) · IEEE Transactions on Biomedical Engineering · doi:10.1109/tbme.2006.889197 · Cited by 867
Design and implementation of a brain-computer interface with high transfer rates
Cheng, M., Gao, X., Gao, S., & Xu, D. (2002) · IEEE Transactions on Biomedical Engineering · doi:10.1109/tbme.2002.803536 · Cited by 818
Bin, G., Gao, X., Yan, Z., Hong, B., & Gao, S. (2009) · Journal of Neural Engineering · doi:10.1088/1741-2560/6/4/046002 · Cited by 773 · cited 3×
“Among these methods, CCA is one of the most widely used methods in SSVEP-based BCIs due to its high efficiency, robustness, and simple implementation [10, 11, 15, 21 – 23].”
MethodResultA Survey of Stimulation Methods Used in SSVEP-Based BCIs
Zhu, D., Bieger, J., Garcia Molina, G., & Aarts, R. M. (2010) · Computational Intelligence and Neuroscience · doi:10.1155/2010/702357 · Cited by 654 · cited 1×
“Although the number of frequencies that can be presented on a computer monitor is limited by the refresh rate, recent progresses of the stimulus presentation meth-ods succeeded in presenting a large number of visual flickers on the computer monitor [6 – 11].”
BackgroundA practical VEP-based brain-computer interface
Wang, Y., Wang, R., Gao, X., Hong, B., & Gao, S. (2006) · IEEE Transactions on Neural Systems and Rehabilitation Engineering · doi:10.1109/tnsre.2006.875576 · Cited by 617
Self-citationMultiple Channel Detection of Steady-State Visual Evoked Potentials for Brain-Computer Interfaces
Friman, O., Volosyak, I., & Graser, A. (2007) · IEEE Transactions on Biomedical Engineering · doi:10.1109/tbme.2006.889160 · Cited by 541 · cited 1×
“The widely used spatial filtering methods in SSVEP-based BCIs include canonical correlation analysis (CCA) [15], minimum energy combination (MEC) [16], and common spatial pattern (CSP) [17].”
MethodVisual and Auditory Brain–Computer Interfaces
Gao, S., Wang, Y., Gao, X., & Hong, B. (2014) · IEEE Transactions on Biomedical Engineering · doi:10.1109/tbme.2014.2300164 · Cited by 449 · cited 2×
“Various target identification methods have been developed for detecting SSVEPs in BCIs [2 – 4].”
BackgroundMethodSelf-citation
Research works printed but not linked: 3
- W Nan, 2011, Proc 5th Int IEEE EMBS Neural Eng Conf, 469
- RMG Tello, 2014, Proc 5th ISSNIP-IEEE Biosig Biorobot Conf Biosig and Robot Better Safer Living, 1
- Y Wang, 2014, Proc 36th Ann Int Conf IEEE Eng Med Biol Soc, 3037
Cited by
Enhancing Detection of SSVEPs for a High-Speed Brain Speller Using Task-Related Component Analysis
Nakanishi, M., Wang, Y., Chen, X., Wang, Y.-T., Gao, X., & Jung, T.-P. (2018) · IEEE Transactions on Biomedical Engineering · doi:10.1109/tbme.2017.2694818 · Cited by 813
“1) Extended CCA-Based Method: Our recent studies proposed an extended CCA-based method, which incorporated individual template signals obtained by averaging multiple training trials as χ̄njk = 1 Nt ∑Nt h=1 χnjkh [4], [9], [18], [19].”
MethodSelf-citationWaytowich, N., Lawhern, V. J., Garcia, J. O., Cummings, J., Faller, J., Sajda, P., & Vettel, J. M. (2018) · Journal of Neural Engineering · doi:10.1088/1741-2552/aae5d8 · Cited by 262
“Here, our division of the 4 s SSVEP trial epoch into 1 s segments simulates an asynchronous SSVEP BCI from a discretized stimulation paradigm.”
MethodInfluentialBETA: A Large Benchmark Database Toward SSVEP-BCI Application
Liu, B., Huang, X., Wang, Y., Chen, X., & Gao, X. (2020) · Frontiers in Neuroscience · doi:10.3389/fnins.2020.00627 · Cited by 209
“For all the methods without a filter bank scheme, the trials were band-pass filtered between 6 and 80 Hz except for the CVARS method, which was in line with the previous study (Nakanishi et al., 2015).”
MethodSelf-citationComparing user-dependent and user-independent training of CNN for SSVEP BCI
Ravi, A., Beni, N. H., Manuel, J., & Jiang, N. (2020) · Journal of Neural Engineering · doi:10.1088/1741-2552/ab6a67 · Cited by 165
“The proposed methods and other previously published methods were evaluated and compared on two datasets; a dataset acquired in our lab — Dataset 1 [33] and a public dataset — Dataset 2 [12].”
MethodInfluentialTo train or not to train? A survey on training of feature extraction methods for SSVEP-based BCIs
Zerafa, R., Camilleri, T., Falzon, O., & Camilleri, K. P. (2018) · Journal of Neural Engineering · doi:10.1088/1741-2552/aaca6e · Cited by 160
“…× n is the n -mode tensor product. in The optimization problem (31) is solved by iterations of alternating CCAs so that W 1 , W 3 and V satisfy the stop criterion, || W ( l ) − W ( l − 1 ) 2 < 10 − 5 , where l denotes the number of iteration steps and W is the weight coefficient to be learned [16].”
BackgroundMethodInfluential
Metadata
- Authors
- Nakanishi, M., Wang, Y., Wang, Y.-T., & Jung, T.-P.
- Affiliations
- University of California San Diego (US)
- Chinese Academy of Sciences (CN)
- Corresponding author
- Wang, Yijun
- Venue
- PLoS ONE
- Publisher
- Public Library of Science (PLoS)
- Published
- 2015-10-19
- Volume
- 10
- Issue
- 10
- Pages
- e0140703
- ISSN
- 1932-6203 (ISSN-L)
- PMC
- PMC4610694
- OpenAlex
- W2338492816
- Cited by
- 376
- References
- 36
- Citations by year
- 2026: 16 · 2025: 50 · 2024: 51 · 2023: 46 · 2022: 43 · 2021: 37 · 2020: 41 · 2019: 38 · 2018: 23 · 2017: 21 · 2016: 9
- FWCI
- 10.63
- Type
- journal article
- Language
- en
- Open access
- gold
- doi.org
- Licence
- Locations
- PLoS ONE (publishedVersion, cc-by)
- Europe PMC (PubMed Central) (publishedVersion, cc-by)
- PubMed Central (publishedVersion, cc-by)
- PubMed (publishedVersion)
- RePEc: Research Papers in Economics (submittedVersion)
- DOAJ (DOAJ: Directory of Open Access Journals) (submittedVersion)
- eScholarship (California Digital Library) (submittedVersion)
- eScholarship (California Digital Library) (submittedVersion, cc-by)
- SEMI-IR (submittedVersion)
- Funders
- Recruitment Program for Young Professionals
- National Institutes of Health (W911NF-10-2-0022)
- Defense Advanced Research Projects Agency (W911NF-10-2-0022, USDI D11PC20183)
- Office of Naval Research (W911NF-10-2-0022, N00014-08-1215, N00014)
- National Eye Institute (R21EY025056)
- Army Research Office (W911NF-10-2-0022, W911NF-09-1-0510, W911NF)
- Army Research Laboratory (W911-NF-10-2-0022, W911NF, W911NF-10)
- Topics
- Life Sciences › Neuroscience › Cognitive Neuroscience › EEG and Brain-Computer Interfaces
- Physical Sciences › Computer Science › Human-Computer Interaction › Gaze Tracking and Assistive Technology
- Physical Sciences › Computer Science › Artificial Intelligence › Emotion and Mood Recognition
- Keywords
- steady-state visual evoked potentials, canonical correlation analysis, SSVEP detection, brain-computer interface, information transfer rate, classification accuracy
- MeSH terms
- Adult, Electroencephalography, Evoked Potentials, Visual, Female, Humans, Male, Statistics as Topic, Brain-Computer Interfaces
About these checks
Registry, retraction, Cites and statistics results are computed, not judged, with one exception: a printed reference that no index lists is read once by a model before it counts as a citation error. Claims are extracted by a model and kept only when their quote appears verbatim in the text; each cited source is then checked, with a model’s help, for whether it says what the claim relies on. Those verdicts can be wrong — read the claim’s quote and the cited source before relying on one.
Statistics and arithmetic are recomputed, not judged.
Confidence bands are shown only for fields calibrated on our annotated test set. None is calibrated yet, so no band is shown.
What counts as a claim ›How we measure confidence ›How we check this ›
Are you an author, or do you see a problem with this page? Request a review
How to cite
Cite CoChat for the checks on this page, and the paper for its own findings.
- This page
- CoChat. (2026). Citation check: A Comparison Study of Canonical Correlation Analysis Based Methods for Detecting Steady-State Visual Evoked Potentials. https://app.cochat.ai/papers/10.1371/journal.pone.0140703
- The paper
- Nakanishi, M., Wang, Y., Wang, Y.-T., & Jung, T.-P. (2015). A Comparison Study of Canonical Correlation Analysis Based Methods for Detecting Steady-State Visual Evoked Potentials. PLoS ONE. https://doi.org/10.1371/journal.pone.0140703
Data sources
Bibliographic data: Semantic Scholar, OpenAlex, Crossref.
Contains information from the Semantic Scholar Academic Graph Datasets, made available under the ODC Attribution License (ODC-BY 1.0).
Semantic Scholar’s data is described in: Kinney, R., et al. (2023). The Semantic Scholar Open Data Platform. arXiv:2301.10140.
