

The DOI matches its Crossref record; 78 of the 79 references it cites were found in a registry or an index.
Analytical and Clinical Validation of a Digital Sequencing Panel for Quantitative, Highly Accurate Evaluation of Cell-Free Circulating Tumor DNA
Open accessAbstract
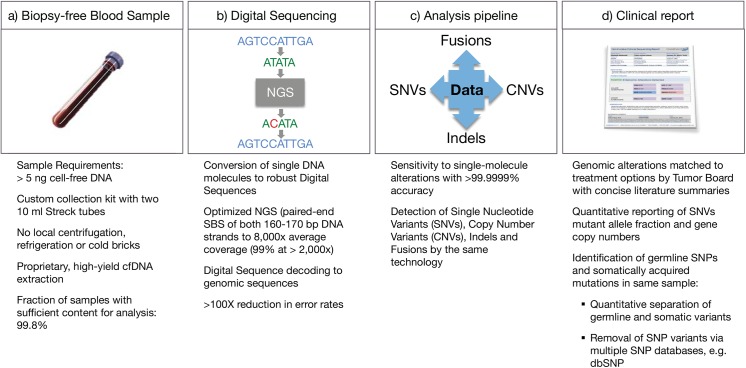
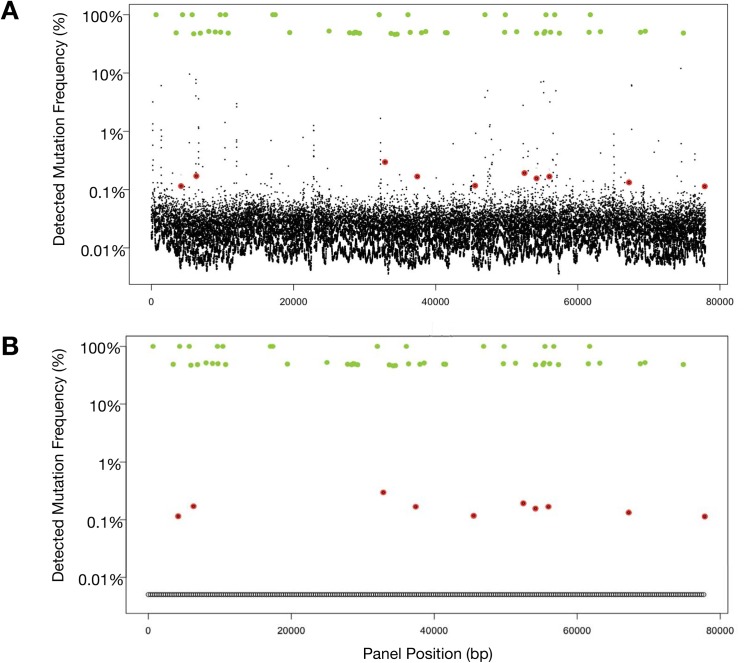
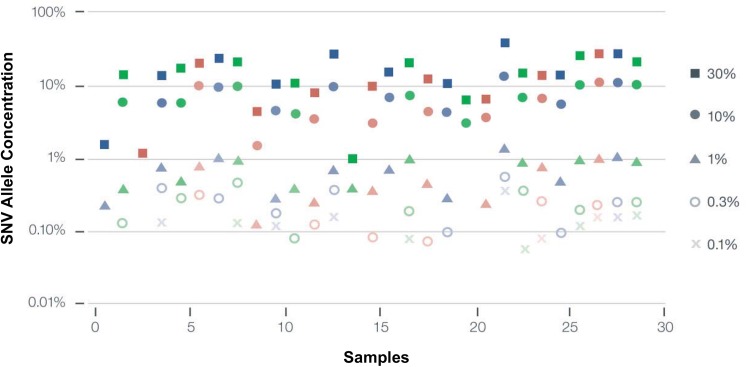
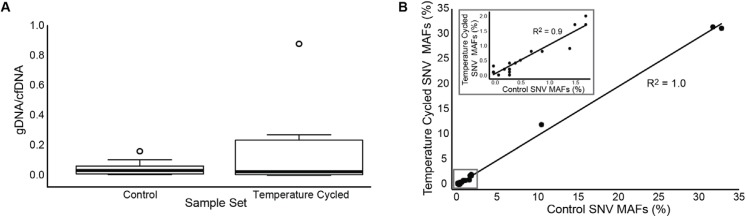
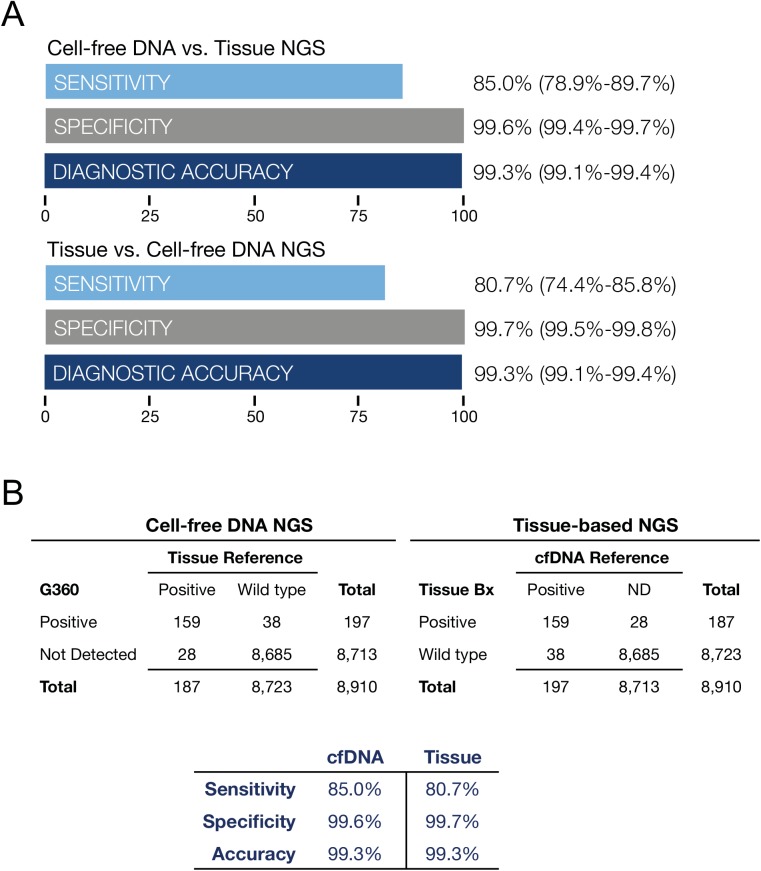
Next-generation sequencing of cell-free circulating solid tumor DNA addresses two challenges in contemporary cancer care. First this method of massively parallel and deep sequencing enables assessment of a comprehensive panel of genomic targets from a single sample, and second, it obviates the need for repeat invasive tissue biopsies. Digital Sequencing™ is a novel method for high-quality sequencing of circulating tumor DNA simultaneously across a comprehensive panel of over 50 cancer-related genes with a simple blood test. Here we report the analytic and clinical validation of the gene panel. Analytic sensitivity down to 0.1% mutant allele fraction is demonstrated via serial dilution studies of known samples. Near-perfect analytic specificity (> 99.9999%) enables complete coverage of many genes without the false positives typically seen with traditional sequencing assays at mutant allele frequencies or fractions below 5%. We compared digital sequencing of plasma-derived cell-free DNA to tissue-based sequencing on 165 consecutive matched samples from five outside centers in patients with stage III-IV solid tumor cancers. Clinical sensitivity of plasma-derived NGS was 85.0%, comparable to 80.7% sensitivity for tissue. The assay success rate on 1,000 consecutive samples in clinical practice was 99.8%. Digital sequencing of plasma-derived DNA is indicated in advanced cancer patients to prevent repeated invasive biopsies when the initial biopsy is inadequate, unobtainable for genomic testing, or uninformative, or when the patient's cancer has progressed despite treatment. Its clinical utility is derived from reduction in the costs, complications and delays associated with invasive tissue biopsies for genomic testing.
Overview
The claims and statistics of this paper haven’t been checked yet.
Run the check — free, no account needed. It reads the open-access text and checks the sources it cites.
Integrity signals
Registry
Cites
Statistics
Figures
Verification
Claims the paper makes
The claims and statistics of this paper haven’t been checked yet.
Run the check — free, no account needed. It reads the open-access text and checks the sources it cites.
Claims other papers make about this one
Each is checked against this paper’s own text: does it say what the citing paper says it does?
In the citing paper
“Moreover, ctDNA is readily detectable in lung cancer patient blood (20, 27, 29, 30), and sensitivity of variant detection was recently shown to be higher in ctDNA than CTCs (25).”
Self-check
Percentages, sums and reported differences re-computed from the paper’s own numbers.
The self-check needs the paper’s full text.
Citations
Cites
Initial sequencing and analysis of the human genome
International Human Genome Sequencing Consortium, Whitehead Institute for Biomedical Research, C. F. G. R., Lander, E. S., Linton, L. M., Birren, B., Nusbaum, C., Zody, M. C., Baldwin, J., Devon, K., Dewar, K., et al. (2001) · Nature · doi:10.1038/35057062 · Cited by 24,216
Intratumor Heterogeneity and Branched Evolution Revealed by Multiregion Sequencing
Gerlinger, M., Rowan, A. J., Horswell, S., Larkin, J., Endesfelder, D., Gronroos, E., Martinez, P., Matthews, N., Stewart, A., Tarpey, P., et al. (2012) · New England Journal of Medicine · doi:10.1056/nejmoa1113205 · Cited by 7,774 · cited 1×
“different biopsies of the two tumors each typically missed one-third of the nonsynonymous somatic mutations found elsewhere in the tumor despite sequencing to 250-fold coverage [13].”
BackgroundNowell, P. C. (1976) · Science · doi:10.1126/science.959840 · Cited by 6,471 · cited 1×
“Peter Nowell posited almost 40 years ago that “each patient's cancer may require individual specific therapy, and even this may be thwarted by emergence of a genetically variant subline [subclone] resistant to the treatment” [62].”
BackgroundDetection of Circulating Tumor DNA in Early- and Late-Stage Human Malignancies
Bettegowda, C., Sausen, M., Leary, R. J., Kinde, I., Wang, Y., Agrawal, N., Bartlett, B. R., Wang, H., Luber, B., Alani, R. M., et al. (2014) · Science Translational Medicine · doi:10.1126/scitranslmed.3007094 · Cited by 5,067
Glucocorticoid-induced thymocyte apoptosis is associated with endogenous endonuclease activation
Wyllie, A. H. (1980) · Nature · doi:10.1038/284555a0 · Cited by 4,495 · cited 1×
“Cell-free circulating tumor DNA consists mainly of 166 base pair double-stranded DNA fragments resulting from apoptosis, necrosis or release of nuclear DNA into the circulation [18,19].”
BackgroundAccurate whole human genome sequencing using reversible terminator chemistry
Bentley, D. R., Balasubramanian, S., Swerdlow, H. P., Smith, G. P., Milton, J., Brown, C. G., Hall, K. P., Evers, D. J., Barnes, C. L., Bignell, H. R., et al. (2008) · Nature · doi:10.1038/nature07517 · Cited by 3,684 · cited 2×
“The 165 matched plasma and tissue samples were both analyzed on the Illumina Hi-Seq 2500 platform, the cfDNA analyzed using the digital sequencing method described herein and the DNA isolated from tissue samples analyzed using standard prep as per the manufacturer’s instructions [76].”
MethodA collection of breast cancer cell lines for the study of functionally distinct cancer subtypes
Neve, R. M., Chin, K., Fridlyand, J., Yeh, J., Baehner, F. L., Fevr, T., Clark, L., Bayani, N., Coppé, J., Tong, F. K., et al. (2006) · Cancer Cell · doi:10.1016/j.ccr.2006.10.008 · Cited by 3,224
Towards complete and accurate reporting of studies of diagnostic accuracy: The STARD Initiative.
Bossuyt, P. M., Reitsma, J. B., Bruns, D. E., Gatsonis, C. A., Glasziou, P. P., Irwig, L. M., Lijmer, J. G., Moher, D., Rennie, D., de Vet, H. C. W., et al. (2003) · Annals of Internal Medicine · doi:10.7326/0003-4819-138-1-200301070-00010 · Cited by 3,219
Towards complete and accurate reporting of studies of diagnostic accuracy: the STARD initiative
Bossuyt, P. M., Reitsma, J. B., Bruns, D. E., Gatsonis, C. A., Glasziou, P. P., Irwig, L. M., Lijmer, J. G., Moher, D., Rennie, D., & de Vet, H. C. W. (2003) · BMJ · doi:10.1136/bmj.326.7379.41 · Cited by 3,215
Cell-free nucleic acids as biomarkers in cancer patients
Schwarzenbach, H., Hoon, D. S. �., & Pantel, K. (2011) · Nature reviews. Cancer · doi:10.1038/nrc3066 · Cited by 2,897
Research works printed but not linked: 5
- Rosen S. World Market for Cancer Diagnostics, 5th Edition. 2013.
- P Mandel, 1948, Les acides nucléiques du plasma sanguin chez l’homme, CR Acad Sci Paris, 142, 241
- AmirAli Talasaz, 2014, Non-invasive and sequential profiling of metastatic solid tumors by Digital Sequencing of cell-free DNA [Abstract 3422S], Am Soc Hum Genet Annu Meet
- A Drilon, 2015, Broad, hybrid capture-based next-generation sequencing identifies actionable genomic alterations in “driver-negative” lung adenocarcinomas, Clin Cancer Res Off J Am Assoc Cancer Res
- Maryke Appel Victoria van Kets, 2014, Kapa Hyper Prep: A next-generation kit for fast and efficient library construction from challenging DNA samples. [Abstract], Adv Genome Biol Technol
Cited by
Sorted by citations
Liquid biopsies come of age: Towards implementation of circulating tumour DNA
Wan, J. C. M., Massie, C., Garcia-Corbacho, J., Mouliere, F., Brenton, J. D., Caldas, C., Pacey, S., Baird, R., & Rosenfeld, N. (2017) · Nature Reviews Cancer · doi:10.1038/nrc.2017.7 · Cited by 2,809
Integrating liquid biopsies into the management of cancer
Siravegna, G., Marsoni, S., Siena, S., & Bardelli, A. (2017) · Nature Reviews Clinical Oncology · doi:10.1038/nrclinonc.2017.14 · Cited by 1,971
STK11/LKB1 Mutations and PD-1 Inhibitor Resistance in KRAS -Mutant Lung Adenocarcinoma
Skoulidis, F., Goldberg, M. E., Greenawalt, D. M., Hellmann, M. D., Awad, M. M., Gainor, J. F., Schrock, A. B., Hartmaier, R. J., Trabucco, S. E., Gay, L., et al. (2018) · Cancer Discovery · doi:10.1158/2159-8290.cd-18-0099 · Cited by 1,641
Kim, S. T., Cristescu, R., Bass, A. J., Kim, K., Odegaard, J. I., Kim, K., Liu, X. Q., Sher, X., Jung, H., Lee, M.-J., et al. (2018) · Nature Medicine · doi:10.1038/s41591-018-0101-z · Cited by 1,680
Direct detection of early-stage cancers using circulating tumor DNA
Phallen, J. A., Sausen, M., Adleff, V., Leal, A., Hruban, C., White, J. R., Anagnostou, V., Fiksel, J., Cristiano, S., Papp, E., et al. (2017) · Science Translational Medicine · doi:10.1126/scitranslmed.aan2415 · Cited by 1,149
“(11-105240), the Danish Council for Strategic Research (1309-00006B), the Novo Nordisk”
Background
Metadata
- Authors
- Lanman, R. B., Mortimer, S. A., Zill, O. A., Sebisanovic, D., Lopez, R., Blau, S., Collisson, E. A., Divers, S. G., Hoon, D. S. B., Kopetz, E. S., Lee, J., Nikolinakos, P. G., Baca, A. M., Kermani, B. G., Eltoukhy, H., & Talasaz, A.
- Affiliations
- Guardant (United States) (US)
- Northwest Medical Specialties (US)
- University of California, San Francisco (US)
- Saint John's Health Center (US)
- Samsung Medical Center (KR)
- University Cancer and Blood Center (US)
- Corresponding author
- Lanman, Richard B.
- Talasaz, AmirAli
- ORCID
- Venue
- PLoS ONE
- Publisher
- Public Library of Science (PLoS)
- Published
- 2015-10-16
- Volume
- 10
- Issue
- 10
- Pages
- e0140712
- ISSN
- 1932-6203 (ISSN-L)
- PMC
- PMC4608804
- OpenAlex
- W1864344361
- Cited by
- 695
- References
- 79
- Citations by year
- 2026: 24 · 2025: 46 · 2024: 40 · 2023: 66 · 2022: 57 · 2021: 60 · 2020: 82 · 2019: 92 · 2018: 102 · 2017: 91 · 2016: 31 · 2015: 3
- FWCI
- 25.02
- Type
- journal article
- Language
- en
- Open access
- gold
- doi.org
- Licence
- Locations
- PLoS ONE (publishedVersion, cc-by)
- Europe PMC (PubMed Central) (publishedVersion, cc-by)
- PubMed Central (publishedVersion, cc-by)
- PubMed (publishedVersion)
- DOAJ (DOAJ: Directory of Open Access Journals) (submittedVersion, cc-by-sa)
- eScholarship (California Digital Library) (submittedVersion, cc-by)
- Figshare (submittedVersion, cc-by)
- Funders
- National Cancer Institute (P30CA016672)
- Topics
- Life Sciences › Biochemistry, Genetics and Molecular Biology › Cancer Research › Cancer Genomics and Diagnostics
- Health Sciences › Medicine › Pediatrics, Perinatology and Child Health › Prenatal Screening and Diagnostics
- Life Sciences › Biochemistry, Genetics and Molecular Biology › Genetics › BRCA gene mutations in cancer
- Keywords
- circulating tumor DNA, cell-free DNA, liquid biopsy, cancer gene panel, clinical validation, mutant allele fraction, solid tumors, biopsy alternative
- MeSH terms
- DNA, Neoplasm, Female, Humans, Male, Neoplasms, High-Throughput Nucleotide Sequencing
About these checks
Registry, retraction, Cites and statistics results are computed, not judged, with one exception: a printed reference that no index lists is read once by a model before it counts as a citation error. Claims are extracted by a model and kept only when their quote appears verbatim in the text; each cited source is then checked, with a model’s help, for whether it says what the claim relies on. Those verdicts can be wrong — read the claim’s quote and the cited source before relying on one.
Statistics and arithmetic are recomputed, not judged.
Confidence bands are shown only for fields calibrated on our annotated test set. None is calibrated yet, so no band is shown.
What counts as a claim ›How we measure confidence ›How we check this ›
Are you an author, or do you see a problem with this page? Request a review
