

The DOI matches its Crossref record; 42 of the 43 references it cites were found in a registry or an index.
Hypothetical Outcome Plots Outperform Error Bars and Violin Plots for Inferences about Reliability of Variable Ordering
Open accessAbstract
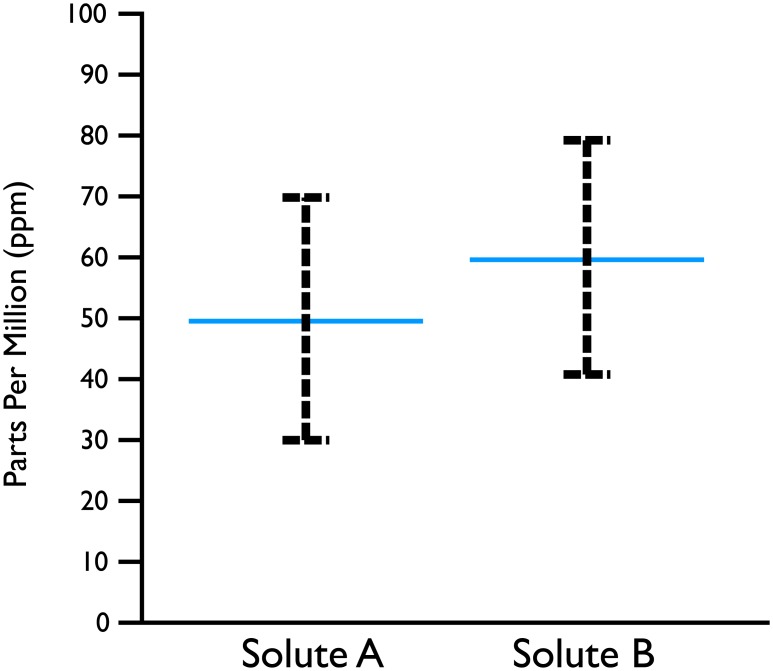
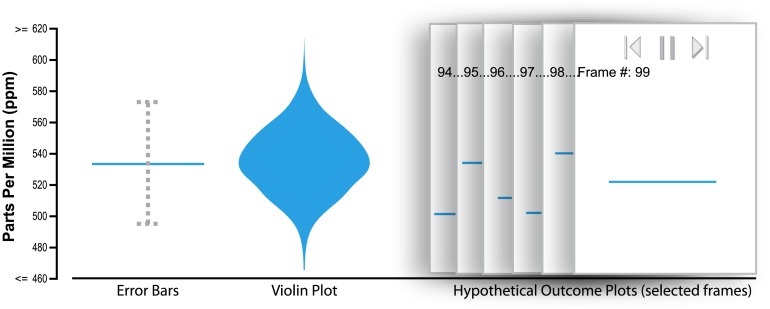
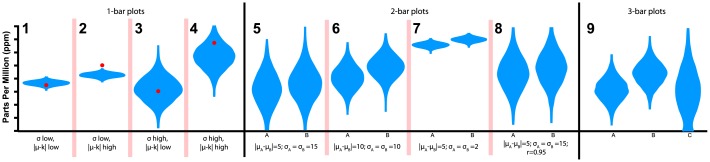
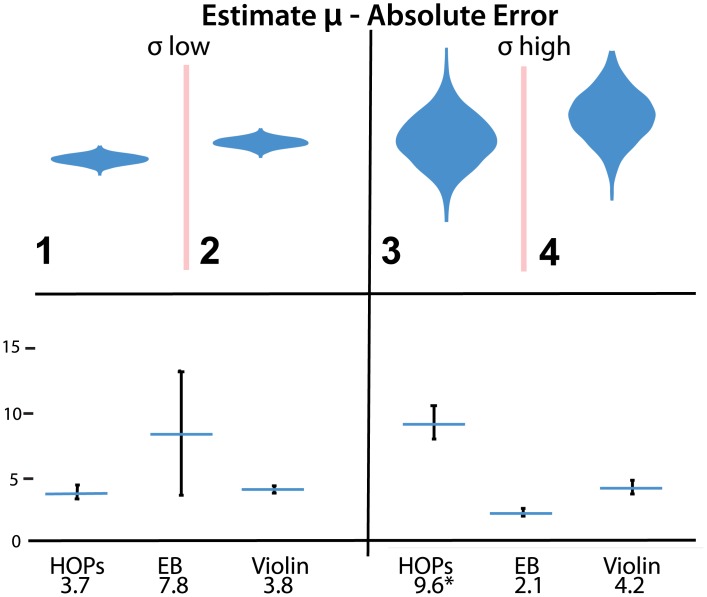
Many visual depictions of probability distributions, such as error bars, are difficult for users to accurately interpret. We present and study an alternative representation, Hypothetical Outcome Plots (HOPs), that animates a finite set of individual draws. In contrast to the statistical background required to interpret many static representations of distributions, HOPs require relatively little background knowledge to interpret. Instead, HOPs enables viewers to infer properties of the distribution using mental processes like counting and integration. We conducted an experiment comparing HOPs to error bars and violin plots. With HOPs, people made much more accurate judgments about plots of two and three quantities. Accuracy was similar with all three representations for most questions about distributions of a single quantity.
Overview
The claims and statistics of this paper haven’t been checked yet.
Run the check — free, no account needed. It reads the open-access text and checks the sources it cites.
Integrity signals
Registry
Cites
Statistics
Figures
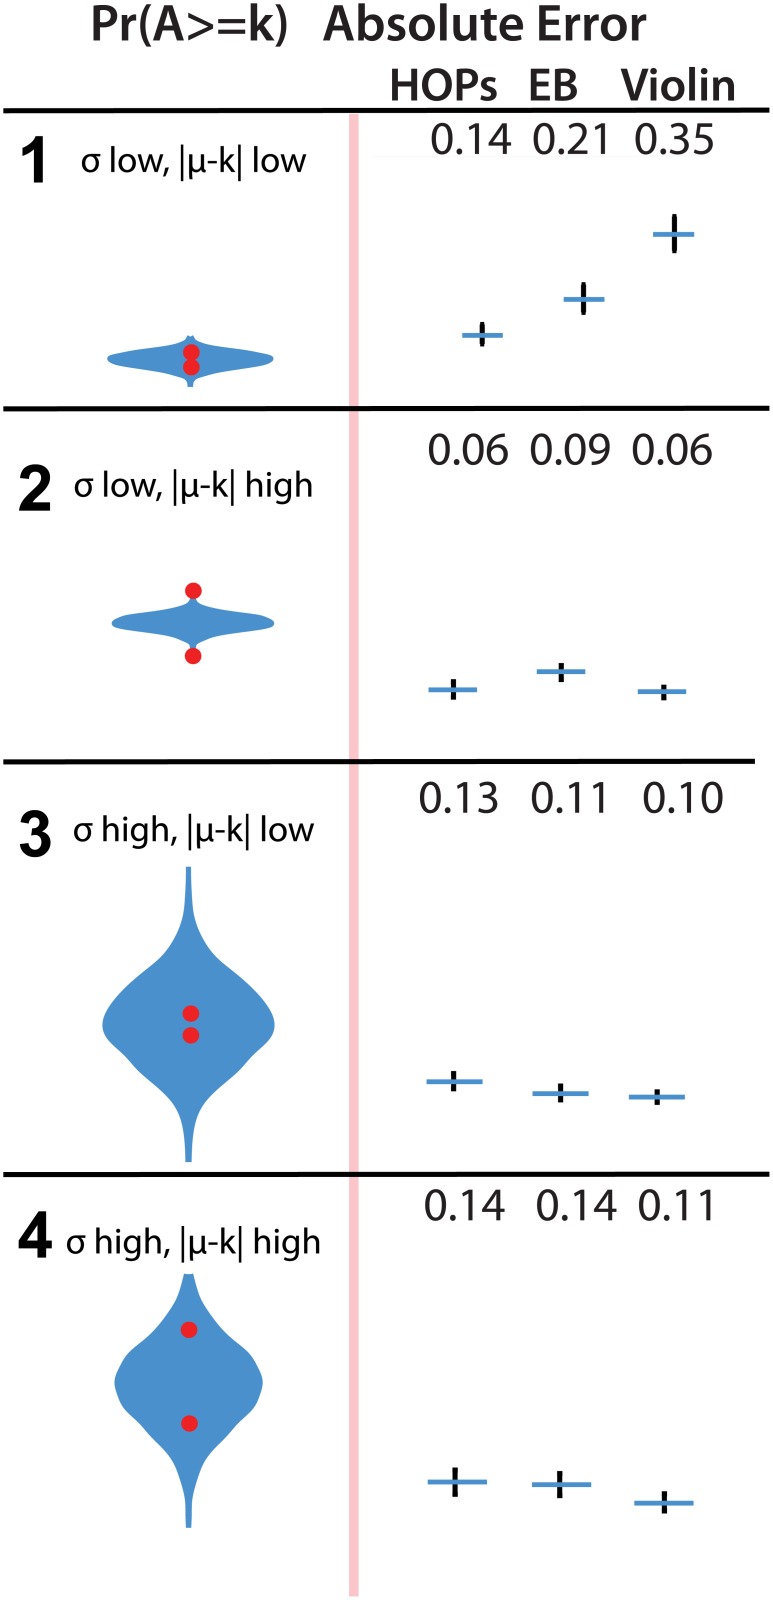
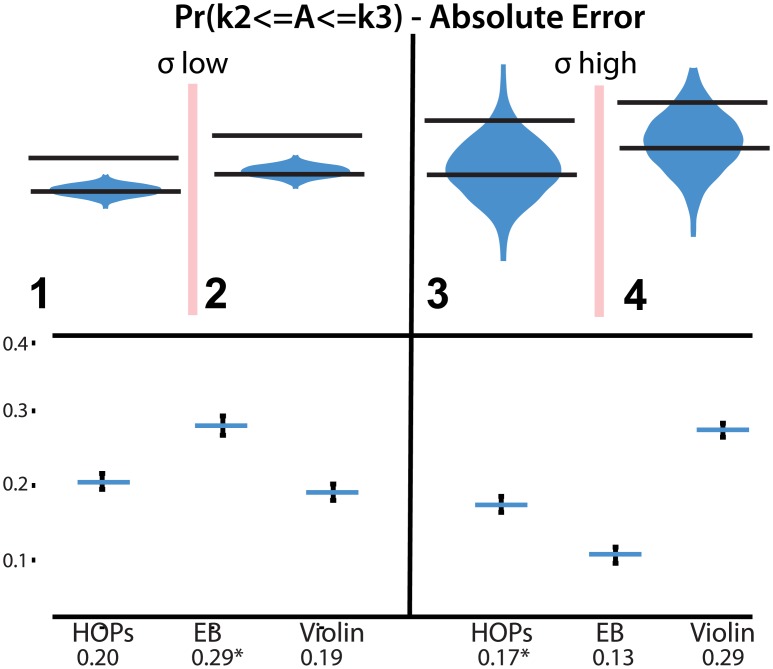
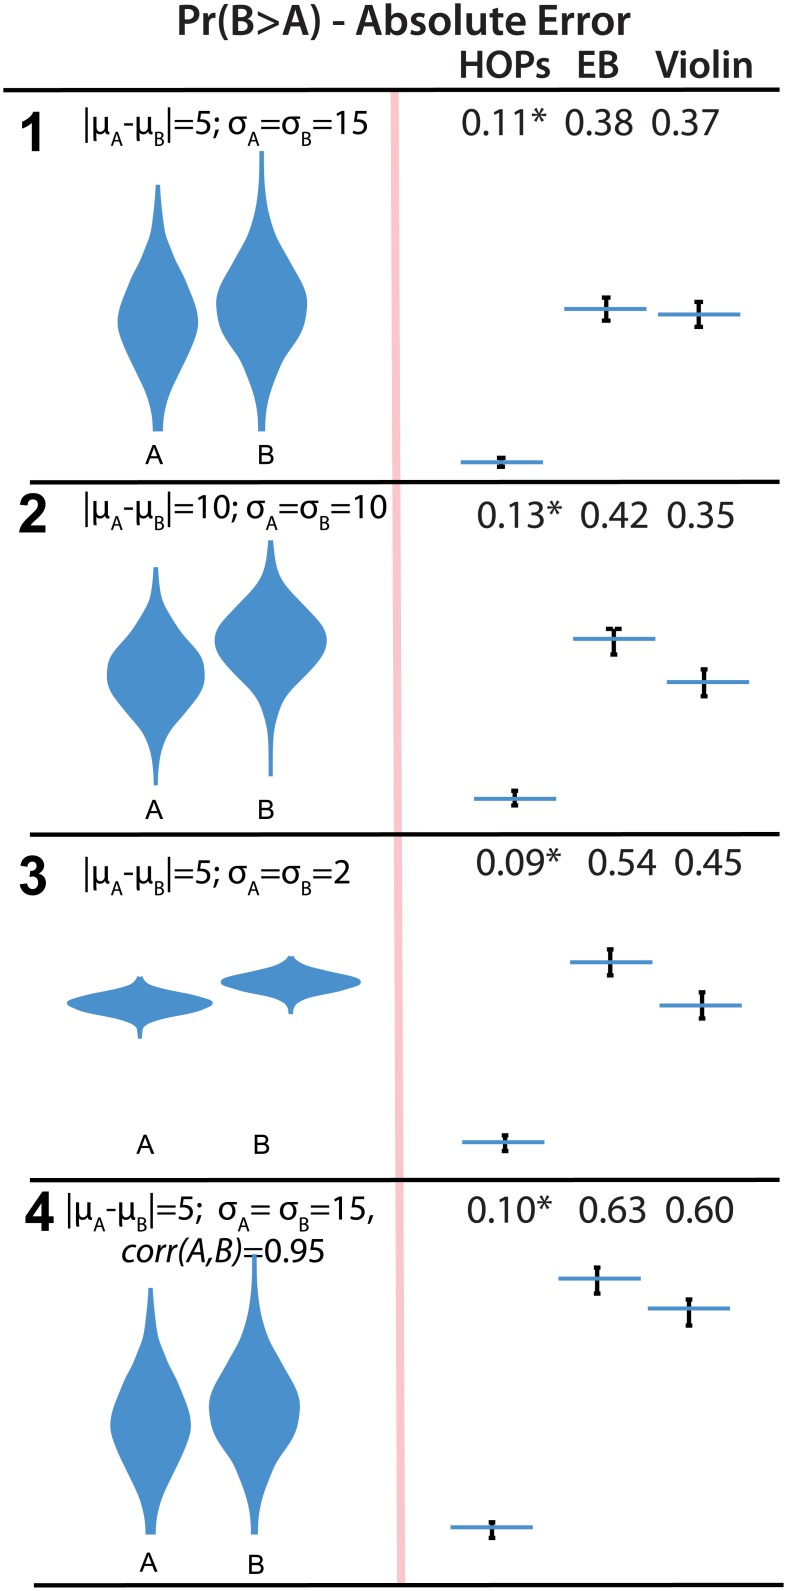
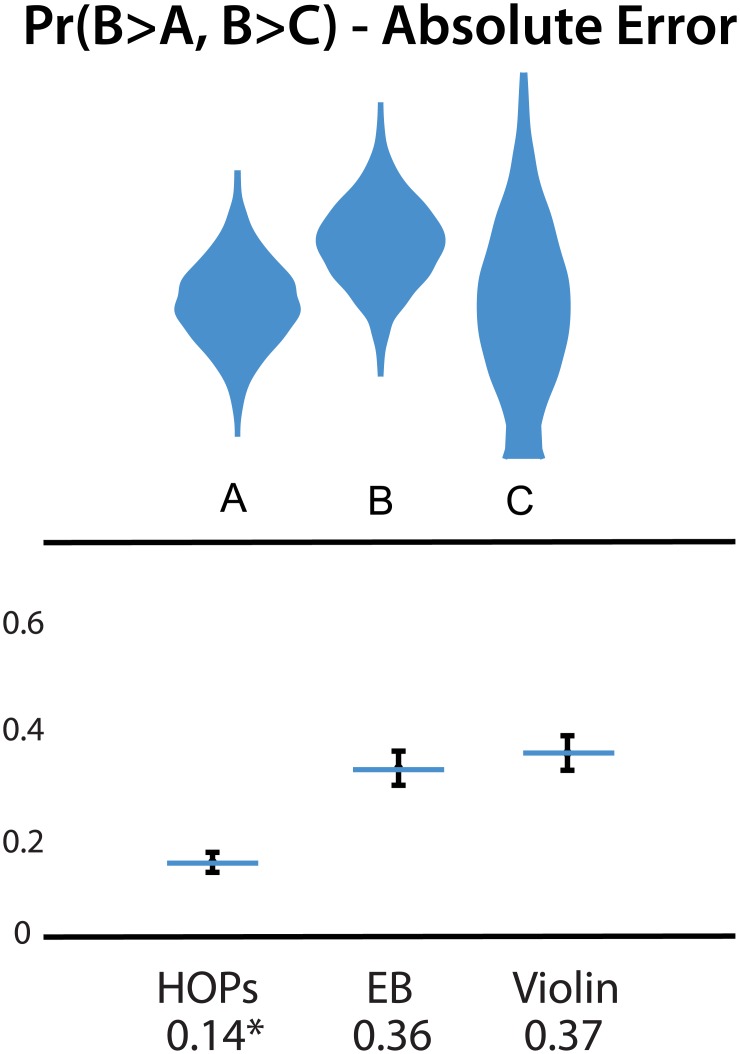
Verification
Claims the paper makes
The claims and statistics of this paper haven’t been checked yet.
Run the check — free, no account needed. It reads the open-access text and checks the sources it cites.
Claims other papers make about this one
Each is checked against this paper’s own text: does it say what the citing paper says it does?
The source backs part of the claim, not all of it — or backs it for a different population, condition or comparison.
In the citing paper
“While studies generally demonstrate a positive influence of visualizations on the user’s interpretation of uncertainty, the literature on uncertainty communication so far shows that what “works” is highly dependent on (a) the type of uncertainty being depicted; (b) the type of judgment users need to make; and (c) characteristics of the user (Hullman et al., 2015; Levontin et al., 2020).”
From Visualizing Uncertainty to Promote Clinicians’ Understanding of Measurement Error (2023) · cites this paper as Hullman et al., 2015
Experimental — accuracy not yet measuredThe cited source says what the claim attributes to it.
In the citing paper
“Hullman et al. [56] show that this visualization enabled people to make more accurate comparisons of two or three random variables than error bars and violin plots”
From Uncertainty as a Form of Transparency: Measuring, Communicating, and Using Uncertainty (2021) · cites this paper as [56]
The cited source says what the claim attributes to it.
In the citing paper
“One very different approach to conveying uncertainty is to individually show random draws from the probability distribution as a series of animation frames called hypothetical outcome plots (HOP) [56].”
From Uncertainty as a Form of Transparency: Measuring, Communicating, and Using Uncertainty (2021) · cites this paper as [56]
Self-check
Percentages, sums and reported differences re-computed from the paper’s own numbers.
The self-check needs the paper’s full text.
Citations
Cites
Bootstrap Methods and their Application
Davison, A. C., & Hinkley, D. V. (1997) · doi:10.1017/cbo9780511802843 · Cited by 7,350
Bootstrap Methods and Their Application
Loughin, T. M., Davison, A. C., & HINKLEY, D. V. (1999) · Journal of the American Statistical Association · doi:10.2307/2669707 · Cited by 5,478
Bostock, M., Ogievetsky, V., & Heer, J. (2011) · IEEE Transactions on Visualization and Computer Graphics · doi:10.1109/tvcg.2011.185 · Cited by 3,165
Guidelines for evaluating and expressing the uncertainty of NIST measurement results
Taylor, B. N. (1994) · National Institute of Standards and Technology, NIST Technical Note 1297 · doi:10.6028/nist.tn.1297 · Cited by 2,833
Guidelines for evaluating and expressing the uncertainty of NIST measurement results
Taylor, B. N., & Kuyatt, C. E. (2018) · doi:10.6028/nist.tn.1297-1993 · Cited by 2,582
How to improve Bayesian reasoning without instruction: Frequency formats.
Gigerenzer, G., & Hoffrage, U. (1995) · Psychological Review · doi:10.1037/0033-295x.102.4.684 · Cited by 2,190
(2011) · Cited by 2,025
Violin Plots: A Box Plot-Density Trace Synergism
Hintze, J. L., & Nelson, R. D. (1998) · The American Statistician · doi:10.1080/00031305.1998.10480559 · Cited by 1,802
Automating the design of graphical presentations of relational information
Mackinlay, J. D. (1986) · ACM Transactions on Graphics · doi:10.1145/22949.22950 · Cited by 1,631
Inference by Eye: Confidence Intervals and How to Read Pictures of Data.
Cumming, G., & Finch, S. (2005) · American Psychologist · doi:10.1037/0003-066x.60.2.170 · Cited by 1,449 · cited 1×
“For example, 92 error bars representing confidence intervals can be superimposed on bar charts [12].”
Background
Cited by
Sorted by citations
D'Ignazio, C., & Klein, L. F. (2020) · doi:10.7551/mitpress/11805.001.0001 · Cited by 1,738
The Science of Visual Data Communication: What Works
Franconeri, S., Padilla, L. M. K., Shah, P., Zacks, J. M., & Hullman, J. (2021) · Psychological Science in the Public Interest · doi:10.1177/15291006211051956 · Cited by 394
Self-citationKay, M., Kola, T., Hullman, J. R., & Munson, S. A. (2016) · Proceedings of the 2016 CHI Conference on Human Factors in Computing Systems · doi:10.1145/2858036.2858558 · Cited by 239
Self-citationUncertainty as a Form of Transparency: Measuring, Communicating, and Using Uncertainty
Bhatt, U., Antorán, J., Zhang, Y., Liao, Q. V., Sattigeri, P., Fogliato, R., Melançon, G., Krishnan, R., Stanley, J., Tickoo, O., et al. (2021) · Proceedings of the 2021 AAAI/ACM Conference on AI, Ethics, and Society · doi:10.1145/3461702.3462571 · Cited by 300
Human factors in model interpretability: Industry practices, challenges, and needs
Hong, S. R., Hullman, J., & Bertini, E. (2020) · Proceedings of the ACM on Human-Computer Interaction · doi:10.1145/3392878 · Cited by 219
Self-citation
Metadata
- Authors
- Hullman, J., Resnick, P., & Adar, E.
- Affiliations
- University of Washington (US)
- University of Michigan (US)
- Corresponding author
- Hullman, Jessica
- Venue
- PLOS ONE
- Publisher
- Public Library of Science (PLoS)
- Published
- 2015-11-16
- Volume
- 10
- Issue
- 11
- Pages
- e0142444
- ISSN
- 1932-6203 (ISSN-L)
- PMC
- PMC4646698
- OpenAlex
- W2292312835
- Cited by
- 194
- References
- 43
- Citations by year
- 2026: 11 · 2025: 24 · 2024: 18 · 2023: 32 · 2022: 26 · 2021: 27 · 2020: 21 · 2019: 18 · 2018: 9 · 2017: 6 · 2016: 2
- FWCI
- 4.92
- Type
- journal article
- Language
- en
- Open access
- gold
- doi.org
- Licence
- Locations
- PLoS ONE (publishedVersion, cc-by)
- Europe PMC (PubMed Central) (publishedVersion, cc-by)
- PubMed Central (publishedVersion, cc-by)
- PubMed (publishedVersion)
- RePEc: Research Papers in Economics (submittedVersion)
- DOAJ (DOAJ: Directory of Open Access Journals) (submittedVersion, cc-by-sa)
- Figshare (submittedVersion, cc-by)
- Topics
- Physical Sciences › Computer Science › Computer Graphics and Computer-Aided Design › Data Visualization and Analytics
- Social Sciences › Psychology › Experimental and Cognitive Psychology › Visual and Cognitive Learning Processes
- Physical Sciences › Mathematics › Statistics and Probability › Statistics Education and Methodologies
- Keywords
- error bars, violin plots
- MeSH terms
- Data Interpretation, Statistical, Discrimination, Psychological, Humans, Probability, Reproducibility of Results, Models, Statistical, Normal Distribution
About these checks
Registry, retraction, Cites and statistics results are computed, not judged, with one exception: a printed reference that no index lists is read once by a model before it counts as a citation error. Claims are extracted by a model and kept only when their quote appears verbatim in the text; each cited source is then checked, with a model’s help, for whether it says what the claim relies on. Those verdicts can be wrong — read the claim’s quote and the cited source before relying on one.
Statistics and arithmetic are recomputed, not judged.
Confidence bands are shown only for fields calibrated on our annotated test set. None is calibrated yet, so no band is shown.
What counts as a claim ›How we measure confidence ›How we check this ›
Are you an author, or do you see a problem with this page? Request a review
