

The DOI matches its Crossref record; 42 of the 43 references it cites were found in a registry or an index.
Hypothetical Outcome Plots Outperform Error Bars and Violin Plots for Inferences about Reliability of Variable Ordering
Open accessAbstract
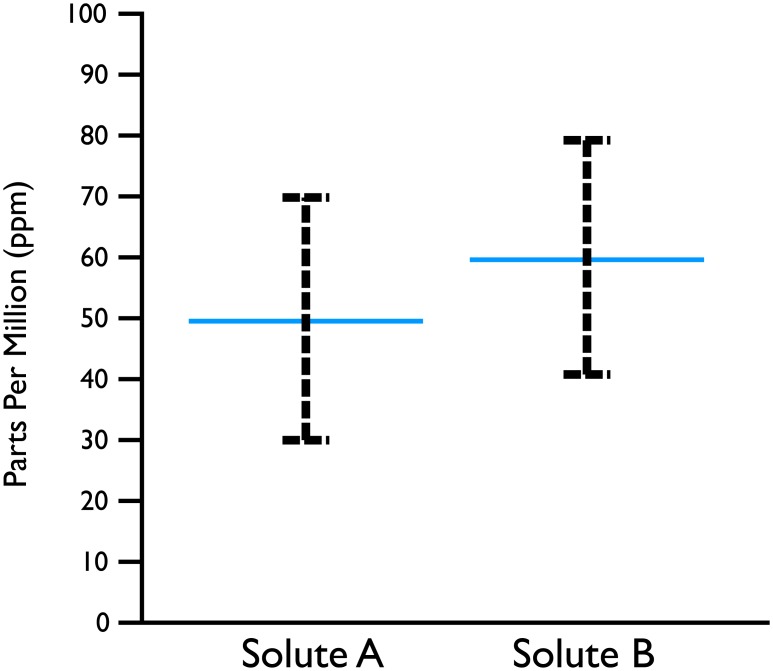
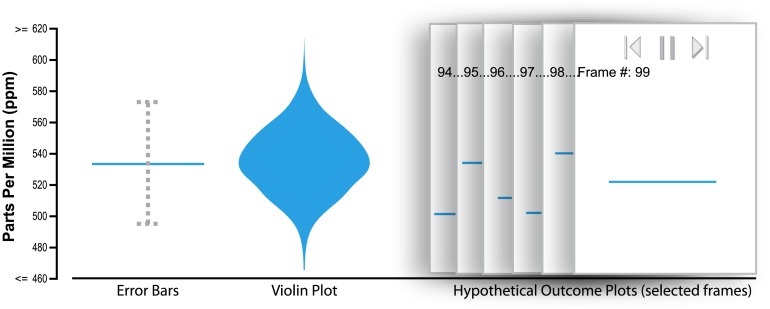
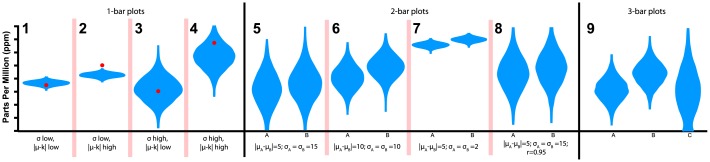
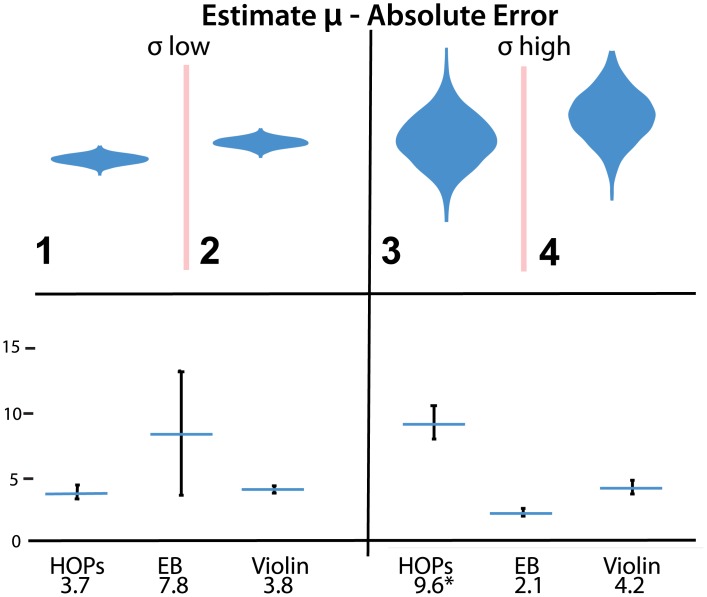
Many visual depictions of probability distributions, such as error bars, are difficult for users to accurately interpret. We present and study an alternative representation, Hypothetical Outcome Plots (HOPs), that animates a finite set of individual draws. In contrast to the statistical background required to interpret many static representations of distributions, HOPs require relatively little background knowledge to interpret. Instead, HOPs enables viewers to infer properties of the distribution using mental processes like counting and integration. We conducted an experiment comparing HOPs to error bars and violin plots. With HOPs, people made much more accurate judgments about plots of two and three quantities. Accuracy was similar with all three representations for most questions about distributions of a single quantity.
Overview
The claims and statistics of this paper haven’t been checked yet.
Run the check — free, no account needed. It reads the open-access text and checks the sources it cites.
Integrity signals
Registry
Cites
Statistics
Figures
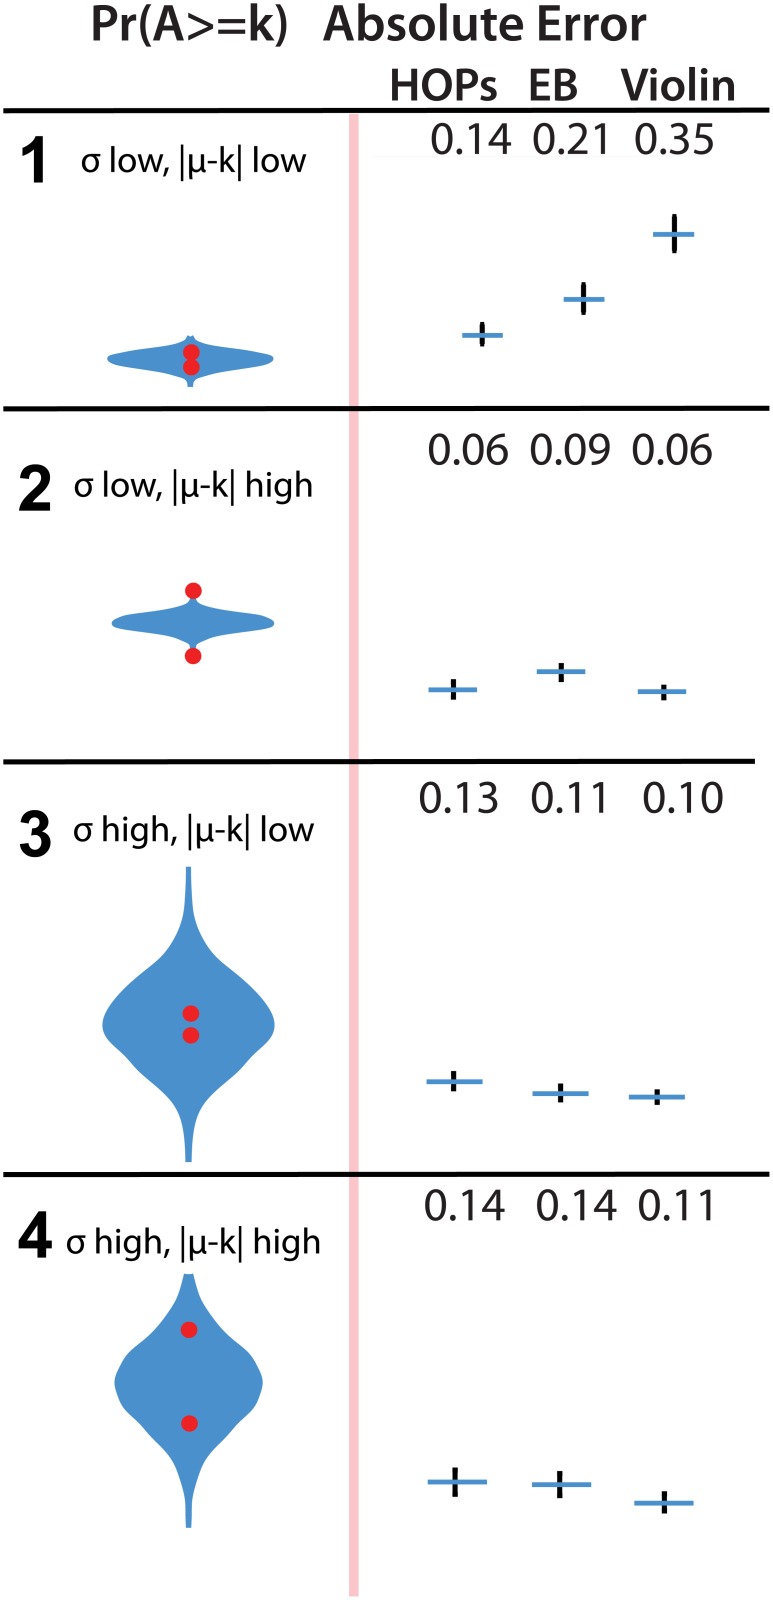
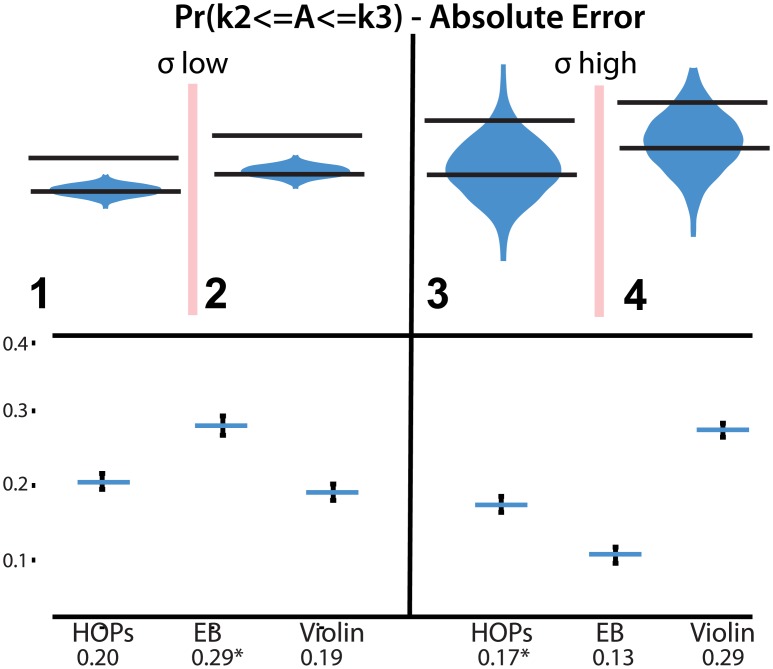
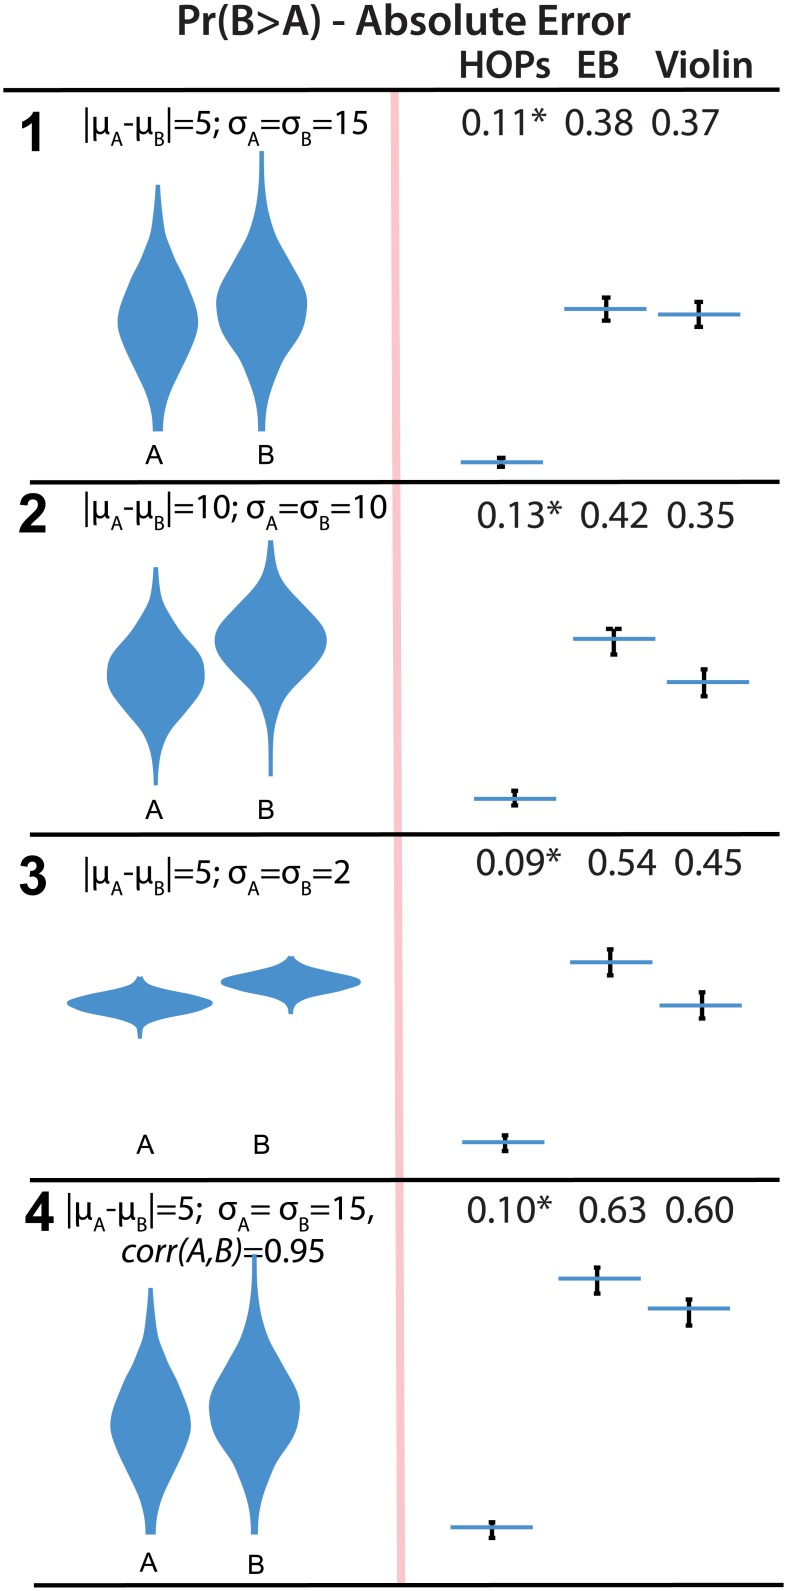
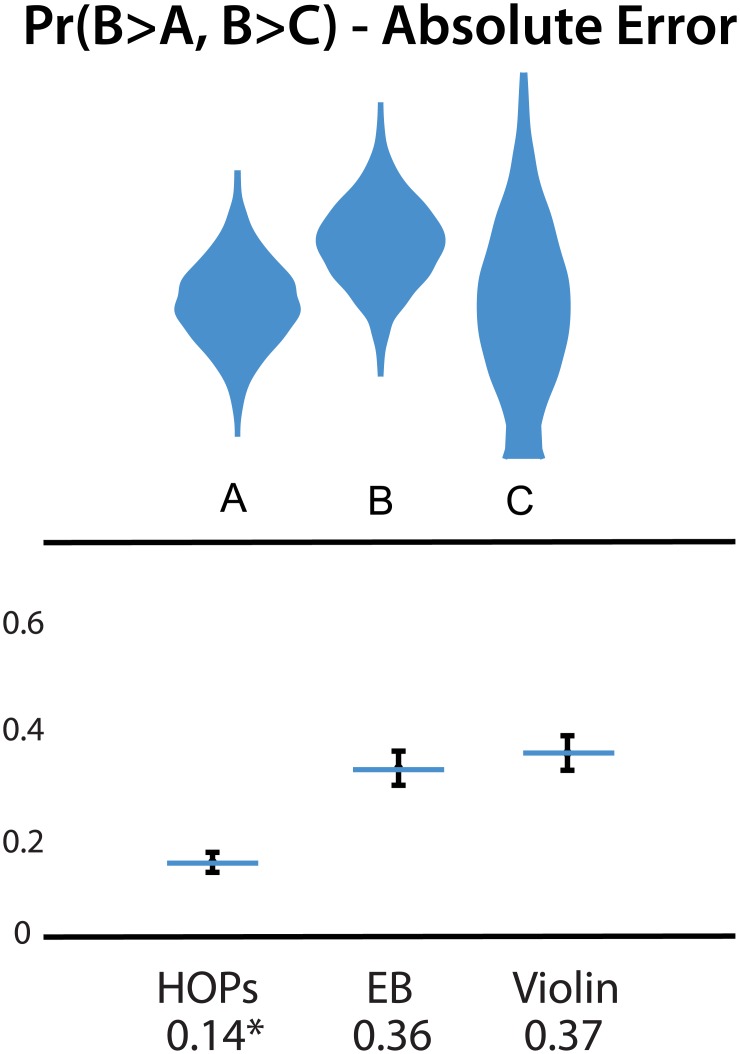
Verification
Claims the paper makes
The claims and statistics of this paper haven’t been checked yet.
Run the check — free, no account needed. It reads the open-access text and checks the sources it cites.
Claims other papers make about this one
Each is checked against this paper’s own text: does it say what the citing paper says it does?
The source backs part of the claim, not all of it — or backs it for a different population, condition or comparison.
In the citing paper
“While studies generally demonstrate a positive influence of visualizations on the user’s interpretation of uncertainty, the literature on uncertainty communication so far shows that what “works” is highly dependent on (a) the type of uncertainty being depicted; (b) the type of judgment users need to make; and (c) characteristics of the user (Hullman et al., 2015; Levontin et al., 2020).”
From Visualizing Uncertainty to Promote Clinicians’ Understanding of Measurement Error (2023) · cites this paper as Hullman et al., 2015
Experimental — accuracy not yet measuredThe cited source says what the claim attributes to it.
In the citing paper
“Hullman et al. [56] show that this visualization enabled people to make more accurate comparisons of two or three random variables than error bars and violin plots”
From Uncertainty as a Form of Transparency: Measuring, Communicating, and Using Uncertainty (2021) · cites this paper as [56]
The cited source says what the claim attributes to it.
In the citing paper
“One very different approach to conveying uncertainty is to individually show random draws from the probability distribution as a series of animation frames called hypothetical outcome plots (HOP) [56].”
From Uncertainty as a Form of Transparency: Measuring, Communicating, and Using Uncertainty (2021) · cites this paper as [56]
Self-check
Percentages, sums and reported differences re-computed from the paper’s own numbers.
The self-check needs the paper’s full text.
Citations
Cites
Bootstrap Methods and their Application
Davison, A. C., & Hinkley, D. V. (1997) · doi:10.1017/cbo9780511802843 · Cited by 7,350
Bootstrap Methods and Their Application
Loughin, T. M., Davison, A. C., & HINKLEY, D. V. (1999) · Journal of the American Statistical Association · doi:10.2307/2669707 · Cited by 5,478
Bostock, M., Ogievetsky, V., & Heer, J. (2011) · IEEE Transactions on Visualization and Computer Graphics · doi:10.1109/tvcg.2011.185 · Cited by 3,165
Guidelines for evaluating and expressing the uncertainty of NIST measurement results
Taylor, B. N. (1994) · National Institute of Standards and Technology, NIST Technical Note 1297 · doi:10.6028/nist.tn.1297 · Cited by 2,833
Guidelines for evaluating and expressing the uncertainty of NIST measurement results
Taylor, B. N., & Kuyatt, C. E. (2018) · doi:10.6028/nist.tn.1297-1993 · Cited by 2,582
How to improve Bayesian reasoning without instruction: Frequency formats.
Gigerenzer, G., & Hoffrage, U. (1995) · Psychological Review · doi:10.1037/0033-295x.102.4.684 · Cited by 2,190
(2011) · Cited by 2,025
Violin Plots: A Box Plot-Density Trace Synergism
Hintze, J. L., & Nelson, R. D. (1998) · The American Statistician · doi:10.1080/00031305.1998.10480559 · Cited by 1,802
Automating the design of graphical presentations of relational information
Mackinlay, J. D. (1986) · ACM Transactions on Graphics · doi:10.1145/22949.22950 · Cited by 1,631
Inference by Eye: Confidence Intervals and How to Read Pictures of Data.
Cumming, G., & Finch, S. (2005) · American Psychologist · doi:10.1037/0003-066x.60.2.170 · Cited by 1,449 · cited 1×
“For example, 92 error bars representing confidence intervals can be superimposed on bar charts [12].”
Background
Cited by
Sorted by citations
D'Ignazio, C., & Klein, L. F. (2020) · doi:10.7551/mitpress/11805.001.0001 · Cited by 1,738
The Science of Visual Data Communication: What Works
Franconeri, S., Padilla, L. M. K., Shah, P., Zacks, J. M., & Hullman, J. (2021) · Psychological Science in the Public Interest · doi:10.1177/15291006211051956 · Cited by 394
Self-citationKay, M., Kola, T., Hullman, J. R., & Munson, S. A. (2016) · Proceedings of the 2016 CHI Conference on Human Factors in Computing Systems · doi:10.1145/2858036.2858558 · Cited by 239
Self-citationUncertainty as a Form of Transparency: Measuring, Communicating, and Using Uncertainty
Bhatt, U., Antorán, J., Zhang, Y., Liao, Q. V., Sattigeri, P., Fogliato, R., Melançon, G., Krishnan, R., Stanley, J., Tickoo, O., et al. (2021) · Proceedings of the 2021 AAAI/ACM Conference on AI, Ethics, and Society · doi:10.1145/3461702.3462571 · Cited by 300
Human factors in model interpretability: Industry practices, challenges, and needs
Hong, S. R., Hullman, J., & Bertini, E. (2020) · Proceedings of the ACM on Human-Computer Interaction · doi:10.1145/3392878 · Cited by 219
Self-citationIn Pursuit of Error: A Survey of Uncertainty Visualization Evaluation
Hullman, J., Qiao, X., Correll, M., Kale, A., & Kay, M. (2019) · IEEE Transactions on Visualization and Computer Graphics · doi:10.1109/tvcg.2018.2864889 · Cited by 187
Self-citationggdist: Visualizations of Distributions and Uncertainty in the Grammar of Graphics
Kay, M. (2023) · IEEE Transactions on Visualization and Computer Graphics · doi:10.1109/tvcg.2023.3327195 · Cited by 185
Why Authors Don't Visualize Uncertainty
Hullman, J. R. (2019) · IEEE Transactions on Visualization and Computer Graphics · doi:10.1109/tvcg.2019.2934287 · Cited by 195
Self-citationUncertainty Displays Using Quantile Dotplots or CDFs Improve Transit Decision-Making
Fernandes, M., Walls, L., Munson, S., Hullman, J., & Kay, M. (2018) · Proceedings of the 2018 CHI Conference on Human Factors in Computing Systems · doi:10.1145/3173574.3173718 · Cited by 175
Self-citationA Task-Based Taxonomy of Cognitive Biases for Information Visualization
Dimara, E., Franconeri, S., Catherine Plaisant, B., Bezerianos, A., & Dragicevic, P. (2018) · IEEE Transactions on Visualization and Computer Graphics · doi:10.1109/tvcg.2018.2872577 · Cited by 192
Increasing the Transparency of Research Papers with Explorable Multiverse Analyses
Dragicevic, P., Jansen, Y., Sarma, A., Kay, M., & Chevalier, F. (2019) · CHI Conference on Human Factors in Computing Systems · doi:10.1145/3290605.3300295 · Cited by 144
Hypothetical Outcome Plots Help Untrained Observers Judge Trends in Ambiguous Data
Kale, A., Nguyen, F., Kay, M., & Hullman, J. (2019) · IEEE Transactions on Visualization and Computer Graphics · doi:10.1109/tvcg.2018.2864909 · Cited by 122
Self-citationVisual Reasoning Strategies for Effect Size Judgments and Decisions
Kale, A., Kay, M., & Hullman, J. (2021) · IEEE Transactions on Visualization and Computer Graphics · doi:10.1109/tvcg.2020.3030335 · Cited by 109
Self-citationTrust, but Verify: Optimistic Visualizations of Approximate Queries for Exploring Big Data
Moritz, D., Fisher, D., Ding, B., & Wang, C. (2017) · CHI Conference on Human Factors in Computing Systems · doi:10.1145/3025453.3025456 · Cited by 92
Value-Suppressing Uncertainty Palettes
Correll, M., Moritz, D., & Heer, J. (2018) · CHI Conference on Human Factors in Computing Systems · doi:10.1145/3173574.3174216 · Cited by 92
Padilla, L., Kay, M., & Hullman, J. R. (2021) · Wiley StatsRef: Statistics Reference Online · doi:10.1002/9781118445112.stat08296 · Cited by 87
Self-citationA Bayesian Cognition Approach to Improve Data Visualization
Kim, Y.-S., Walls, L. A., Krafft, P., & Hullman, J. (2019) · Proceedings of the 2019 CHI Conference on Human Factors in Computing Systems · doi:10.1145/3290605.3300912 · Cited by 76
Self-citationHofman, J. M., Goldstein, D. G., & Hullman, J. (2020) · Proceedings of the 2020 CHI Conference on Human Factors in Computing Systems · doi:10.1145/3313831.3376454 · Cited by 75
Self-citationPadilla, L., Powell, M., Kay, M., & Hullman, J. R. (2021) · Frontiers in Psychology · doi:10.3389/fpsyg.2020.579267 · Cited by 82
Self-citationHow Data Workers Cope with Uncertainty
Boukhelifa, N., Perrin, M.-E., Huron, S., & Eagan, J. (2017) · CHI Conference on Human Factors in Computing Systems · doi:10.1145/3025453.3025738 · Cited by 73
Mitigating the Attraction Effect with Visualizations
Dimara, E., Bailly, G., Bezerianos, A., & Franconeri, S. (2018) · IEEE Transactions on Visualization and Computer Graphics · doi:10.1109/tvcg.2018.2865233 · Cited by 67
Gemini: A Grammar and Recommender System for Animated Transitions in Statistical Graphics
Kim, Y.-H., & Heer, J. (2020) · IEEE Transactions on Visualization and Computer Graphics · doi:10.1109/tvcg.2020.3030360 · Cited by 57
Hullman, J., Kay, M., Kim, Y.-S., & Shrestha, S. (2018) · IEEE Transactions on Visualization and Computer Graphics · doi:10.1109/tvcg.2017.2743898 · Cited by 55
Self-citationVisualizing Privacy-Utility Trade-Offs in Differentially Private Data Releases
Nanayakkara, P., Bater, J., He, X. Q., Hullman, J. R., & Rogers, J. (2022) · Proceedings on Privacy Enhancing Technologies · doi:10.2478/popets-2022-0058 · Cited by 63
Self-citationDesigning for Interactive Exploratory Data Analysis Requires Theories of Graphical Inference
Hullman, J. R., & Gelman, A. (2021) · Harvard Data Science Review · doi:10.1162/99608f92.3ab8a587 · Cited by 62
Self-citationDecision-Making Under Uncertainty in Research Synthesis
Kale, A. M., Kay, M., & Hullman, J. R. (2019) · CHI Conference on Human Factors in Computing Systems · doi:10.1145/3290605.3300432 · Cited by 51
Self-citationSeeing What You Believe or Believing What You See? Belief Biases Correlation Estimation
Xiong, C., Stokes, C., Kim, Y., & Franconeri, S. (2022) · IEEE Transactions on Visualization and Computer Graphics · doi:10.1109/tvcg.2022.3209405 · Cited by 56
Key Attributes of a Modern Statistical Computing Tool
McNamara, A. A. (2018) · The American Statistician · doi:10.1080/00031305.2018.1482784 · Cited by 47
Communicating with Interactive Articles
Hohman, F., Conlen, M., Heer, J., & Chau, D. H. (2020) · Distill · doi:10.23915/distill.00028 · Cited by 46
Padilla, L., Fygenson, R., Castro, S. C., & Bertini, E. (2022) · IEEE Transactions on Visualization and Computer Graphics · doi:10.1109/tvcg.2022.3209457 · Cited by 45
Data Hunches: Incorporating Personal Knowledge into Visualizations
Lin, H., Akbaba, D., Meyer, M., & Lex, A. (2022) · IEEE Transactions on Visualization and Computer Graphics · doi:10.1109/tvcg.2022.3209451 · Cited by 50
Kawakami, A., Sivaraman, V., Stapleton, L., Cheng, H.-F., Perer, A., Wu, Z. S., Zhu, H., & Holstein, K. (2022) · Designing Interactive Systems Conference · doi:10.1145/3532106.3533556 · Cited by 46
Visualizing Uncertainty for Non-Expert End Users: The Challenge of the Deterministic Construal Error
Joslyn, S. L., & Savelli, S. (2021) · Frontiers in Computer Science · doi:10.3389/fcomp.2020.590232 · Cited by 41
Bayesian-Assisted Inference from Visualized Data
Kim, Y., Kayongo, P., Grunde-McLaughlin, M., & Hullman, J. R. (2020) · IEEE Transactions on Visualization and Computer Graphics · doi:10.1109/tvcg.2020.3028984 · Cited by 43
Self-citationAnimated Vega-Lite: Unifying Animation with a Grammar of Interactive Graphics
Zong, J., Pollock, J., Wootton, D., & Satyanarayan, A. (2022) · IEEE Transactions on Visualization and Computer Graphics · doi:10.1109/tvcg.2022.3209369 · Cited by 38
Helske, J., Helske, S., Cooper, M., Ynnerman, A., & Besancon, L. (2021) · IEEE Transactions on Visualization and Computer Graphics · doi:10.1109/tvcg.2021.3073466 · Cited by 38
Exhibiting Uncertainty: Visualizing Data Quality Indicators for Cultural Collections
Windhager, F., Salisu, S., & Mayr, E. (2019) · Informatics · doi:10.3390/informatics6030029 · Cited by 37
Karduni, A., Markant, D. B., Wesslen, R. S., & Dou, W. (2020) · IEEE Transactions on Visualization and Computer Graphics · doi:10.1109/tvcg.2020.3029412 · Cited by 42
Castro, S. C., Quinan, P. S., Hosseinpour, H., & Padilla, L. (2021) · IEEE Transactions on Visualization and Computer Graphics · doi:10.1109/tvcg.2021.3114803 · Cited by 40
Predicting an epidemic trajectory is difficult
Wilke, C. O., & Bergstrom, C. T. (2020) · Proceedings of the National Academy of Sciences · doi:10.1073/pnas.2020200117 · Cited by 36
Mannino, M., & Abouzied, A. (2019) · ACM Symposium on User Interface Software and Technology (UIST) · doi:10.1145/3332165.3347866 · Cited by 35
Datamations: Animated Explanations of Data Analysis Pipelines
Pu, X., Kross, S., Hofman, J. M., & Goldstein, D. G. (2021) · CHI Conference on Human Factors in Computing Systems · doi:10.1145/3411764.3445063 · Cited by 32
Narechania, A. A., Karduni, A., Wesslen, R. S., & Wall, E. (2021) · IEEE Transactions on Visualization and Computer Graphics · doi:10.1109/tvcg.2021.3114820 · Cited by 42
Zhang, S., Heck, P. R., Meyer, M. N., Chabris, C. F., Goldstein, D. G., & Hofman, J. M. (2023) · Proceedings of the National Academy of Sciences · doi:10.1073/pnas.2302491120 · Cited by 30
Yang, F., Cai, M., Mortenson, C. R., Fakhari, H., Lokmanoglu, A. D., Hullman, J. R., Franconeri, S., Diakopoulos, N. A., Nisbet, E. C., & Kay, M. (2023) · IEEE Transactions on Visualization and Computer Graphics · doi:10.1109/tvcg.2023.3327356 · Cited by 30
Self-citationInformation, incentives, and goals in election forecasts
Gelman, A., Hullman, J. R., Wlezien, C. B., & Morris, G. E. (2020) · Judgment and Decision Making · doi:10.1017/s1930297500007981 · Cited by 30
Self-citationDesigning for Uncertainty in HCI
Greis, M., Hullman, J. R., Correll, M., Kay, M., & Shaer, O. (2017) · CHI Conference Extended Abstracts on Human Factors in Computing Systems (CHI EA) · doi:10.1145/3027063.3027091 · Cited by 29
Self-citationVagueness visualization in building models across different design stages
Abualdenien, J., & Borrmann, A. (2020) · Advanced Engineering Informatics · doi:10.1016/j.aei.2020.101107 · Cited by 29
Sarma, A., & Kay, M. (2020) · CHI Conference on Human Factors in Computing Systems · doi:10.1145/3313831.3376377 · Cited by 29
Why Evaluating Uncertainty Visualization is Error Prone
Hullman, J. R. (2016) · doi:10.1145/2993901.2993919 · Cited by 30
Self-citationCausal Support: Modeling Causal Inferences with Visualizations
Kale, A. M., Wu, Y., & Hullman, J. R. (2021) · IEEE Transactions on Visualization and Computer Graphics · doi:10.1109/tvcg.2021.3114824 · Cited by 28
Self-citationA Probabilistic Grammar of Graphics
Pu, X., & Kay, M. (2020) · International Conference on Human Factors in Computing Systems · doi:10.1145/3313831.3376466 · Cited by 29
Uncertainty VisualizationPreprint
Padilla, L., Kay, M., & Hullman, J. R. (2020) · doi:10.31234/osf.io/ebd6r · Cited by 28
Self-citationCui, L., & Liu, Z. (2021) · Attention Perception & Psychophysics · doi:10.3758/s13414-020-02212-x · Cited by 26
Evaluating the Impact of Uncertainty Visualization on Model Reliance
Zhao, J. L., Wang, Y., Mancenido, M. V., Chiou, E. K., & Maciejewski, R. (2023) · IEEE Transactions on Visualization and Computer Graphics · doi:10.1109/tvcg.2023.3251950 · Cited by 26
Impact of Cognitive Biases on Progressive Visualization
Procopio, M., Mosca, A., Scheidegger, C., Wu, E., & Chang, R. (2021) · IEEE Transactions on Visualization and Computer Graphics · doi:10.1109/tvcg.2021.3051013 · Cited by 25
Holder, E., & Xiong, C. (2022) · IEEE Transactions on Visualization and Computer Graphics · doi:10.1109/tvcg.2022.3209377 · Cited by 32
Show or suppress? Managing input uncertainty in machine learning model explanations
Wang, D., Zhang, W., & Lim, B. Y. (2021) · Artificial Intelligence · doi:10.1016/j.artint.2021.103456 · Cited by 24
A review of uncertainty visualization errors: Working memory as an explanatory theory
Padilla, L. M. K., Castro, S., & Hosseinpour, H. (2021) · The Psychology of learning and motivation/The psychology of learning and motivation · doi:10.1016/bs.plm.2021.03.001 · Cited by 17
Biosorption of chromium (VI) from textile waste water using luffa cylindrica activated carbon
Nwosu‐Obieogu, K., & Okolo, B. I. (2020) · Environmental Quality Management · doi:10.1002/tqem.21687 · Cited by 20
Gemini2: Generating Keyframe-Oriented Animated Transitions Between Statistical Graphics
Kim, Y.-H., & Heer, J. (2021) · Visualization · doi:10.1109/vis49827.2021.9623291 · Cited by 23
Panagiotidou, G., Poblome, J., Aerts, J. A., & Moere, A. V. (2022) · Computer Supported Cooperative Work (CSCW) · doi:10.1007/s10606-022-09432-9 · Cited by 19
In Dice We Trust: Uncertainty Displays for Maintaining Trust in Election Forecasts Over Time
Yang, F., Mortenson, C. R., Nisbet, E. C., Diakopoulos, N. A., & Kay, M. (2024) · CHI Conference on Human Factors in Computing Systems · doi:10.1145/3613904.3642371 · Cited by 19
Connected bikeability in London: Which localities are better connected by bike and does this matter?
Beecham, R., Yang, Y., Tait, C., & Lovelace, R. (2023) · Environment and Planning B Urban Analytics and City Science · doi:10.1177/23998083231165122 · Cited by 18
EVM: Incorporating Model Checking into Exploratory Visual Analysis
Kale, A. M., Guo, Z., Qiao, X. L., Heer, J., & Hullman, J. R. (2023) · IEEE Transactions on Visualization and Computer Graphics · doi:10.1109/tvcg.2023.3326516 · Cited by 18
Self-citationSarma, A., Guo, S., Hoffswell, J., Rossi, R. A., Du, F., Koh, E., & Kay, M. (2022) · IEEE Transactions on Visualization and Computer Graphics · doi:10.1109/tvcg.2022.3209348 · Cited by 17
Incorporating Open Data Into Introductory Courses in Statistics
Rivera, R., Marazzi, M., & Torres-Saavedra, P. A. (2019) · Journal of Statistics Education · doi:10.1080/10691898.2019.1669506 · Cited by 17
Capture & Analysis of Active Reading Behaviors for Interactive Articles on the Web
Conlen, M., Kale, A. M., & Heer, J. (2019) · Computer Graphics Forum · doi:10.1111/cgf.13720 · Cited by 17
Visualizing Uncertainty in Probabilistic Graphs with Network Hypothetical Outcome Plots (NetHOPs)
Zhang, D., Adar, E., & Hullman, J. R. (2021) · IEEE Transactions on Visualization and Computer Graphics · doi:10.1109/tvcg.2021.3114679 · Cited by 17
Self-citationKerns, S. H., & Wilmer, J. B. (2021) · Journal of Vision · doi:10.1167/jov.21.12.17 · Cited by 16
Chakraborty, S., Kiefer, P., & Raubal, M. (2024) · International Journal of Geographical Information Systems · doi:10.1080/13658816.2024.2348747 · Cited by 19
Let’s Gamble: How a Poor Visualization Can Elicit Risky Behavior
Bancilhon, M., Liu, Z., & Ottley, A. (2020) · Visualization · doi:10.1109/vis47514.2020.00046 · Cited by 15
Wesslen, R., Karduni, A., Markant, D., & Dou, W. (2021) · IEEE Transactions on Visualization and Computer Graphics · doi:10.1109/tvcg.2021.3114692 · Cited by 15
Uncertainty visualization: Fundamentals and recent developments
Hägele, D., Schulz, C., Beschle, C. A., Booth, H., Butt, M., Barth, A., Deußen, O., & Weiskopf, D. (2022) · it - Information Technology · doi:10.1515/itit-2022-0033 · Cited by 15
Communication of Statistics and Evidence in Times of Crisis
Schneider, C., Kerr, J. R., Dryhurst, S., & Aston, J. (2023) · Annual Review of Statistics and Its Application · doi:10.1146/annurev-statistics-040722-052011 · Cited by 14
How should we design violin plots?
Molina, E., Viale, L., & Vázquez, P. (2022) · doi:10.1109/visguides57787.2022.00006 · Cited by 13
Uncertainty-Aware Multidimensional Scaling
Hägele, D., Krake, T., & Weiskopf, D. (2022) · IEEE Transactions on Visualization and Computer Graphics · doi:10.1109/tvcg.2022.3209420 · Cited by 13
BOWMAN, A. W. (2019) · Journal of the Royal Statistical Society Series A (Statistics in Society) · doi:10.1111/rssa.12379 · Cited by 13
Nguyen, F., Qiao, X., Heer, J., & Hullman, J. R. (2020) · Computer Graphics Forum · doi:10.1111/cgf.13902 · Cited by 15
Self-citationRaz, D., Bintz, C., Guetler, V., Tam, A., Katell, M. A., Dailey, D., Herman, B., Krafft, P. M., & Young, M. (2021) · Proceedings of the AAAI/ACM Conference on AI Ethics and Society · doi:10.1145/3461702.3462627 · Cited by 15
Simple methods for improving the communication of uncertainty in species’ temporal trends
Pescott, O., Stroh, P. A., Humphrey, T., & Walker, K. (2022) · Ecological Indicators · doi:10.1016/j.ecolind.2022.109117 · Cited by 12
Subjective Probability Correction for Uncertainty Representations
Yang, F., Hedayati, M., & Kay, M. (2023) · CHI Conference on Human Factors in Computing Systems · doi:10.1145/3544548.3580998 · Cited by 16
Karjack, S., Brudzinski, M. R., & Shipley, T. F. (2022) · Seismological Research Letters · doi:10.1785/0220210318 · Cited by 11
Fitzgerald, K. G., & Tipton, E. (2023) · Journal of Research on Educational Effectiveness · doi:10.1080/19345747.2023.2209082 · Cited by 14
Masson, D., Malacria, S., Casiez, G., & Vogel, D. (2023) · ACM Symposium on User Interface Software and Technology (UIST) · doi:10.1145/3586183.3606762 · Cited by 11
Improving the visual communication of environmental model projections
Bannister, H. J., Blackwell, P. G., Hyder, K., & Webb, T. J. (2021) · Scientific Reports · doi:10.1038/s41598-021-98290-4 · Cited by 11
The Meta-Analytic Rain Cloud Plot: A New Approach to Visualizing Clearinghouse Data
Fitzgerald, K. G., & Tipton, E. (2022) · Journal of Research on Educational Effectiveness · doi:10.1080/19345747.2022.2031366 · Cited by 10
Some Prior(s) Experience Necessary
Phelan, C., Hullman, J. R., Kay, M., & Resnick, P. (2019) · CHI Conference on Human Factors in Computing Systems · doi:10.1145/3290605.3300709 · Cited by 10
Self-citationFitting Bell Curves to Data Distributions Using Visualization
Newburger, E., Correll, M., & Elmqvist, N. (2022) · IEEE Transactions on Visualization and Computer Graphics · doi:10.1109/tvcg.2022.3210763 · Cited by 9
Odds and Insights: Decision Quality in Exploratory Data Analysis Under Uncertainty
Sarma, A., Pu, X., Cui, Y., Correll, M., Brown, E. T., & Kay, M. (2024) · CHI Conference on Human Factors in Computing Systems · doi:10.1145/3613904.3641995 · Cited by 9
No Such Thing as Too Much Chocolate
Moser, C., Phelan, C., Resnick, P., Schoenebeck, S. Y., & Reinecke, K. (2017) · CHI Conference on Human Factors in Computing Systems · doi:10.1145/3025453.3025778 · Cited by 13
Self-citationHolstein, J., Böcking, L., Spitzer, P., Kühl, N., Vössing, M., & Satzger, G. (2025) · ACM Transactions on Computer-Human Interaction · doi:10.1145/3762813 · Cited by 11
The Rational Agent Benchmark for Data Visualization
Wu, Y., Guo, Z., Mamakos, M., Hartline, J. D., & Hullman, J. R. (2023) · IEEE Transactions on Visualization and Computer Graphics · doi:10.1109/tvcg.2023.3326513 · Cited by 11
Self-citationJoint visualization of seasonal influenza serology and phylogeny to inform vaccine composition
Lee, J., Hadfield, J., Black, A., Sibley, T. R., Neher, R. A., Bedford, T., & Huddleston, J. (2023) · Frontiers in Bioinformatics · doi:10.3389/fbinf.2023.1069487 · Cited by 8
Muhammed, D. D., Simon, N., Utley, J. E. P., Verhagen, I. T. E., Duller, R. A., Griffiths, J., Wooldridge, L. J., & Worden, R. H. (2022) · Geosciences · doi:10.3390/geosciences12010023 · Cited by 8
Perceptual and Cognitive Foundations of Information Visualization
Schloss, K. B. (2025) · Annual Review of Vision Science · doi:10.1146/annurev-vision-110323-110009 · Cited by 7
Beecham, R., & Lovelace, R. (2022) · Geographical Analysis · doi:10.1111/gean.12338 · Cited by 7
Revisiting hollow all-carbon structures: Aromaticity and kinetic stability
Yáñez, O., & Pino‐Rios, R. (2023) · Diamond and Related Materials · doi:10.1016/j.diamond.2023.110057 · Cited by 7
Datamator: An Authoring Tool for Creating Datamations via Data Query Decomposition
Guo, Y., Cao, N., Cai, L., Wu, Y., Weiskopf, D., Shi, D., & Chen, Q. (2023) · Applied Sciences · doi:10.3390/app13179709 · Cited by 7
Species Diversity and Elevational Distribution of Bats in Nepal
Dahal, D. R., Thapa, S., & Singh, N. B. (2024) · Acta Chiropterologica · doi:10.3161/15081109acc2024.26.1.009 · Cited by 7
Metadata
- Authors
- Hullman, J., Resnick, P., & Adar, E.
- Affiliations
- University of Washington (US)
- University of Michigan (US)
- Corresponding author
- Hullman, Jessica
- Venue
- PLOS ONE
- Publisher
- Public Library of Science (PLoS)
- Published
- 2015-11-16
- Volume
- 10
- Issue
- 11
- Pages
- e0142444
- ISSN
- 1932-6203 (ISSN-L)
- PMC
- PMC4646698
- OpenAlex
- W2292312835
- Cited by
- 194
- References
- 43
- Citations by year
- 2026: 11 · 2025: 24 · 2024: 18 · 2023: 32 · 2022: 26 · 2021: 27 · 2020: 21 · 2019: 18 · 2018: 9 · 2017: 6 · 2016: 2
- FWCI
- 4.92
- Type
- journal article
- Language
- en
- Open access
- gold
- doi.org
- Licence
- Locations
- PLoS ONE (publishedVersion, cc-by)
- Europe PMC (PubMed Central) (publishedVersion, cc-by)
- PubMed Central (publishedVersion, cc-by)
- PubMed (publishedVersion)
- RePEc: Research Papers in Economics (submittedVersion)
- DOAJ (DOAJ: Directory of Open Access Journals) (submittedVersion, cc-by-sa)
- Figshare (submittedVersion, cc-by)
- Topics
- Physical Sciences › Computer Science › Computer Graphics and Computer-Aided Design › Data Visualization and Analytics
- Social Sciences › Psychology › Experimental and Cognitive Psychology › Visual and Cognitive Learning Processes
- Physical Sciences › Mathematics › Statistics and Probability › Statistics Education and Methodologies
- Keywords
- error bars, violin plots
- MeSH terms
- Data Interpretation, Statistical, Discrimination, Psychological, Humans, Probability, Reproducibility of Results, Models, Statistical, Normal Distribution
About these checks
Registry, retraction, Cites and statistics results are computed, not judged, with one exception: a printed reference that no index lists is read once by a model before it counts as a citation error. Claims are extracted by a model and kept only when their quote appears verbatim in the text; each cited source is then checked, with a model’s help, for whether it says what the claim relies on. Those verdicts can be wrong — read the claim’s quote and the cited source before relying on one.
Statistics and arithmetic are recomputed, not judged.
Confidence bands are shown only for fields calibrated on our annotated test set. None is calibrated yet, so no band is shown.
What counts as a claim ›How we measure confidence ›How we check this ›
Are you an author, or do you see a problem with this page? Request a review
