

Tremor Detection Using Parametric and Non-Parametric Spectral Estimation Methods: A Comparison with Clinical Assessment
Open accessThe DOI matches its Crossref record; 20 of the 20 references it cites were found in a registry or an index.
Abstract
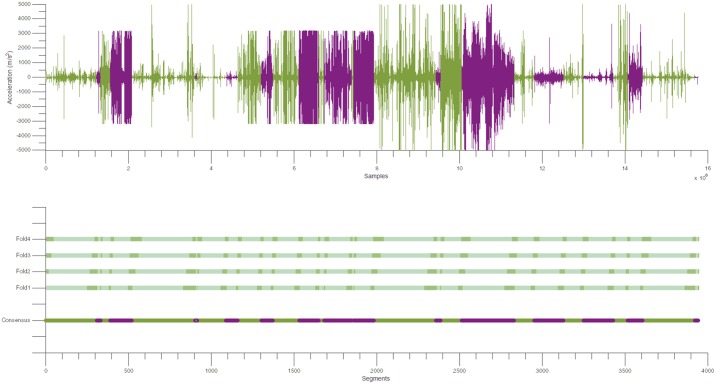
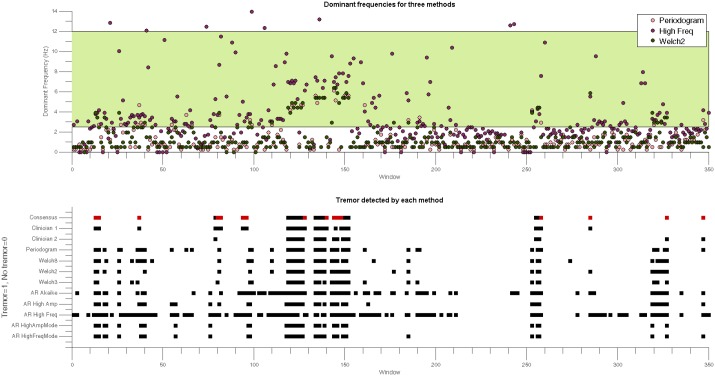
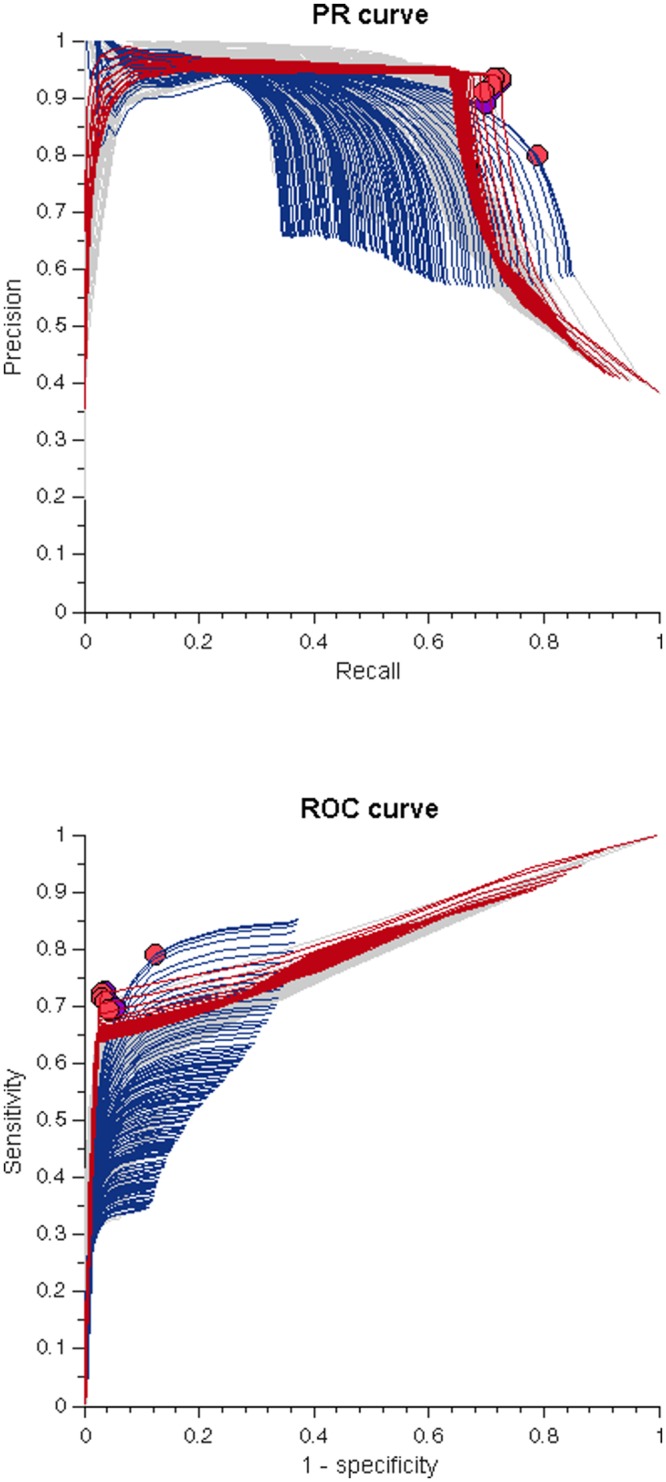
In the clinic, tremor is diagnosed during a time-limited process in which patients are observed and the characteristics of tremor are visually assessed. For some tremor disorders, a more detailed analysis of these characteristics is needed. Accelerometry and electromyography can be used to obtain a better insight into tremor. Typically, routine clinical assessment of accelerometry and electromyography data involves visual inspection by clinicians and occasionally computational analysis to obtain objective characteristics of tremor. However, for some tremor disorders these characteristics may be different during daily activity. This variability in presentation between the clinic and daily life makes a differential diagnosis more difficult. A long-term recording of tremor by accelerometry and/or electromyography in the home environment could help to give a better insight into the tremor disorder. However, an evaluation of such recordings using routine clinical standards would take too much time. We evaluated a range of techniques that automatically detect tremor segments in accelerometer data, as accelerometer data is more easily obtained in the home environment than electromyography data. Time can be saved if clinicians only have to evaluate the tremor characteristics of segments that have been automatically detected in longer daily activity recordings. We tested four non-parametric methods and five parametric methods on clinical accelerometer data from 14 patients with different tremor disorders. The consensus between two clinicians regarding the presence or absence of tremor on 3943 segments of accelerometer data was employed as reference. The nine methods were tested against this reference to identify their optimal parameters. Non-parametric methods generally performed better than parametric methods on our dataset when optimal parameters were used. However, one parametric method, employing the high frequency content of the tremor bandwidth under consideration (High Freq) performed similarly to non-parametric methods, but had the highest recall values, suggesting that this method could be employed for automatic tremor detection.
Overview
The claims and statistics of this paper haven’t been checked yet.
Free: it reads the open-access text and checks the first 5 claims that cite a source we can check. Create a free account to check every claim.
Integrity signals
Registry
Cites
Statistics
Figures
Verification
Claims the paper makes
The claims and statistics of this paper haven’t been checked yet.
Free: it reads the open-access text and checks the first 5 claims that cite a source we can check. Create a free account to check every claim.
Claims other papers make about this one
Each is checked against this paper’s own text: does it say what the citing paper says it does?
The source backs part of the claim, not all of it — or backs it for a different population, condition or comparison.
In the citing paper
“Manzanera et al. [21] compared several parametric and nonparametric spectral estimation methods for tremor detection but failed to detect the resting tremor accurately.”
From Detection and Quantification of Resting Tremor in Parkinson's Disease Using Long-Term Acceleration Data (2021) · cites this paper as [21]
Experimental — accuracy not yet measured
Self-check
Percentages, sums and reported differences re-computed from the paper’s own numbers.
The self-check needs the paper’s full text.
Citations
Cites
A new look at the statistical model identification
Akaike, H. (1974) · IEEE Transactions on Automatic Control · doi:10.1109/tac.1974.1100705 · Cited by 51,879 · cited 1×
“Akaike: Only one model is selected from all possible AR models [18].”
MethodWelch, P. (1967) · IEEE Transactions on Audio and Electroacoustics · doi:10.1109/tau.1967.1161901 · Cited by 12,277 · cited 1×
“We selected the autoregression method using Burg’s approach [11] to represent parametric methods and the modified periodogram and the Welch method [12] to represent classical methods.”
MethodThe relationship between Precision-Recall and ROC curves
Davis, J., & Goadrich, M. (2006) · Proceedings of the 23rd international conference on Machine learning - ICML '06 · doi:10.1145/1143844.1143874 · Cited by 6,559 · cited 1×
“It is important to note that these different approaches might result in different optimal parameters [22].”
BackgroundANew Look at the Statistical Model Identification
AKAlKE, H. (2011) · Cited by 4,177
Consensus Statement of the Movement Disorder Society on Tremor
Deuschl, G., Bain, P., & Brin, M. (2008) · Movement Disorders · doi:10.1002/mds.870131303 · Cited by 1,981 · cited 2×
“Patients with dystonic tremor usually show focal tremor with irregular amplitude and variable frequency (typically less than 7 Hz) [1].”
BackgroundAgreement, the F-Measure, and Reliability in Information Retrieval
Hripcsak, G. (2005) · Journal of the American Medical Informatics Association · doi:10.1197/jamia.m1733 · Cited by 949 · cited 1×
“However, for this initial approach and since there is no evidence to favor one metric we decided to treat both metrics equally [20].”
BackgroundSalarian, A., Russmann, H., Wider, C., Burkhard, P. R., Vingerhoets, F. J. G., & Aminian, K. (2007) · IEEE Transactions on Biomedical Engineering · doi:10.1109/tbme.2006.886670 · Cited by 416 · cited 3×
“employed video recordings and they found that video recordings do not always provide optimal images for classifying tremor (especially at low amplitudes), resulting in possible misclassification [8].”
BackgroundMethodInfluentialBelieving is perceiving: mismatch between self-report and actigraphy in psychogenic tremor
Parees, I., Saifee, T. A., Kassavetis, P., Kojovic, M., Rubio-Agusti, I., Rothwell, J. C., Bhatia, K. P., & Edwards, M. J. (2012) · Brain · doi:10.1093/brain/awr292 · Cited by 165 · cited 1×
“Selfreported tremor has been used to monitor tremor outside the clinic, however, for FT there is a characteristic mismatch between these reports and objective assessments of tremor [7].”
MethodTime-frequency analysis of tremors
O'Suilleabhain, P. (1998) · Brain · doi:10.1093/brain/121.11.2127 · Cited by 157
A Review on Techniques for Tremor Recording and Quantification
Mansur, P. H. G., Cury, L. K. P., Andrade, A. D. O., Pereira, A. A., Miotto, G., Soares, A. B., & Naves, E. L. M. (2007) · Critical Reviews in Biomedical Engineering · doi:10.1615/critrevbiomedeng.v35.i5.10 · Cited by 115 · cited 1×
“Classical methods have been widely used in clinical trials [9] even though it is known that these methods produce PSDs with poor frequency resolution when applied to short segment lengths.”
Method
Cited by
Clinical Assessments in Parkinson's Disease
Bhidayasiri, R., & Martínez‐Martín, P. (2017) · International review of neurobiology · doi:10.1016/bs.irn.2017.01.001 · Cited by 121
Vescio, B., Nisticò, R., Augimeri, A., Quattrone, A., Crasà, M., & Quattrone, A. (2021) · Diagnostics · doi:10.3390/diagnostics11020200 · Cited by 39
“There is an increasing interest in methods based on accelerometers [6,7] and/or surface electromyography (EMG) electrodes, since they are readily available, non-invasive diagnostic tools.”
MethodDuque, J. D. L., Egea, A. J. S., Reeb, T., Rojas, H. A. G., & González‐Vargas, A. M. (2020) · IEEE Access · doi:10.1109/access.2020.2993647 · Cited by 44
“Additionally, these filters allow reducing the sensor offsets and drifts due to various physical phenomena such as motion artifacts [17], [25].”
BackgroundSimilar association between objective and subjective symptoms in functional and organic tremor
Kramer, G., Dominguez‐Vega, Z. T., Laarhoven, H. S., Brandsma, R., Smit, M., van der Stouwe, A. M. M., Elting, J. W. J., Maurits, N. M., Rosmalen, J. G. M., & Tijssen, M. A. J. (2019) · Parkinsonism & Related Disorders · doi:10.1016/j.parkreldis.2019.05.026 · Cited by 25
“In our current study, we used a peak-frequency detection method in 4-s windows, which was validated in both patients with FT and OrgT [17].”
BackgroundMethodResultInfluentialSelf-citationTremor Assessment during Virtual Reality Brain Tumor Resection
Siyar, S., Azarnoush, H., Rashidi, S., & Maestro, R. F. D. (2019) · Journal of surgical education · doi:10.1016/j.jsurg.2019.11.011 · Cited by 22
Metadata
- Authors
- Martinez Manzanera, O., Elting, J. W., van der Hoeven, J. H., & Maurits, N. M.
- Affiliations
- University Medical Center Groningen (NL)
- Venue
- PLOS ONE
- Publisher
- Public Library of Science (PLoS)
- Published
- 2016-06-03
- Volume
- 11
- Issue
- 6
- Pages
- e0156822
- ISSN
- 1932-6203 (ISSN-L)
- PMC
- PMC4892538
- OpenAlex
- W2425917746
- Cited by
- 22
- References
- 20
- Citations by year
- 2026: 1 · 2025: 1 · 2024: 1 · 2023: 2 · 2021: 4 · 2020: 5 · 2019: 4 · 2018: 2 · 2017: 2
- FWCI
- 2.00
- Type
- journal article
- Language
- en
- Open access
- gold
- doi.org
- Licence
- Locations
- PLoS ONE (publishedVersion, cc-by)
- Europe PMC (PubMed Central) (publishedVersion, cc-by)
- PubMed Central (publishedVersion, cc-by)
- PubMed (publishedVersion)
- RePEc: Research Papers in Economics (submittedVersion)
- DOAJ (DOAJ: Directory of Open Access Journals) (submittedVersion, cc-by-sa)
- University of Groningen research database (University of Groningen / Centre for Information Technology) (submittedVersion, cc-by)
- Funders
- Consejo Nacional de Ciencia y Tecnología
- Topics
- Health Sciences › Medicine › Clinical Neurology › Deep Brain Stimulation and Movement Disorders
- Physical Sciences › Computer Science › Computer Vision and Pattern Recognition › Context-Aware Activity Recognition Systems
- Life Sciences › Neuroscience › Cognitive Neuroscience › Motor Control and Adaptation
- Keywords
- tremor detection, tremor disorders, accelerometer data, spectral estimation, clinical evaluation, differential diagnosis, clinician consensus
- MeSH terms
- Aged, Aged, 80 and over, Electromyography, Female, Humans, Male, Middle Aged, Signal Processing, Computer-Assisted, Tremor, Essential Tremor, Accelerometry
About these checks
Registry, retraction, Cites and statistics results are computed, not judged, with one exception: a printed reference that no index lists is read once by a model before it counts as a citation error. Claims are extracted by a model and kept only when their quote appears verbatim in the text; each cited source is then checked, with a model’s help, for whether it says what the claim relies on. Those verdicts can be wrong — read the claim’s quote and the cited source before relying on one.
Statistics and arithmetic are recomputed, not judged.
Confidence bands are shown only for fields calibrated on our annotated test set. None is calibrated yet, so no band is shown.
What counts as a claim ›How we measure confidence ›How we check this ›
Are you an author, or do you see a problem with this page? Request a review
How to cite
Cite CoChat for the checks on this page, and the paper for its own findings.
- This page
- CoChat. (2026). Citation check: Tremor Detection Using Parametric and Non-Parametric Spectral Estimation Methods: A Comparison with Clinical Assessment. https://app.cochat.ai/papers/10.1371/journal.pone.0156822
- The paper
- Martinez Manzanera, O., Elting, J. W., van der Hoeven, J. H., & Maurits, N. M. (2016). Tremor Detection Using Parametric and Non-Parametric Spectral Estimation Methods: A Comparison with Clinical Assessment. PLOS ONE. https://doi.org/10.1371/journal.pone.0156822
Data sources
Bibliographic data: Semantic Scholar, OpenAlex, Crossref.
Contains information from the Semantic Scholar Academic Graph Datasets, made available under the ODC Attribution License (ODC-BY 1.0).
Semantic Scholar’s data is described in: Kinney, R., et al. (2023). The Semantic Scholar Open Data Platform. arXiv:2301.10140.
