

The DOI matches its Crossref record; 4 of the 4 references it cites were found in a registry or an index.
Up-Regulated Expression of LAMP2 and Autophagy Activity during Neuroendocrine Differentiation of Prostate Cancer LNCaP Cells
Overview
The claims and statistics of this paper haven’t been checked yet.
Run the check — free, no account needed. It reads the open-access text and checks the sources it cites.
Integrity signals
Registry
Cites
Statistics
Figures
Verification
Claims the paper makes
The claims and statistics of this paper haven’t been checked yet.
Run the check — free, no account needed. It reads the open-access text and checks the sources it cites.
Claims other papers make about this one
Each is checked against this paper’s own text: does it say what the citing paper says it does?
In the citing paper
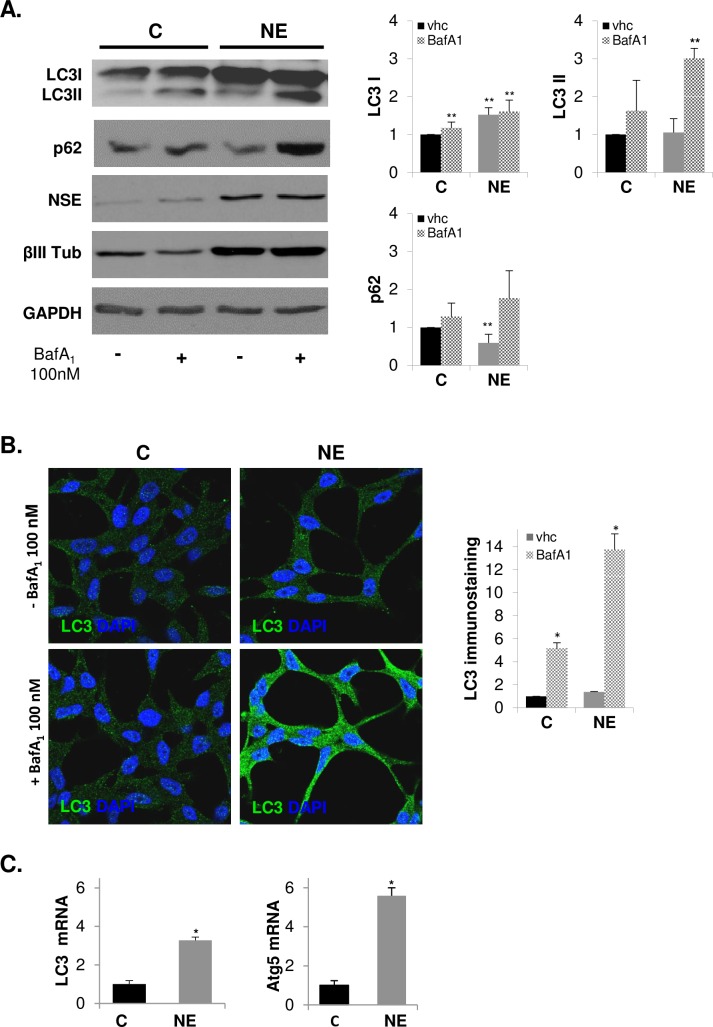
“and that bafilomycin A1 will ultimately cause a fusion block as well as neutralize the pH [220], but the inhibition of fusion may be due to a block in ATP2A/SERCA activity [305]”
From Guidelines for the use and interpretation of assays for monitoring autophagy (4th edition) 1 (2021) · cites this paper as [305]
Self-check
Percentages, sums and reported differences re-computed from the paper’s own numbers.
The self-check needs the paper’s full text.
Citations
Cites
Subramanian, A., Tamayo, P., Mootha, V. K., Mukherjee, S., Ebert, B. L., Gillette, M. A., Paulovich, A., Pomeroy, S. L., Golub, T. R., Lander, E. S., et al. (2005) · Proceedings of the National Academy of Sciences · doi:10.1073/pnas.0506580102 · Cited by 53,625
Guidelines for the use and interpretation of assays for monitoring autophagy (3rd edition).
Klionsky, D. J., Abdelmohsen, K., Abe, A., Abedin, M. J., Abeliovich, H., Acevedo Arozena, A., Adachi, H., Adams, C. M., Adams, P. D., Adeli, K., et al. (2016) · Autophagy · doi:10.1080/15548627.2015.1100356 · Cited by 5,894
Self-citationGuidelines for the use and interpretation of assays for monitoring autophagy
Klionsky, D. J., Abdalla, F. C., Abeliovich, H., Abraham, R. T., Acevedo-Arozena, A., Adeli, K., Agholme, L., Agnello, M., Agostinis, P., Aguirre-Ghiso, J. A., et al. (2012) · Autophagy · doi:10.4161/auto.19496 · Cited by 3,996 · cited 1×
“Autophagosome turnover can also be determined by measurement of the adaptor protein sequestosome 1 (SQSTM1/p62), a protein that recruits ubiquitinated proteins to autophagosomes and whose levels inversely correlate with activation of autophagy [41, 42].”
BackgroundSelf-citationTermination of autophagy and reformation of lysosomes regulated by mTOR
Yu, L., McPhee, C. K., Zheng, L., Mardones, G. A., Rong, Y., Peng, J., Mi, N., Zhao, Y., Liu, Z., Wan, F., et al. (2010) · Nature · doi:10.1038/nature09076 · Cited by 1,544
Research works printed but not linked: 58
- J Ferlay, 2015, Cancer incidence and mortality worldwide: sources, methods and major patterns in GLOBOCAN 2012, International journal of cancer Journal international du cancer, 136, E359, 10.1002/ijc.29210 · DOI · Paper page
- FG Rick, 2015, Bench-to-bedside development of agonists and antagonists of luteinizing hormone-releasing hormone for treatment of advanced prostate cancer, Urologic oncology, 33, 270, 10.1016/j.urolonc.2014.11.006 · DOI
- DJ Samson, 2002, Systematic review and meta-analysis of monotherapy compared with combined androgen blockade for patients with advanced prostate carcinoma, Cancer, 95, 361, 10.1002/cncr.10647 · DOI
- AA Shafi, 2013, Androgen receptors in hormone-dependent and castration-resistant prostate cancer, Pharmacology & therapeutics, 140, 223, 10.1016/j.pharmthera.2013.07.003 · DOI
- F Saad, 2015, Androgen Deprivation Therapy and Secondary Hormone Therapy in the Management of Hormone-sensitive and Castration-resistant Prostate Cancer, Urology, 86, 852, 10.1016/j.urology.2015.07.034 · DOI
- T Karantanos, 2013, Prostate cancer progression after androgen deprivation therapy: mechanisms of castrate resistance and novel therapeutic approaches, Oncogene, 32, 5501, 10.1038/onc.2013.206 · DOI
- D Hirano, 2004, Neuroendocrine differentiation in hormone refractory prostate cancer following androgen deprivation therapy, European urology, 45, 586, 10.1016/j.eururo.2003.11.032 · DOI
- H Beltran, 2014, Aggressive variants of castration-resistant prostate cancer. Clinical cancer research: an official journal of the, American Association for Cancer Research, 20, 2846
- AW Wyatt, 2015, Targeting the adaptive molecular landscape of castration-resistant prostate cancer, EMBO molecular medicine, 7, 878, 10.15252/emmm.201303701 · DOI
- O Cussenot, 1996, Plasma neuroendocrine markers in patients with benign prostatic hyperplasia and prostatic carcinoma, The Journal of urology, 155, 1340, 10.1016/S0022-5347(01)66261-X · DOI
- S Isshiki, 2002, Chromogranin a concentration as a serum marker to predict prognosis after endocrine therapy for prostate cancer, The Journal of urology, 167, 512, 10.1016/S0022-5347(01)69075-X · DOI
- T Hvamstad, 2003, Neuroendocrine serum tumour markers in hormone-resistant prostate cancer, European urology, 44, 215, 10.1016/S0302-2838(03)00257-4 · DOI
- Y Sun, 2009, Neuroendocrine differentiation in prostate cancer, American journal of translational research, 1, 148
- PA Abrahamsson, 1999, Neuroendocrine cells in tumour growth of the prostate, Endocrine-related cancer, 6, 503, 10.1677/erc.0.0060503 · DOI
- S Terry, 2014, The many faces of neuroendocrine differentiation in prostate cancer progression, Frontiers in oncology, 4, 60, 10.3389/fonc.2014.00060 · DOI
- CG Sauer, 2006, Genetic analysis of neuroendocrine tumor cells in prostatic carcinoma, The Prostate, 66, 227, 10.1002/pros.20338 · DOI
- YJ Bang, 1994, Terminal neuroendocrine differentiation of human prostate carcinoma cells in response to increased intracellular cyclic AMP, Proceedings of the National Academy of Sciences of the United States of America, 91, 5330, 10.1073/pnas.91.12.5330 · DOI
- ME Cox, 1999, Acquisition of neuroendocrine characteristics by prostate tumor cells is reversible: implications for prostate cancer progression, Cancer research, 59, 3821
- PD Deeble, 2001, Interleukin-6- and cyclic AMP-mediated signaling potentiates neuroendocrine differentiation of LNCaP prostate tumor cells, Molecular and cellular biology, 21, 8471, 10.1128/MCB.21.24.8471-8482.2001 · DOI
- I Gutierrez-Canas, 2005, Vasoactive intestinal peptide induces neuroendocrine differentiation in the LNCaP prostate cancer cell line through PKA, ERK, and PI3K, The Prostate, 63, 44, 10.1002/pros.20173 · DOI
- R Shen, 1997, Transdifferentiation of cultured human prostate cancer cells to a neuroendocrine cell phenotype in a hormone-depleted medium, Urologic oncology, 3, 67, 10.1016/S1078-1439(97)00039-2 · DOI
- P Saftig, 2009, Lysosome biogenesis and lysosomal membrane proteins: trafficking meets function, Nature reviews Molecular cell biology, 10, 623, 10.1038/nrm2745 · DOI · Paper page
- M Fukuda, 1991, Lysosomal membrane glycoproteins. Structure, biosynthesis, and intracellular trafficking, The Journal of biological chemistry, 266, 21327, 10.1016/S0021-9258(18)54636-6 · DOI
- EL Eskelinen, 2006, Roles of LAMP-1 and LAMP-2 in lysosome biogenesis and autophagy, Molecular aspects of medicine, 27, 495, 10.1016/j.mam.2006.08.005 · DOI
- Y Tanaka, 2000, Accumulation of autophagic vacuoles and cardiomyopathy in LAMP-2-deficient mice, Nature, 406, 902, 10.1038/35022595 · DOI · Paper page
- I Nishino, 2000, Primary LAMP-2 deficiency causes X-linked vacuolar cardiomyopathy and myopathy (Danon disease), Nature, 406, 906, 10.1038/35022604 · DOI · Paper page
- Y Endo, 2015, Danon disease: a phenotypic expression of LAMP-2 deficiency, Acta neuropathologica, 129, 391, 10.1007/s00401-015-1385-4 · DOI
- EL Eskelinen, 2005, Unifying nomenclature for the isoforms of the lysosomal membrane protein LAMP-2, Traffic, 6, 1058, 10.1111/j.1600-0854.2005.00337.x · DOI
- AM Cuervo, 2014, Chaperone-mediated autophagy: roles in disease and aging, Cell research, 24, 92, 10.1038/cr.2013.153 · DOI
- Y Fujiwara, 2013, Discovery of a novel type of autophagy targeting RNA, Autophagy, 9, 403, 10.4161/auto.23002 · DOI
- Y Fujiwara, 2013, Direct uptake and degradation of DNA by lysosomes, Autophagy, 9, 1167, 10.4161/auto.24880 · DOI
- F Janku, 2011, Autophagy as a target for anticancer therapy, Nature reviews Clinical oncology, 8, 528, 10.1038/nrclinonc.2011.71 · DOI
- L Galluzzi, 2015, Autophagy in malignant transformation and cancer progression, The EMBO journal, 34, 856, 10.15252/embj.201490784 · DOI · Paper page
- JM Farrow, 2014, Autophagy as a modulator and target in prostate cancer, Nature reviews Urology, 11, 508, 10.1038/nrurol.2014.196 · DOI
- ME Wright, 2003, Androgen receptor represses the neuroendocrine transdifferentiation process in prostate cancer cells, Molecular endocrinology, 17, 1726, 10.1210/me.2003-0031 · DOI · Paper page
- AM Cuervo, 1996, A receptor for the selective uptake and degradation of proteins by lysosomes, Science, 273, 501, 10.1126/science.273.5274.501 · DOI · Paper page
- JP Luzio, 2007, Lysosomes: fusion and function, Nature reviews Molecular cell biology, 8, 622, 10.1038/nrm2217 · DOI
- K Kannan, 1996, Lysosome-associated membrane proteins h-LAMP1 (CD107a) and h-LAMP2 (CD107b) are activation-dependent cell surface glycoproteins in human peripheral blood mononuclear cells which mediate cell adhesion to vascular endothelium, Cellular immunology, 171, 10, 10.1006/cimm.1996.0167 · DOI
- M Damaghi, 2015, Chronic acidosis in the tumour microenvironment selects for overexpression of LAMP2 in the plasma membrane, Nature communications, 6, 8752, 10.1038/ncomms9752 · DOI
- RA Gottlieb, 2015, Untangling autophagy measurements: all fluxed up, Circulation research, 116, 504, 10.1161/CIRCRESAHA.116.303787 · DOI
- H Murillo, 2001, Role of PI3K signaling in survival and progression of LNCaP prostate cancer cells to the androgen refractory state, Endocrinology, 142, 4795, 10.1210/endo.142.11.8467 · DOI
- S Xie, 2004, Regulation of interleukin-6-mediated PI3K activation and neuroendocrine differentiation by androgen signaling in prostate cancer LNCaP cells, The Prostate, 60, 61, 10.1002/pros.20048 · DOI
- C Morell, 2016, The cannabinoid WIN 55,212–2 prevents neuroendocrine differentiation of LNCaP prostate cancer cells, Prostate Cancer Prostatic Dis
- H Appelqvist, 2013, The lysosome: from waste bag to potential therapeutic target, Journal of molecular cell biology, 5, 214, 10.1093/jmcb/mjt022 · DOI · Paper page
- N Fehrenbacher, 2008, Sensitization to the lysosomal cell death pathway by oncogene-induced down-regulation of lysosome-associated membrane proteins 1 and 2, Cancer research, 68, 6623, 10.1158/0008-5472.CAN-08-0463 · DOI
- K Furuta, 2001, Expression of lysosome-associated membrane proteins in human colorectal neoplasms and inflammatory diseases, The American journal of pathology, 159, 449, 10.1016/S0002-9440(10)61716-6 · DOI
- T Saha, 2012, LAMP2A overexpression in breast tumors promotes cancer cell survival via chaperone-mediated autophagy, Autophagy, 8, 1643, 10.4161/auto.21654 · DOI
- M Kon, 2011, Chaperone-mediated autophagy is required for tumor growth, Science translational medicine, 3, 109ra17
- A Ibrahim-Hashim, 2012, Systemic buffers inhibit carcinogenesis in TRAMP mice, The Journal of urology, 188, 624, 10.1016/j.juro.2012.03.113 · DOI
- EA Dunlop, 2014, mTOR and autophagy: a dynamic relationship governed by nutrients and energy, Semin Cell Dev Biol, 36, 121, 10.1016/j.semcdb.2014.08.006 · DOI
- M Matsuda-Lennikov, 2014, Lysosomal interaction of Akt with Phafin2: a critical step in the induction of autophagy, PloS one, 9, e79795, 10.1371/journal.pone.0079795 · DOI
- M Noguchi, 2014, The links between AKT and two intracellular proteolytic cascades: ubiquitination and autophagy, Biochim Biophys Acta, 1846, 342
- QW Fan, 2010, Akt and autophagy cooperate to promote survival of drug-resistant glioma, Sci Signal, 3, ra81
- PC Chang, 2014, Autophagy pathway is required for IL-6 induced neuroendocrine differentiation and chemoresistance of prostate cancer LNCaP cells, PloS one, 9, e88556, 10.1371/journal.pone.0088556 · DOI
- Y Zhu, 2014, Interleukin-6 induces neuroendocrine differentiation (NED) through suppression of RE-1 silencing transcription factor (REST), The Prostate, 74, 1086, 10.1002/pros.22819 · DOI
- AV Lapuk, 2012, From sequence to molecular pathology, and a mechanism driving the neuroendocrine phenotype in prostate cancer, The Journal of pathology, 227, 286, 10.1002/path.4047 · DOI
- R Manjithaya, 2011, Autophagy: a broad role in unconventional protein secretion?, Trends Cell Biol, 21, 67, 10.1016/j.tcb.2010.09.009 · DOI
- M Ponpuak, 2015, Secretory autophagy, Curr Opin Cell Biol, 35, 106, 10.1016/j.ceb.2015.04.016 · DOI
Cited by
Sorted by citations
Guidelines for the use and interpretation of assays for monitoring autophagy (4th edition) 1
Klionsky, D. J., Abdel-Aziz, A. K., Abdelfatah, S., Abdellatif, M., Abdoli, A., Abel, S., Abeliovich, H., Abildgaard, M. H., Abudu, Y. P., Acevedo-Arozena, A., et al. (2021) · Autophagy · doi:10.1080/15548627.2020.1797280 · Cited by 2,897
Self-citationWang, J.-H., Forterre, A. V., Zhao, J., Frimannsson, D. O., Delcayre, A., Antes, T. J., Efron, B., Jeffrey, S. S., Pegram, M. D., & Matin, A. C. (2018) · Molecular Cancer Therapeutics · doi:10.1158/1535-7163.mct-17-0827 · Cited by 181
Regulatory role of exercise-induced autophagy for sarcopenia
Liang, J., Zeng, Z., Zhang, Y., & Chen, N. (2020) · Experimental Gerontology · doi:10.1016/j.exger.2019.110789 · Cited by 33
Metadata
- Authors
- Morell, C., Bort, A., Vara-Ciruelos, D., Ramos-Torres, Á., Altamirano-Dimas, M., Díaz-Laviada, I., & Rodríguez-Henche, N.
- Venue
- PLOS ONE
- Publisher
- Public Library of Science (PLoS)
- Published
- 2016-09-14
- Volume
- 11
- Issue
- 9
- Pages
- e0162977
- ISSN
- 1932-6203
- PMC
- PMC5023108
- Cited by
- 50
- References
- 4
- Language
- en
- Funders
- Spanish Ministry of Economy and Competitiveness (BFU2012-31444)
- Junta de Comunidades de Castilla-LaMancha and European Commission FEDER Funds (POII11-0159-0054)
- Comunidad de Madrid (S2010-BMD2308)
- Fundación Tatiana Pérez de Guzmán el Bueno (2013-001)
- Universidad de Alcalá (PI2005/063)
About these checks
Registry, retraction, Cites and statistics results are computed, not judged, with one exception: a printed reference that no index lists is read once by a model before it counts as a citation error. Claims are extracted by a model and kept only when their quote appears verbatim in the text; each cited source is then checked, with a model’s help, for whether it says what the claim relies on. Those verdicts can be wrong — read the claim’s quote and the cited source before relying on one.
Statistics and arithmetic are recomputed, not judged.
Confidence bands are shown only for fields calibrated on our annotated test set. None is calibrated yet, so no band is shown.
What counts as a claim ›How we measure confidence ›How we check this ›
Are you an author, or do you see a problem with this page? Request a review
