Cited by 41

The DOI matches its Crossref record.

The Inhibition of microRNA-128 on IGF-1-Activating mTOR Signaling Involves in Temozolomide-Induced Glioma Cell Apoptotic Death

Chen, Peng-Hsu, Cheng, Chia-Hsiung, Shih, Chwen-Ming, Ho, Kuo-Hao, Lin, Cheng-Wei, Lee, Chin-Cheng, Liu, Ann-Jeng, Chang, Cheng-Kuei, Chen, Ku-Chung·2016·PLOS ONE

Overview

The claims and statistics of this paper haven’t been checked yet.

Run the check — free, no account needed. It reads the open-access text and checks the sources it cites.

A few free checks a day · papers already verified open instantly · results are public

Integrity signals

Registry

Crossref · 10.1371/journal.pone.0167096

Cites

Statistics

Figures

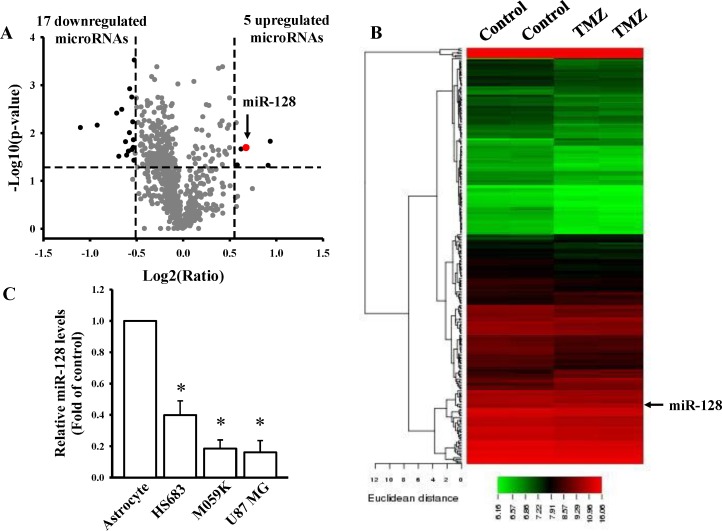
Fig 1 Investigation of TMZ-mediated microRNA profiles. Volcano plot (A) and heatmap of hierarchical gene clustering (B) demonstrating TMZ-regulated microRNA signatures. After U87MG cells were treated with 400 μM TMZ for 24 h, total RNAs were extracted for the microarray. For all array analyses, a p value of less than 0.05 and a log2 (ratio) of more than or equal to 0.58 or less than or equal to −0.51-multiple of change cutoff were applied. Volcano plots exhibit multiples of change (log2 ratio) and probabilities (-log10 p values) of individual microRNAs from the microarray assay. Significantly upregulated and downregulated mRNAs are indicated by black dots. The red dot indicates miR-128. The heatmap depicts the 248 differentially expressed microRNAs between TMZ subsets. A color was assigned to each microRNA based on its relative expression across samples. (C) Detection of endogenous miR-128 levels in normal human astrocytes and three different glioma cell lines including HS683, M059K, and U87MG cells. Relative expression levels of miR-128 were measured through real-time PCR. The U6B level was used as an internal control. Data are the mean ± SD of three experiments.
Fig 1 Investigation of TMZ-mediated microRNA profiles. Volcano plot (A) and heatmap of hierarchical gene clustering (B) demonstrating TMZ-regulated microRNA signatures. After U87MG cells were treated with 400 μM TMZ for 24 h, total RNAs were extracted for the microarray. For all array analyses, a p value of less than 0.05 and a log2 (ratio) of more than or equal to 0.58 or less than or equal to −0.51-multiple of change cutoff were applied. Volcano plots exhibit multiples of change (log2 ratio) and probabilities (-log10 p values) of individual microRNAs from the microarray assay. Significantly upregulated and downregulated mRNAs are indicated by black dots. The red dot indicates miR-128. The heatmap depicts the 248 differentially expressed microRNAs between TMZ subsets. A color was assigned to each microRNA based on its relative expression across samples. (C) Detection of endogenous miR-128 levels in normal human astrocytes and three different glioma cell lines including HS683, M059K, and U87MG cells. Relative expression levels of miR-128 were measured through real-time PCR. The U6B level was used as an internal control. Data are the mean ± SD of three experiments.CC BY · PubMed Central
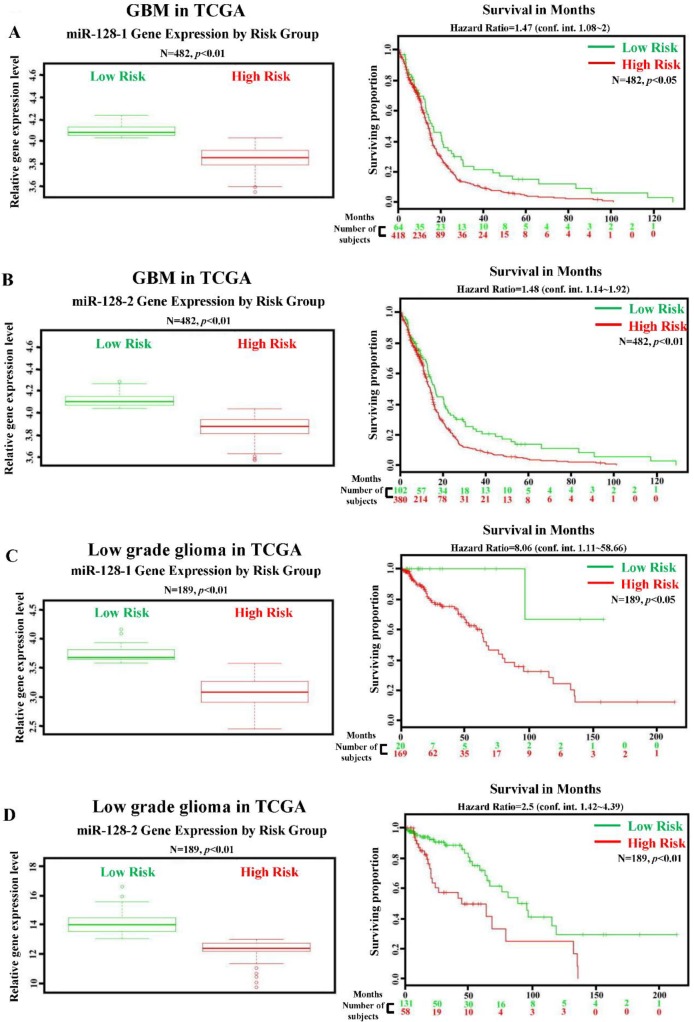
Fig 2 Lower miR-128 levels are significantly associated with a high-risk group and poor survival in patients with GBM and low-grade glioma. Correlation between miR-128-1/miR-128-2 levels and survival rates in patients with GBM (A and B) and low-grade glioma (C and D). The left panel shows relative miR-128-1/miR-128-2 expression levels according to the patient risk group based on GBM and low-grade glioma profiling from the TCGA database. High-risk individuals had lower miR-128-1/miR-128-2 expression levels, which are denoted by red symbols. By contrast, higher miR-128-1/miR-128-2 expression levels were associated with higher survival and are shown in green. The right panel shows results of the Kaplan–Meier analysis of survival data of patients with GBM and low-grade glioma profiles from the TCGA database. X axis values indicate the number of patients per group. Red curves indicate patients at a high risk. Green curves indicate patients at a low risk. The plus sign (+) indicates censored observations. p values were calculated using the log-rank test.
Fig 2 Lower miR-128 levels are significantly associated with a high-risk group and poor survival in patients with GBM and low-grade glioma. Correlation between miR-128-1/miR-128-2 levels and survival rates in patients with GBM (A and B) and low-grade glioma (C and D). The left panel shows relative miR-128-1/miR-128-2 expression levels according to the patient risk group based on GBM and low-grade glioma profiling from the TCGA database. High-risk individuals had lower miR-128-1/miR-128-2 expression levels, which are denoted by red symbols. By contrast, higher miR-128-1/miR-128-2 expression levels were associated with higher survival and are shown in green. The right panel shows results of the Kaplan–Meier analysis of survival data of patients with GBM and low-grade glioma profiles from the TCGA database. X axis values indicate the number of patients per group. Red curves indicate patients at a high risk. Green curves indicate patients at a low risk. The plus sign (+) indicates censored observations. p values were calculated using the log-rank test.CC BY · PubMed Central
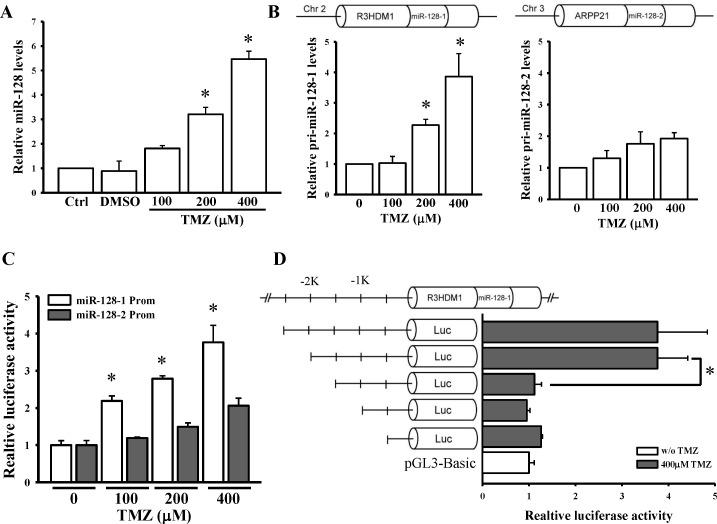
Fig 3 TMZ upregulates miR-128-1 but not miR-128-2 activation. (A) Dose-dependent effects of TMZ on mature (A) and primary (B) miR-128 expression levels. After cells were treated with the indicated doses of TMZ for 24 h, endogenous miR-128, primary (pri)-miR-128-1, and pri-miR-128-2 levels were respectively measured through real-time PCR. U6B and 18S rRNA levels were used as internal controls for the mature and primary miR-128 genes, respectively. (C) TMZ dose-dependent activated miR-128-1 but not miR-128-2 promoter activity. (D) Identification of the core region in the miR-128-1 promoter. After cells were transfected with 500 ng pGL3-Basic, pGL3-miR-128-1-prom2500, or pGL3-128-1 variants for 24 h, luciferase activity was measured with TMZ treatment for another 24 h. pNL1.1.TK[Nluc/TK] plasmids at 5 ng were also cotransfected into cells, and the NanoLucR luciferase value was used as an internal control. Data are the mean ± SD of three experiments. * p < 0.05.
Fig 3 TMZ upregulates miR-128-1 but not miR-128-2 activation. (A) Dose-dependent effects of TMZ on mature (A) and primary (B) miR-128 expression levels. After cells were treated with the indicated doses of TMZ for 24 h, endogenous miR-128, primary (pri)-miR-128-1, and pri-miR-128-2 levels were respectively measured through real-time PCR. U6B and 18S rRNA levels were used as internal controls for the mature and primary miR-128 genes, respectively. (C) TMZ dose-dependent activated miR-128-1 but not miR-128-2 promoter activity. (D) Identification of the core region in the miR-128-1 promoter. After cells were transfected with 500 ng pGL3-Basic, pGL3-miR-128-1-prom2500, or pGL3-128-1 variants for 24 h, luciferase activity was measured with TMZ treatment for another 24 h. pNL1.1.TK[Nluc/TK] plasmids at 5 ng were also cotransfected into cells, and the NanoLucR luciferase value was used as an internal control. Data are the mean ± SD of three experiments. * p < 0.05.CC BY · PubMed Central
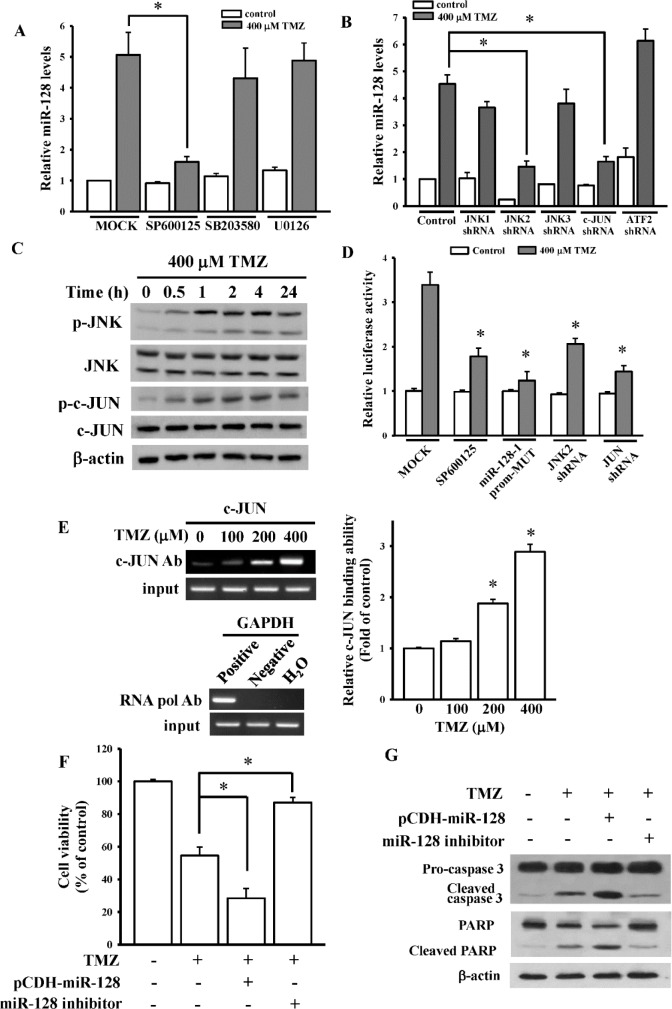
Fig 4 The JNK2/c-Jun signaling pathway is involved in temozolomide (TMZ)-upregulated miR-128 expression. (A) Effects of mitogen-activated protein kinase (MAPK) inhibitors including U0126 (an ERK inhibitor), SB203580 (a p38 inhibitor), and SP600125 (a JNK inhibitor) on endogenous miR-128 levels. (B) Inhibition of JNK2 and c-Jun expressions inhibited TMZ-upregulated miR-128 levels. After cells were respectively pretreated with 10 μM U0126, 5 μM SB203580, and 10 μM SP600125 for 1 h or respectively transfected with 1 μg of shRNAs for 24 h, 400 μM TMZ was added for another 24 h. miR-128 levels were measured through real-time PCR. Data are the mean ± SD of three experiments. * p < 0.05. (C) Time-dependent effects of TMZ on JNK and c-Jun activation. After cells were treated with 400 μM TMZ for the indicated time, phosphorylated and total forms of JNK and c-Jun were detected using immunoblotting assays. (D) SP600125 treatment, mutation of the activator protein (AP)-1-binding site, and inhibition of JNK2 or c-JUN attenuated TMZ-activated miR-128 promoter activity. After cells were transfected with 500 ng pGL3-miR-128-1-prom2500 or a pGL3-miR-128-1-prom2500 mutant for 24 h, luciferase activity was measured with SP600125 pretreatment for 1 h or cotransfected with 1 μg of shRNAs for 24 h followed by TMZ treatment for another 24 h. pNL1.1.TK[Nluc/TK] plasmids at 5 ng were also cotransfected into cells, and the NanoLucR luciferase value was used as an internal control. (E) The ChIP analysis showed that TMZ enhanced c-Jun binding to the miR-128 promoter. Procedures of the ChIP assay are described in “Materials and methods”. As positive or negative controls, protein–DNA complexes were incubated with anti-RNA polymerase or control mouse IgG antibodies. The input DNA represented one-fifth of the starting material. The right panel figure shows quantitative results from the left panel by densitometry. Overexpression and knockdown effects of miR-128 on TMZ-inhibited cell viability (F) and apoptosis-related protein expressions (G). After cells were respectively transfected with 750 ng of miR-128-overexpressing plasmids and 100 nM miR-128 inhibitor followed by TMZ treatment for another 24 h, cell viability and apoptosis-related protein expressions were measured using MTT and immunoblot assays. Data are the mean ± SD of three experiments. * p < 0.05.
Fig 4 The JNK2/c-Jun signaling pathway is involved in temozolomide (TMZ)-upregulated miR-128 expression. (A) Effects of mitogen-activated protein kinase (MAPK) inhibitors including U0126 (an ERK inhibitor), SB203580 (a p38 inhibitor), and SP600125 (a JNK inhibitor) on endogenous miR-128 levels. (B) Inhibition of JNK2 and c-Jun expressions inhibited TMZ-upregulated miR-128 levels. After cells were respectively pretreated with 10 μM U0126, 5 μM SB203580, and 10 μM SP600125 for 1 h or respectively transfected with 1 μg of shRNAs for 24 h, 400 μM TMZ was added for another 24 h. miR-128 levels were measured through real-time PCR. Data are the mean ± SD of three experiments. * p < 0.05. (C) Time-dependent effects of TMZ on JNK and c-Jun activation. After cells were treated with 400 μM TMZ for the indicated time, phosphorylated and total forms of JNK and c-Jun were detected using immunoblotting assays. (D) SP600125 treatment, mutation of the activator protein (AP)-1-binding site, and inhibition of JNK2 or c-JUN attenuated TMZ-activated miR-128 promoter activity. After cells were transfected with 500 ng pGL3-miR-128-1-prom2500 or a pGL3-miR-128-1-prom2500 mutant for 24 h, luciferase activity was measured with SP600125 pretreatment for 1 h or cotransfected with 1 μg of shRNAs for 24 h followed by TMZ treatment for another 24 h. pNL1.1.TK[Nluc/TK] plasmids at 5 ng were also cotransfected into cells, and the NanoLucR luciferase value was used as an internal control. (E) The ChIP analysis showed that TMZ enhanced c-Jun binding to the miR-128 promoter. Procedures of the ChIP assay are described in “Materials and methods”. As positive or negative controls, protein–DNA complexes were incubated with anti-RNA polymerase or control mouse IgG antibodies. The input DNA represented one-fifth of the starting material. The right panel figure shows quantitative results from the left panel by densitometry. Overexpression and knockdown effects of miR-128 on TMZ-inhibited cell viability (F) and apoptosis-related protein expressions (G). After cells were respectively transfected with 750 ng of miR-128-overexpressing plasmids and 100 nM miR-128 inhibitor followed by TMZ treatment for another 24 h, cell viability and apoptosis-related protein expressions were measured using MTT and immunoblot assays. Data are the mean ± SD of three experiments. * p < 0.05.CC BY · PubMed Central
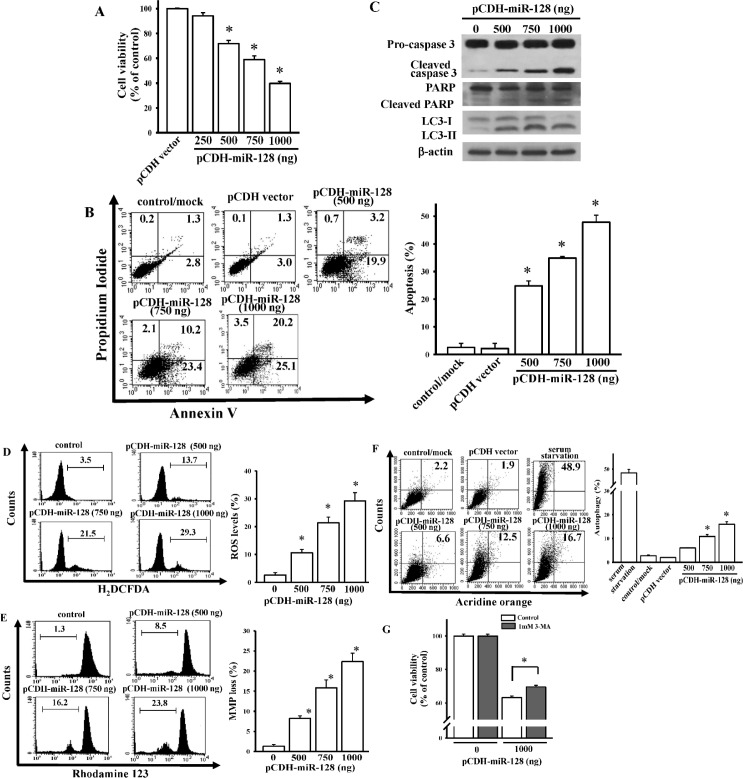
Fig 5 Identification of roles of miR-128 in mediating glioma cell death. Effects of miR-128 overexpression on cell viability (A), apoptosis ratio (B), apoptosis-related proteins levels (C), reactive oxygen species (ROS) generation (D), loss of the mitochondrial membrane potential (MMP) (E), and autophagy formation (F). After cells were transfected with the indicated dose of miR-128-expressing plasmids for 24 h, cell viability, caspase-3 activation, poly(ADP ribose) polymerase (PARP) degradation, LC3-I/II levels, apoptosis, ROS generation, loss of the MMP, and autophagy were measured using MTT assay, immunoblot assays, flow cytometry with annexin V/propidium iodide double-staining, H2DCFDA staining, rhodamine 123, and acridine orange staining, respectively. The right panel shows quantitative results from the left panel. Data are the mean ± SD of three independent experiments. * p < 0.05. (G) Effects of 3-MA on miR-128-induced autophagy. After cells were transfected with the indicated dose of miR-128-expressing plasmids for 4 h followed by 1 mM 3-MA treatment for another 24 h, cell viability was measured using the MTT assay. Data are the mean ± SD of three independent experiments. * p < 0.05.
Fig 5 Identification of roles of miR-128 in mediating glioma cell death. Effects of miR-128 overexpression on cell viability (A), apoptosis ratio (B), apoptosis-related proteins levels (C), reactive oxygen species (ROS) generation (D), loss of the mitochondrial membrane potential (MMP) (E), and autophagy formation (F). After cells were transfected with the indicated dose of miR-128-expressing plasmids for 24 h, cell viability, caspase-3 activation, poly(ADP ribose) polymerase (PARP) degradation, LC3-I/II levels, apoptosis, ROS generation, loss of the MMP, and autophagy were measured using MTT assay, immunoblot assays, flow cytometry with annexin V/propidium iodide double-staining, H2DCFDA staining, rhodamine 123, and acridine orange staining, respectively. The right panel shows quantitative results from the left panel. Data are the mean ± SD of three independent experiments. * p < 0.05. (G) Effects of 3-MA on miR-128-induced autophagy. After cells were transfected with the indicated dose of miR-128-expressing plasmids for 4 h followed by 1 mM 3-MA treatment for another 24 h, cell viability was measured using the MTT assay. Data are the mean ± SD of three independent experiments. * p < 0.05.CC BY · PubMed Central
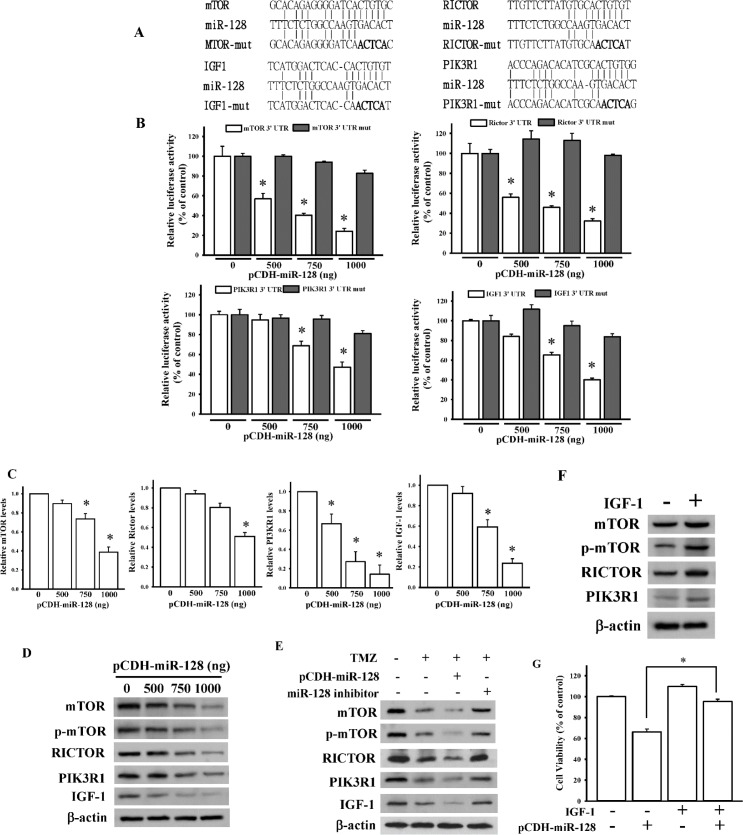
Fig 6 TMZ inhibited mammalian target of rapamycin (mTOR) pathways through miR-128 targeting. (A) Schematic diagram of potential miR-128-targeted sites in the 3’-untranslated region (UTR) of mTOR, RICTOR, IGF1, and PIK3R1 genes. (B) Effects of miR-128 on 3’-UTR luciferase activity of mTOR, RICTOR, IGF1, and PIK3R1 genes. To examine the effect of miR-128, different doses of miR-128-expressing plasmids were cotransfected with 500 ng pmiRGlo-3’-UTR or mutant 3’-UTR of mTOR, RICTOR, IGF1, and PIK3R1 genes. Luciferase activity was measured in these cells 24 h after transfection. Effects of miR-128 overexpression on mRNA (C) and protein (D) expressions of mTOR, RICTOR, IGF1, and PIK3R1 genes. After cells were respectively transfected with the indicated dose of miR-128-expressing plasmids for 24 h, relative mRNA and protein levels of the mTOR, RICTOR, IGF1, and PIK3R1 genes were analyzed through real-time PCR and immunoblotting assays. Data are the mean ± SD of three experiments. * p < 0.05. (E) miR-128 is involved in TMZ-reduced mTOR signaling. (F) The effects of IGF-1 stimulation on miR-128-targeted genes expression levels. (G) IGF-1 stimulation attenuated miR-128-induced cytotoxicity. After cells were transfected with 750 ng of miR-128-expressing plasmids or 100 nM of a miR-128 inhibitor, 400 μM of TMZ was added for another 24 h. For IGF-1 stimulation assays, cells were treated with 200ng/mL of IGF-1 recombinant proteins for 24 h or transfected with 500 ng of miR-128-expressing plasmids combined with 200ng/mL of IGF-1 treatment for 24 h. Protein levels of mTOR, RICTOR, IGF1, and PIK3R1 were analyzed using immunoblotting assays. Cell viability was measured using the MTT assay. Data are the mean ± SD of three experiments. * p < 0.05.
Fig 6 TMZ inhibited mammalian target of rapamycin (mTOR) pathways through miR-128 targeting. (A) Schematic diagram of potential miR-128-targeted sites in the 3’-untranslated region (UTR) of mTOR, RICTOR, IGF1, and PIK3R1 genes. (B) Effects of miR-128 on 3’-UTR luciferase activity of mTOR, RICTOR, IGF1, and PIK3R1 genes. To examine the effect of miR-128, different doses of miR-128-expressing plasmids were cotransfected with 500 ng pmiRGlo-3’-UTR or mutant 3’-UTR of mTOR, RICTOR, IGF1, and PIK3R1 genes. Luciferase activity was measured in these cells 24 h after transfection. Effects of miR-128 overexpression on mRNA (C) and protein (D) expressions of mTOR, RICTOR, IGF1, and PIK3R1 genes. After cells were respectively transfected with the indicated dose of miR-128-expressing plasmids for 24 h, relative mRNA and protein levels of the mTOR, RICTOR, IGF1, and PIK3R1 genes were analyzed through real-time PCR and immunoblotting assays. Data are the mean ± SD of three experiments. * p < 0.05. (E) miR-128 is involved in TMZ-reduced mTOR signaling. (F) The effects of IGF-1 stimulation on miR-128-targeted genes expression levels. (G) IGF-1 stimulation attenuated miR-128-induced cytotoxicity. After cells were transfected with 750 ng of miR-128-expressing plasmids or 100 nM of a miR-128 inhibitor, 400 μM of TMZ was added for another 24 h. For IGF-1 stimulation assays, cells were treated with 200ng/mL of IGF-1 recombinant proteins for 24 h or transfected with 500 ng of miR-128-expressing plasmids combined with 200ng/mL of IGF-1 treatment for 24 h. Protein levels of mTOR, RICTOR, IGF1, and PIK3R1 were analyzed using immunoblotting assays. Cell viability was measured using the MTT assay. Data are the mean ± SD of three experiments. * p < 0.05.CC BY · PubMed Central

Verification

Claims the paper makes

The claims and statistics of this paper haven’t been checked yet.

Run the check — free, no account needed. It reads the open-access text and checks the sources it cites.

A few free checks a day · papers already verified open instantly · results are public

Claims other papers make about this one

Each is checked against this paper’s own text: does it say what the citing paper says it does?

Self-check

Percentages, sums and reported differences re-computed from the paper’s own numbers.

The self-check needs the paper’s full text.

Citations

Cites

No references could be resolved yet.

Research works printed but not linked: 43

  1. TA Wilson, 2014, Glioblastoma multiforme: State of the art and future therapeutics, Surgical neurology international, 5, 64, 10.4103/2152-7806.132138 · DOI
  2. K Urbanska, 2014, Glioblastoma multiforme—an overview, Contemp Oncol (Pozn), 18, 307
  3. W Gunther, 2003, Temozolomide induces apoptosis and senescence in glioma cells cultured as multicellular spheroids, Br J Cancer, 88, 463, 10.1038/sj.bjc.6600711 · DOI
  4. AA Stavrovskaya, 2016, Problems of Glioblastoma Multiforme Drug Resistance, Biochemistry Biokhimiia, 81, 91, 10.1134/S0006297916020036 · DOI
  5. A Shea, 2016, MicroRNAs in glioblastoma multiforme pathogenesis and therapeutics, Cancer medicine
  6. HG Moller, 2013, A systematic review of microRNA in glioblastoma multiforme: micro-modulators in the mesenchymal mode of migration and invasion, Molecular neurobiology, 47, 131, 10.1007/s12035-012-8349-7 · DOI
  7. SP Persengiev, 2012, The Impact of MicroRNAs on Brain Aging and Neurodegeneration, Current gerontology and geriatrics research, 2012, 359369, 10.1155/2012/359369 · DOI
  8. M Li, 2013, miR-128 and its target genes in tumorigenesis and metastasis, Experimental cell research, 319, 3059, 10.1016/j.yexcr.2013.07.031 · DOI
  9. C Shang, 2016, miR-128 regulates the apoptosis and proliferation of glioma cells by targeting RhoE, Oncology letters, 11, 904, 10.3892/ol.2015.3927 · DOI
  10. L Lin, 2013, MicroRNA-128 promotes cell-cell adhesion in U87 glioma cells via regulation of EphB2, Oncology reports, 30, 1239, 10.3892/or.2013.2596 · DOI
  11. ZM Shi, 2012, MiR-128 inhibits tumor growth and angiogenesis by targeting p70S6K1, PloS one, 7, e32709, 10.1371/journal.pone.0032709 · DOI
  12. J Godlewski, 2008, Targeting of the Bmi-1 oncogene/stem cell renewal factor by microRNA-128 inhibits glioma proliferation and self-renewal, Cancer research, 68, 9125, 10.1158/0008-5472.CAN-08-2629 · DOI · Paper page
  13. Y Zhang, 2009, MicroRNA-128 inhibits glioma cells proliferation by targeting transcription factor E2F3a, Journal of molecular medicine, 87, 43, 10.1007/s00109-008-0403-6 · DOI · Paper page
  14. J Sun, 2015, Serum microRNA-128 as a biomarker for diagnosis of glioma, International journal of clinical and experimental medicine, 8, 456
  15. M Laplante, 2012, mTOR signaling in growth control and disease, Cell, 149, 274, 10.1016/j.cell.2012.03.017 · DOI · Paper page
  16. X Li, 2016, PI3K/Akt/mTOR signaling pathway and targeted therapy for glioblastoma, Oncotarget
  17. Z Duzgun, 2016, Role of mTOR in glioblastoma, Gene, 575, 187, 10.1016/j.gene.2015.08.060 · DOI
  18. JN Weinstein, 1997, An information-intensive approach to the molecular pharmacology of cancer, Science, 275, 343, 10.1126/science.275.5298.343 · DOI
  19. BP Lewis, 2005, Conserved seed pairing, often flanked by adenosines, indicates that thousands of human genes are microRNA targets, Cell, 120, 15, 10.1016/j.cell.2004.12.035 · DOI · Paper page
  20. R Aguirre-Gamboa, 2013, SurvExpress: an online biomarker validation tool and database for cancer gene expression data using survival analysis, PloS one, 8, e74250, 10.1371/journal.pone.0074250 · DOI
  21. J Novakova, 2009, MicroRNA involvement in glioblastoma pathogenesis, Biochemical and biophysical research communications, 386, 1, 10.1016/j.bbrc.2009.06.034 · DOI
  22. NH Rekers, 2011, Towards tailored therapy of glioblastoma multiforme, Journal of chemotherapy, 23, 187, 10.1179/joc.2011.23.4.187 · DOI
  23. A Sandelin, 2004, JASPAR: an open-access database for eukaryotic transcription factor binding profiles, Nucleic acids research, 32, D91, 10.1093/nar/gkh012 · DOI
  24. H Dweep, 2011, miRWalk—database: prediction of possible miRNA binding sites by "walking" the genes of three genomes, Journal of biomedical informatics, 44, 839, 10.1016/j.jbi.2011.05.002 · DOI
  25. H Jiang, 2009, Autophagy pathways in glioblastoma, Methods in enzymology, 453, 273, 10.1016/S0076-6879(08)04013-5 · DOI
  26. CJ Lin, 2012, Inhibition of mitochondria- and endoplasmic reticulum stress-mediated autophagy augments temozolomide-induced apoptosis in glioma cells, PloS one, 7, e38706, 10.1371/journal.pone.0038706 · DOI
  27. C Gratas, 2014, Bak and Mcl-1 are essential for Temozolomide induced cell death in human glioma, Oncotarget, 5, 2428, 10.18632/oncotarget.1642 · DOI
  28. GN Castro, 2015, Effects of temozolomide (TMZ) on the expression and interaction of heat shock proteins (HSPs) and DNA repair proteins in human malignant glioma cells, Cell stress & chaperones, 20, 253, 10.1007/s12192-014-0537-0 · DOI
  29. W Miao, 2015, p53 upregulated modulator of apoptosis sensitizes drug-resistant U251 glioblastoma stem cells to temozolomide through enhanced apoptosis, Molecular medicine reports, 11, 4165, 10.3892/mmr.2015.3255 · DOI
  30. J Wang, 2013, miR-181b modulates glioma cell sensitivity to temozolomide by targeting MEK1, Cancer chemotherapy and pharmacology, 72, 147, 10.1007/s00280-013-2180-3 · DOI
  31. L Wang, 2014, MiR-143 acts as a tumor suppressor by targeting N-RAS and enhances temozolomide-induced apoptosis in glioma, Oncotarget, 5, 5416, 10.18632/oncotarget.2116 · DOI
  32. JS Ananta, 2015, Nanoparticle-Delivered Antisense MicroRNA-21 Enhances the Effects of Temozolomide on Glioblastoma Cells, Molecular pharmaceutics, 12, 4509, 10.1021/acs.molpharmaceut.5b00694 · DOI
  33. A Bertucci, 2015, Combined Delivery of Temozolomide and Anti-miR221 PNA Using Mesoporous Silica Nanoparticles Induces Apoptosis in Resistant Glioma Cells, Small, 11, 5687, 10.1002/smll.201500540 · DOI
  34. P Qian, 2012, Loss of SNAIL regulated miR-128-2 on chromosome 3p22.3 targets multiple stem cell factors to promote transformation of mammary epithelial cells, Cancer research, 72, 6036, 10.1158/0008-5472.CAN-12-1507 · DOI
  35. J Li, 2015, miR-23a binds to p53 and enhances its association with miR-128 promoter, Scientific reports, 5, 16422, 10.1038/srep16422 · DOI · Paper page
  36. S Donzelli, 2012, MicroRNA-128-2 targets the transcriptional repressor E2F5 enhancing mutant p53 gain of function, Cell death and differentiation, 19, 1038, 10.1038/cdd.2011.190 · DOI
  37. CJ Lin, 2012, Resveratrol enhances the therapeutic effect of temozolomide against malignant glioma in vitro and in vivo by inhibiting autophagy, Free radical biology & medicine, 52, 377, 10.1016/j.freeradbiomed.2011.10.487 · DOI
  38. Y Hirose, 2004, Cooperative function of Chk1 and p38 pathways in activating G2 arrest following exposure to temozolomide, Journal of neurosurgery, 100, 1060, 10.3171/jns.2004.100.6.1060 · DOI
  39. MT Tomicic, 2015, Apoptosis induced by temozolomide and nimustine in glioblastoma cells is supported by JNK/c-Jun-mediated induction of the BH3-only protein BIM, Oncotarget, 6, 33755, 10.18632/oncotarget.5274 · DOI
  40. Z Yu, 2015, NVP-BEZ235, a novel dual PI3K-mTOR inhibitor displays anti-glioma activity and reduces chemoresistance to temozolomide in human glioma cells, Cancer letters, 367, 58, 10.1016/j.canlet.2015.07.007 · DOI
  41. H Wang, 2015, miR-320b suppresses cell proliferation by targeting c-Myc in human colorectal cancer cells, BMC cancer, 15, 748, 10.1186/s12885-015-1728-5 · DOI
  42. BH Xie, 2016, Mir-765 promotes cell proliferation by downregulating INPP4B expression in human hepatocellular carcinoma, Cancer biomarkers: section A of Disease markers, 16, 405, 10.3233/CBM-160579 · DOI
  43. Y Li, 2015, microRNA-762 promotes breast cancer cell proliferation and invasion by targeting IRF7 expression, Cell proliferation, 48, 643, 10.1111/cpr.12223 · DOI

Cited by

Sorted by citations

See all 41

Metadata

Authors
Chen, P.-H., Cheng, C.-H., Shih, C.-M., Ho, K.-H., Lin, C.-W., Lee, C.-C., Liu, A.-J., Chang, C.-K., & Chen, K.-C.
Venue
PLOS ONE
Published
2016-11-28
Volume
11
Issue
11
Pages
e0167096
ISSN
1932-6203
Cited by
41
References
0
Language
en
Funders
Ministry of Science and Technology (MOST104-2320-B-038-046, MOST105-2320-B-038-019)

About these checks

Registry, retraction, Cites and statistics results are computed, not judged, with one exception: a printed reference that no index lists is read once by a model before it counts as a citation error. Claims are extracted by a model and kept only when their quote appears verbatim in the text; each cited source is then checked, with a model’s help, for whether it says what the claim relies on. Those verdicts can be wrong — read the claim’s quote and the cited source before relying on one.

Statistics and arithmetic are recomputed, not judged.

Confidence bands are shown only for fields calibrated on our annotated test set. None is calibrated yet, so no band is shown.

What counts as a claim ›How we measure confidence ›How we check this ›

Are you an author, or do you see a problem with this page? Request a review

How to cite

Cite CoChat for the checks on this page, and the paper for its own findings.

This page
CoChat. (2026). Citation check: The Inhibition of microRNA-128 on IGF-1-Activating mTOR Signaling Involves in Temozolomide-Induced Glioma Cell Apoptotic Death. https://app.cochat.ai/papers/10.1371/journal.pone.0167096
The paper
Chen, P.-H., Cheng, C.-H., Shih, C.-M., Ho, K.-H., Lin, C.-W., Lee, C.-C., Liu, A.-J., Chang, C.-K., & Chen, K.-C. (2016). The Inhibition of microRNA-128 on IGF-1-Activating mTOR Signaling Involves in Temozolomide-Induced Glioma Cell Apoptotic Death. PLOS ONE. https://doi.org/10.1371/journal.pone.0167096