

The DOI matches its Crossref record; 37 of the 37 references it cites were found in a registry or an index; none of the 37 sources its claims cite is checked for support yet.
The Diversity-Weighted Living Planet Index: Controlling for Taxonomic Bias in a Global Biodiversity Indicator
Open accessAbstract
As threats to species continue to increase, precise and unbiased measures of the impact these pressures are having on global biodiversity are urgently needed. Some existing indicators of the status and trends of biodiversity largely rely on publicly available data from the scientific and grey literature, and are therefore prone to biases introduced through over-representation of well-studied groups and regions in monitoring schemes. This can give misleading estimates of biodiversity trends. Here, we report on an approach to tackle taxonomic and geographic bias in one such indicator (Living Planet Index) by accounting for the estimated number of species within biogeographical realms, and the relative diversity of species within them. Based on a proportionally weighted index, we estimate a global population decline in vertebrate species between 1970 and 2012 of 58% rather than 20% from an index with no proportional weighting. From this data set, comprising 14,152 populations of 3,706 species from 3,095 data sources, we also find that freshwater populations have declined by 81%, marine populations by 36%, and terrestrial populations by 38% when using proportional weighting (compared to trends of -46%, +12% and +15% respectively). These results not only show starker declines than previously estimated, but suggests that those species for which there is poorer data coverage may be declining more rapidly.
Overview
AI snapshot
Written from the paper’s full text.
TL;DR
The paper develops a diversity-weighted Living Planet Index (LPI-D) to correct taxonomic and geographic bias in the Living Planet Index by weighting species trends according to estimated species richness across realms and taxa. It estimates a 58% global vertebrate population decline from 1970 to 2012, compared with 20% under the unweighted LPI.
Key findings
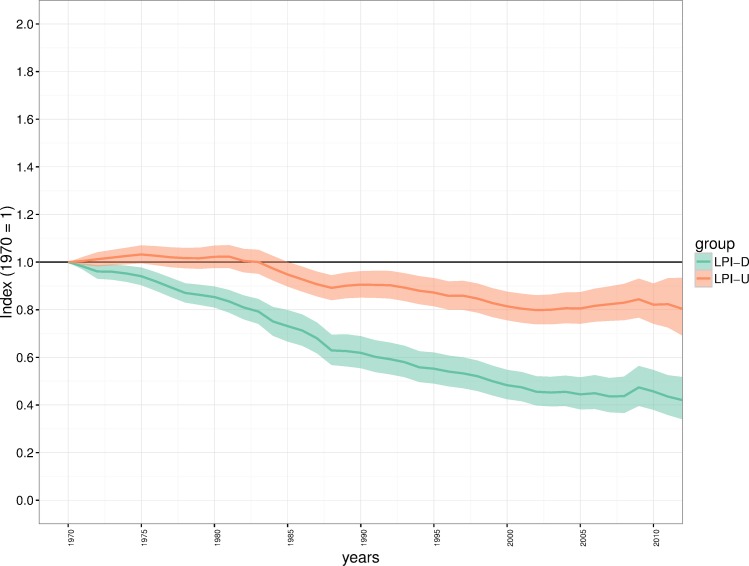
- The global LPI-D declined by 58% (95% CI: -48.3 to -66.0) between 1970 and 2012, an average annual decline of 2%, versus a 19.7% decline (95% CI: -6.6 to -30.9) and 0.52% annual decline for the unweighted LPI-U.
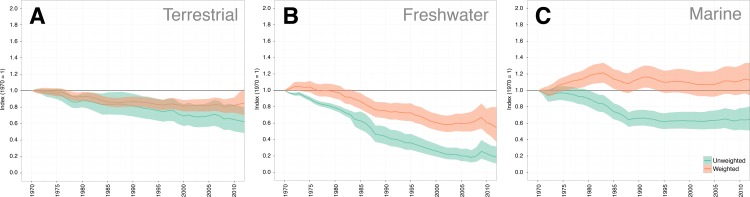
- System-level LPI-D declines were 81.5% for freshwater (95% CI: -68.5 to -89.3), 35.6% for marine (95% CI: -19.5 to -48.8), and 37.9% for terrestrial (95% CI: -20.4 to -51.5); Table 1 gives LPI-U 2012 index values of 0.544 for freshwater, 1.125 for marine, and 0.848 for terrestrial.
- For the Palearctic realm, LPI-U showed a 38.4% increase (95% CI: 12.7–66.2), while LPI-D showed a 30.3% decline (95% CI: -1.4 to -50.2).
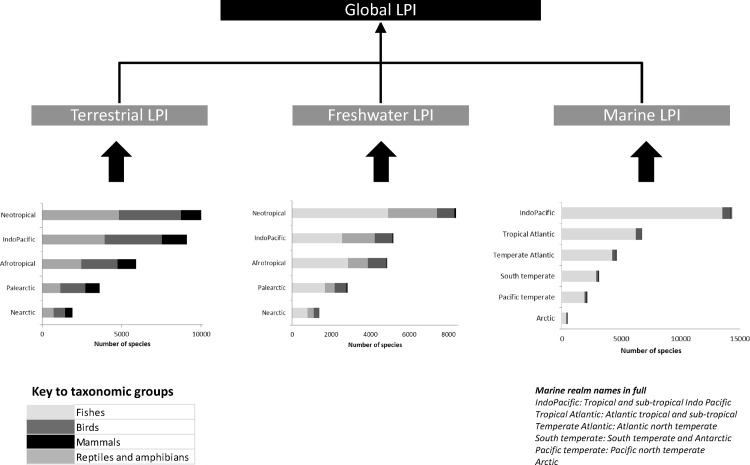
- The database contained 14,152 populations of 3,706 species from 3,095 data sources; representation was biased toward temperate birds and mammals, with under-representation of most tropical realms and marine fishes, and Afrotropical herps representing less than 1% of known species.
Methods
- Data came from the Living Planet Database: time series of population size, density, abundance, or abundance proxies for vertebrate species from 1970 to 2012, requiring at least two years of data, consistent methods, and traceable sources.
- The LPI-D weighted trends by estimated known species richness across systems, biogeographic realms, and taxonomic groups (birds, mammals, fish, and combined herps), producing 57 subsets; systems were weighted equally, realms were weighted by species proportions within systems, and taxa were weighted by species proportions within realms.
- Population trends were modeled with Generalized Additive Models for series with six or more data points and the chain method otherwise; population lambdas were averaged to species trends, and 95% confidence intervals were generated with 10,000 bootstrap iterations. Binomial tests assessed taxonomic over- or under-representation.
Limitations
- Stated: the approach relies on reasonable species lists, which change over time and may be lower quality for less studied groups and regions; estimates of undescribed species (57% amphibians, 13% reptiles, 22% fish) suggest these groups could receive even greater weight and that declines may be steeper than estimated.
- Stated: LPI-D addresses broad geographic bias but not smaller-scale coverage gaps, such as Palearctic data being largely from Europe, Afrotropical data being better represented in eastern and southern Africa, and marine data clustering near coasts.
- Stated and evident: manual data entry is a critical limitation for growing the database; some abundance records are confidential and cannot be made publicly available, and incomplete IUCN assessments for fishes (745 of 1,369 species unassessed, plus 40 Data Deficient) limit the threatened-species representation analysis.
Model-written summary. Check it against the paper before relying on it.
Integrity signals
Registry
Cites
Statistics
Figures
Verification
Claims the paper makes
70 Own result · 22 Not checked yet · 19 Own interpretation · 4 No basis given · 2 Own method
A result the paper reports from its own data — it cites no other source for it, so there is none to check. The quote shows it is in the paper.
In the paper
“Our comparison to a study on geographic bias in terrestrial ecological sites revealed that 63% of the terrestrial sites in the LPD occur in a protected area which is the same proportion as found in Martin et al. (χ2 = 0.004, df = 1, p = 0.95), and more than the expected 13% (χ2 = 883.83, df = 1, p = 0.00).”
§ The Diversity-Weighted Living Planet Index: Controlling for Taxonomic Bias in a Global Biodiversity Indicator > Results > Geographic representation within the living planet index
plain- Asserted: passes — The authors put it forward as true.
- Checkable: passes — It can be checked against evidence.
- Load-bearing: unclear — It is unclear whether the paper’s conclusions depend on it.
- Based: passes — The paper gives a reason why it holds.
A result the paper reports from its own data — it cites no other source for it, so there is none to check. The quote shows it is in the paper.
In the paper
“Based on a proportionally weighted index, we estimate a global population decline in vertebrate species between 1970 and 2012 of 58% rather than 20% from an index with no proportional weighting.”
- Also stated in: § Applying the LPI-D approach to the global living planet index · plain
“This result shows a greater rate of decline than the index calculated using the LPI-U approach which has an average annual decline of 0.52% per year and an overall decline of 19.7% (95% CI: -6.6 –-30.9), over the 42-year period.”
§ The Diversity-Weighted Living Planet Index: Controlling for Taxonomic Bias in a Global Biodiversity Indicator > Abstract
plain- Asserted: passes — The authors put it forward as true.
- Checkable: passes — It can be checked against evidence.
- Load-bearing: passes — The paper’s conclusions depend on it.
- Based: passes — The paper gives a reason why it holds.
- Also stated in: § Applying the LPI-D approach to the global living planet index · plain
A result the paper reports from its own data — it cites no other source for it, so there is none to check. The quote shows it is in the paper.
In the paper
“From this data set, comprising 14,152 populations of 3,706 species from 3,095 data sources, we also find that freshwater populations have declined by 81%, marine populations by 36%, and terrestrial populations by 38% when using proportional weighting (compared to trends of -46%, +12% and +15% respectively).”
§ The Diversity-Weighted Living Planet Index: Controlling for Taxonomic Bias in a Global Biodiversity Indicator > Abstract
plain- Asserted: passes — The authors put it forward as true.
- Checkable: passes — It can be checked against evidence.
- Load-bearing: passes — The paper’s conclusions depend on it.
- Based: passes — The paper gives a reason why it holds.
In the paper
“Our comparison to a study on geographic bias in terrestrial ecological sites revealed that 63% of the terrestrial sites in the LPD occur in a protected area which is the same proportion as found in Martin et al. (χ2 = 0.004, df = 1, p = 0.95), and more than the expected 13% (χ2 = 883.83, df = 1, p = 0.00).”
§ The Diversity-Weighted Living Planet Index: Controlling for Taxonomic Bias in a Global Biodiversity Indicator > Results > Geographic representation within the living planet index
What the sources say
- Not checked yetcites Martin et al.
plain- Asserted: passes — The authors put it forward as true.
- Checkable: passes — It can be checked against evidence.
- Load-bearing: unclear — It is unclear whether the paper’s conclusions depend on it.
- Based: passes — The paper gives a reason why it holds.
A result the paper reports from its own data — it cites no other source for it, so there is none to check. The quote shows it is in the paper.
In the paper
“From this data set, comprising 14,152 populations of 3,706 species from 3,095 data sources, we also find that freshwater populations have declined by 81%, marine populations by 36%, and terrestrial populations by 38% when using proportional weighting (compared to trends of -46%, +12% and +15% respectively).”
§ The Diversity-Weighted Living Planet Index: Controlling for Taxonomic Bias in a Global Biodiversity Indicator > Abstract
plain- Asserted: passes — The authors put it forward as true.
- Checkable: passes — It can be checked against evidence.
- Load-bearing: passes — The paper’s conclusions depend on it.
- Based: passes — The paper gives a reason why it holds.
A result the paper reports from its own data — it cites no other source for it, so there is none to check. The quote shows it is in the paper.
In the paper
“From this data set, comprising 14,152 populations of 3,706 species from 3,095 data sources, we also find that freshwater populations have declined by 81%, marine populations by 36%, and terrestrial populations by 38% when using proportional weighting (compared to trends of -46%, +12% and +15% respectively).”
§ The Diversity-Weighted Living Planet Index: Controlling for Taxonomic Bias in a Global Biodiversity Indicator > Abstract
plain- Asserted: passes — The authors put it forward as true.
- Checkable: passes — It can be checked against evidence.
- Load-bearing: passes — The paper’s conclusions depend on it.
- Based: passes — The paper gives a reason why it holds.
A result the paper reports from its own data — it cites no other source for it, so there is none to check. The quote shows it is in the paper.
In the paper
“From this data set, comprising 14,152 populations of 3,706 species from 3,095 data sources, we also find that freshwater populations have declined by 81%, marine populations by 36%, and terrestrial populations by 38% when using proportional weighting (compared to trends of -46%, +12% and +15% respectively).”
§ The Diversity-Weighted Living Planet Index: Controlling for Taxonomic Bias in a Global Biodiversity Indicator > Abstract
plain- Asserted: passes — The authors put it forward as true.
- Checkable: passes — It can be checked against evidence.
- Load-bearing: passes — The paper’s conclusions depend on it.
- Based: passes — The paper gives a reason why it holds.
A result the paper reports from its own data — it cites no other source for it, so there is none to check. The quote shows it is in the paper.
In the paper
“Our comparison to a study on geographic bias in terrestrial ecological sites revealed that 63% of the terrestrial sites in the LPD occur in a protected area which is the same proportion as found in Martin et al. (χ2 = 0.004, df = 1, p = 0.95), and more than the expected 13% (χ2 = 883.83, df = 1, p = 0.00).”
§ The Diversity-Weighted Living Planet Index: Controlling for Taxonomic Bias in a Global Biodiversity Indicator > Results > Geographic representation within the living planet index
plain- Asserted: passes — The authors put it forward as true.
- Checkable: passes — It can be checked against evidence.
- Load-bearing: unclear — It is unclear whether the paper’s conclusions depend on it.
- Based: passes — The paper gives a reason why it holds.
A result the paper reports from its own data — it cites no other source for it, so there is none to check. The quote shows it is in the paper.
In the paper
“Based on a proportionally weighted index, we estimate a global population decline in vertebrate species between 1970 and 2012 of 58% rather than 20% from an index with no proportional weighting.”
- Also stated in: § Applying the LPI-D approach to the global living planet index · plain
“The global index produced using the LPI-D approach shows a decline of 58% (95% CI: -48.3 –-66.0) between 1970 and 2012 (Fig 5) which equates to an average annual decline of 2% per year.”
§ The Diversity-Weighted Living Planet Index: Controlling for Taxonomic Bias in a Global Biodiversity Indicator > Abstract
plain- Asserted: passes — The authors put it forward as true.
- Checkable: passes — It can be checked against evidence.
- Load-bearing: passes — The paper’s conclusions depend on it.
- Based: passes — The paper gives a reason why it holds.
- Also stated in: § Applying the LPI-D approach to the global living planet index · plain
A result the paper reports from its own data — it cites no other source for it, so there is none to check. The quote shows it is in the paper.
In the paper
“From this data set, comprising 14,152 populations of 3,706 species from 3,095 data sources, we also find that freshwater populations have declined by 81%, marine populations by 36%, and terrestrial populations by 38% when using proportional weighting (compared to trends of -46%, +12% and +15% respectively).”
§ The Diversity-Weighted Living Planet Index: Controlling for Taxonomic Bias in a Global Biodiversity Indicator > Abstract
plain- Asserted: passes — The authors put it forward as true.
- Checkable: passes — It can be checked against evidence.
- Load-bearing: passes — The paper’s conclusions depend on it.
- Based: passes — The paper gives a reason why it holds.
A result the paper reports from its own data — it cites no other source for it, so there is none to check. The quote shows it is in the paper.
In the paper
“From this data set, comprising 14,152 populations of 3,706 species from 3,095 data sources, we also find that freshwater populations have declined by 81%, marine populations by 36%, and terrestrial populations by 38% when using proportional weighting (compared to trends of -46%, +12% and +15% respectively).”
§ The Diversity-Weighted Living Planet Index: Controlling for Taxonomic Bias in a Global Biodiversity Indicator > Abstract
plain- Asserted: passes — The authors put it forward as true.
- Checkable: passes — It can be checked against evidence.
- Load-bearing: passes — The paper’s conclusions depend on it.
- Based: passes — The paper gives a reason why it holds.
In the paper
“For all woodland biomes, the LPI differs significantly to Martin et al.’s observed values except for Tundra (S2 Table).”
§ The Diversity-Weighted Living Planet Index: Controlling for Taxonomic Bias in a Global Biodiversity Indicator > Results > Geographic representation within the living planet index
What the sources say
- Not checked yetcites Martin et al.
plain- Asserted: passes — The authors put it forward as true.
- Checkable: passes — It can be checked against evidence.
- Load-bearing: unclear — It is unclear whether the paper’s conclusions depend on it.
- Based: passes — The paper gives a reason why it holds.
A result the paper reports from its own data — it cites no other source for it, so there is none to check. The quote shows it is in the paper.
In the paper
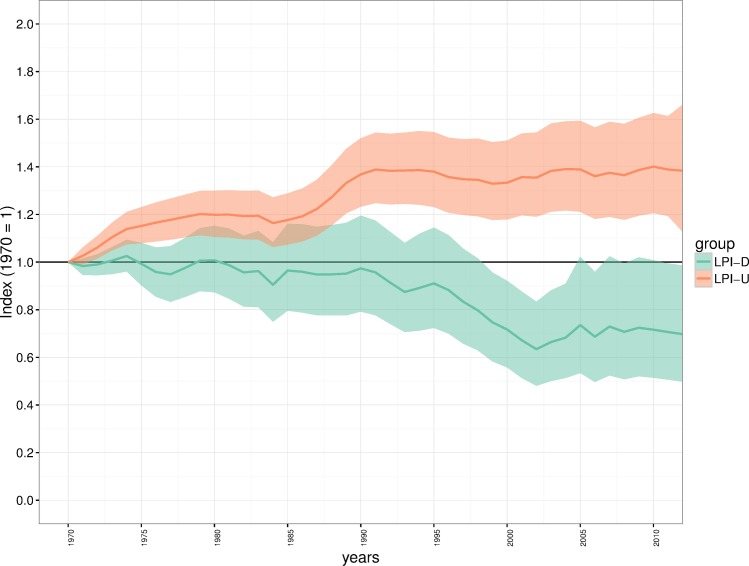
“This result shows a greater rate of decline than the index calculated using the LPI-U approach which has an average annual decline of 0.52% per year and an overall decline of 19.7% (95% CI: -6.6 –-30.9), over the 42-year period.”
§ The Diversity-Weighted Living Planet Index: Controlling for Taxonomic Bias in a Global Biodiversity Indicator > Results > Applying the LPI-D approach to the global living planet index
plain- Asserted: passes — The authors put it forward as true.
- Checkable: passes — It can be checked against evidence.
- Load-bearing: unclear — It is unclear whether the paper’s conclusions depend on it.
- Based: passes — The paper gives a reason why it holds.
A result the paper reports from its own data — it cites no other source for it, so there is none to check. The quote shows it is in the paper.
In the paper
“We find that Critically Endangered reptiles are significantly over-represented, along with Least Concern birds and amphibians, and Near Threatened/Lower Risk reptiles and fishes.”
§ The Diversity-Weighted Living Planet Index: Controlling for Taxonomic Bias in a Global Biodiversity Indicator > Results > Representation of threatened species
plaincorrelational- Asserted: passes — The authors put it forward as true.
- Checkable: passes — It can be checked against evidence.
- Load-bearing: passes — The paper’s conclusions depend on it.
- Based: passes — The paper gives a reason why it holds.
A result the paper reports from its own data — it cites no other source for it, so there is none to check. The quote shows it is in the paper.
In the paper
“We find that Critically Endangered reptiles are significantly over-represented, along with Least Concern birds and amphibians, and Near Threatened/Lower Risk reptiles and fishes.”
§ The Diversity-Weighted Living Planet Index: Controlling for Taxonomic Bias in a Global Biodiversity Indicator > Results > Representation of threatened species
plaincorrelational- Asserted: passes — The authors put it forward as true.
- Checkable: passes — It can be checked against evidence.
- Load-bearing: passes — The paper’s conclusions depend on it.
- Based: passes — The paper gives a reason why it holds.
A result the paper reports from its own data — it cites no other source for it, so there is none to check. The quote shows it is in the paper.
In the paper
“When we subsetted the threatened species to include only those that have been assessed under Criterion A (a reduction in population size), we found more significance in the results between the proportions in the LPI and the IUCN Red List (S9 Table). All three threat categories are significantly over-represented for mammals, reptiles and fishes.”
§ The Diversity-Weighted Living Planet Index: Controlling for Taxonomic Bias in a Global Biodiversity Indicator > Results > Representation of threatened species
plaincorrelational- Asserted: passes — The authors put it forward as true.
- Checkable: passes — It can be checked against evidence.
- Load-bearing: passes — The paper’s conclusions depend on it.
- Based: passes — The paper gives a reason why it holds.
A result the paper reports from its own data — it cites no other source for it, so there is none to check. The quote shows it is in the paper.
In the paper
“| Terrestrial | 0.621 | 0.485–0.796 | 0.848 | 0.702–1.02 |”
§ The Diversity-Weighted Living Planet Index: Controlling for Taxonomic Bias in a Global Biodiversity Indicator > Results > System trends: terrestrial, freshwater and marine
plain- Asserted: passes — The authors put it forward as true.
- Checkable: passes — It can be checked against evidence.
- Load-bearing: unclear — It is unclear whether the paper’s conclusions depend on it.
- Based: passes — The paper gives a reason why it holds.
A result the paper reports from its own data — it cites no other source for it, so there is none to check. The quote shows it is in the paper.
In the paper
“The significantly under-represented groups are Near Threatened/Lower Risk birds, Least Concern reptiles and fishes, Endangered amphibians and fishes, and Vulnerable birds and amphibians.”
§ The Diversity-Weighted Living Planet Index: Controlling for Taxonomic Bias in a Global Biodiversity Indicator > Results > Representation of threatened species
plaincorrelational- Asserted: passes — The authors put it forward as true.
- Checkable: passes — It can be checked against evidence.
- Load-bearing: passes — The paper’s conclusions depend on it.
- Based: passes — The paper gives a reason why it holds.
A result the paper reports from its own data — it cites no other source for it, so there is none to check. The quote shows it is in the paper.
In the paper
“Critically endangered and Endangered birds are significantly over-represented whereas Vulnerable birds are significantly under-represented.”
§ The Diversity-Weighted Living Planet Index: Controlling for Taxonomic Bias in a Global Biodiversity Indicator > Results > Representation of threatened species
plaincorrelational- Asserted: passes — The authors put it forward as true.
- Checkable: passes — It can be checked against evidence.
- Load-bearing: passes — The paper’s conclusions depend on it.
- Based: passes — The paper gives a reason why it holds.
A result the paper reports from its own data — it cites no other source for it, so there is none to check. The quote shows it is in the paper.
In the paper
“The confidence intervals around the LPI-U index are slightly wider than the LPI-D index illustrating greater uncertainty in the trend since 1970.”
§ The Diversity-Weighted Living Planet Index: Controlling for Taxonomic Bias in a Global Biodiversity Indicator > Results > Applying the LPI-D approach to the global living planet index
plaincorrelational- Asserted: passes — The authors put it forward as true.
- Checkable: passes — It can be checked against evidence.
- Load-bearing: unclear — It is unclear whether the paper’s conclusions depend on it.
- Based: passes — The paper gives a reason why it holds.
A result the paper reports from its own data — it cites no other source for it, so there is none to check. The quote shows it is in the paper.
In the paper
“Critically endangered and Endangered birds are significantly over-represented whereas Vulnerable birds are significantly under-represented.”
§ The Diversity-Weighted Living Planet Index: Controlling for Taxonomic Bias in a Global Biodiversity Indicator > Results > Representation of threatened species
plaincorrelational- Asserted: passes — The authors put it forward as true.
- Checkable: passes — It can be checked against evidence.
- Load-bearing: passes — The paper’s conclusions depend on it.
- Based: passes — The paper gives a reason why it holds.
A result the paper reports from its own data — it cites no other source for it, so there is none to check. The quote shows it is in the paper.
In the paper
“| Terrestrial | 0.621 | 0.485–0.796 | 0.848 | 0.702–1.02 |”
§ The Diversity-Weighted Living Planet Index: Controlling for Taxonomic Bias in a Global Biodiversity Indicator > Results > System trends: terrestrial, freshwater and marine
plain- Asserted: passes — The authors put it forward as true.
- Checkable: passes — It can be checked against evidence.
- Load-bearing: unclear — It is unclear whether the paper’s conclusions depend on it.
- Based: passes — The paper gives a reason why it holds.
A result the paper reports from its own data — it cites no other source for it, so there is none to check. The quote shows it is in the paper.
In the paper
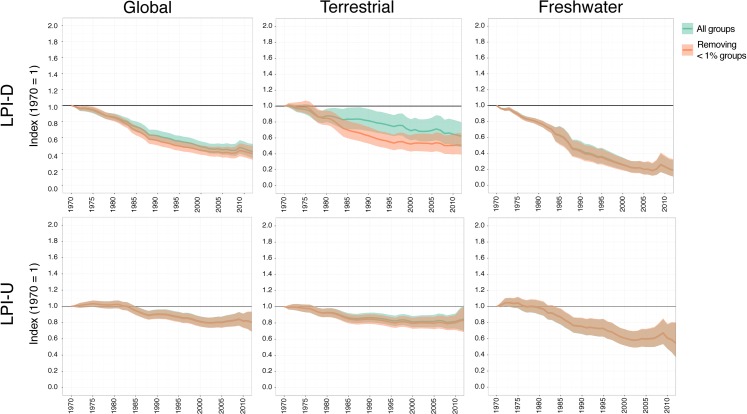
“The exception is the Freshwater LPI-U index where there is a very marginal increase in the trend.”
§ The Diversity-Weighted Living Planet Index: Controlling for Taxonomic Bias in a Global Biodiversity Indicator > Results > The impact of low-representation groups
plaindirect- Asserted: passes — The authors put it forward as true.
- Checkable: passes — It can be checked against evidence.
- Load-bearing: unclear — It is unclear whether the paper’s conclusions depend on it.
- Based: passes — The paper gives a reason why it holds.
A result the paper reports from its own data — it cites no other source for it, so there is none to check. The quote shows it is in the paper.
In the paper
“| Marine | 0.644 | 0.513–0.805 | 1.125 | 0.940–1.336 |”
§ The Diversity-Weighted Living Planet Index: Controlling for Taxonomic Bias in a Global Biodiversity Indicator > Results > System trends: terrestrial, freshwater and marine
plain- Asserted: passes — The authors put it forward as true.
- Checkable: passes — It can be checked against evidence.
- Load-bearing: unclear — It is unclear whether the paper’s conclusions depend on it.
- Based: passes — The paper gives a reason why it holds.
A result the paper reports from its own data — it cites no other source for it, so there is none to check. The quote shows it is in the paper.
In the paper
“As no groups within the marine realm have < 1% representation, we only present the differences in global, freshwater and terrestrial indices.”
§ The Diversity-Weighted Living Planet Index: Controlling for Taxonomic Bias in a Global Biodiversity Indicator > Results > The impact of low-representation groups
plain- Asserted: passes — The authors put it forward as true.
- Checkable: passes — It can be checked against evidence.
- Load-bearing: passes — The paper’s conclusions depend on it.
- Based: passes — The paper gives a reason why it holds.
A result the paper reports from its own data — it cites no other source for it, so there is none to check. The quote shows it is in the paper.
In the paper
“We find that Critically Endangered reptiles are significantly over-represented, along with Least Concern birds and amphibians, and Near Threatened/Lower Risk reptiles and fishes.”
§ The Diversity-Weighted Living Planet Index: Controlling for Taxonomic Bias in a Global Biodiversity Indicator > Results > Representation of threatened species
plaincorrelational- Asserted: passes — The authors put it forward as true.
- Checkable: passes — It can be checked against evidence.
- Load-bearing: passes — The paper’s conclusions depend on it.
- Based: passes — The paper gives a reason why it holds.
A result the paper reports from its own data — it cites no other source for it, so there is none to check. The quote shows it is in the paper.
In the paper
“Comparing the proportion of species from each IUCN Red List category in the Living Planet Database with all assessed species on the IUCN Red List revealed some significant results for both threatened (CR, EN, VU) and non-threatened (NT/LR, LC) categories (Table 2).”
§ The Diversity-Weighted Living Planet Index: Controlling for Taxonomic Bias in a Global Biodiversity Indicator > Results > Representation of threatened species
hedgedcorrelational- Asserted: passes — The authors put it forward as true.
- Checkable: passes — It can be checked against evidence.
- Load-bearing: passes — The paper’s conclusions depend on it.
- Based: passes — The paper gives a reason why it holds.
A result the paper reports from its own data — it cites no other source for it, so there is none to check. The quote shows it is in the paper.
In the paper
“The significantly under-represented groups are Near Threatened/Lower Risk birds, Least Concern reptiles and fishes, Endangered amphibians and fishes, and Vulnerable birds and amphibians.”
§ The Diversity-Weighted Living Planet Index: Controlling for Taxonomic Bias in a Global Biodiversity Indicator > Results > Representation of threatened species
plaincorrelational- Asserted: passes — The authors put it forward as true.
- Checkable: passes — It can be checked against evidence.
- Load-bearing: passes — The paper’s conclusions depend on it.
- Based: passes — The paper gives a reason why it holds.
A result the paper reports from its own data — it cites no other source for it, so there is none to check. The quote shows it is in the paper.
In the paper
“| Freshwater | 0.185 | 0.107–0.315 | 0.544 | 0.371–0.795 |”
§ The Diversity-Weighted Living Planet Index: Controlling for Taxonomic Bias in a Global Biodiversity Indicator > Results > System trends: terrestrial, freshwater and marine
plain- Asserted: passes — The authors put it forward as true.
- Checkable: passes — It can be checked against evidence.
- Load-bearing: unclear — It is unclear whether the paper’s conclusions depend on it.
- Based: passes — The paper gives a reason why it holds.
A result the paper reports from its own data — it cites no other source for it, so there is none to check. The quote shows it is in the paper.
In the paper
“In both weighted and unweighted cases for each index, no significant difference is seen when groups with less than 1% representation are removed.”
§ The Diversity-Weighted Living Planet Index: Controlling for Taxonomic Bias in a Global Biodiversity Indicator > Results > The impact of low-representation groups
plain- Asserted: passes — The authors put it forward as true.
- Checkable: passes — It can be checked against evidence.
- Load-bearing: unclear — It is unclear whether the paper’s conclusions depend on it.
- Based: passes — The paper gives a reason why it holds.
A result the paper reports from its own data — it cites no other source for it, so there is none to check. The quote shows it is in the paper.
In the paper
“| Freshwater | 0.185 | 0.107–0.315 | 0.544 | 0.371–0.795 |”
§ The Diversity-Weighted Living Planet Index: Controlling for Taxonomic Bias in a Global Biodiversity Indicator > Results > System trends: terrestrial, freshwater and marine
plain- Asserted: passes — The authors put it forward as true.
- Checkable: passes — It can be checked against evidence.
- Load-bearing: unclear — It is unclear whether the paper’s conclusions depend on it.
- Based: passes — The paper gives a reason why it holds.
A result the paper reports from its own data — it cites no other source for it, so there is none to check. The quote shows it is in the paper.
In the paper
“Using the diversity weighted method (LPI-D), the index for the Palearctic realm shows an overall significant decline of 30.3% (95% CI: -1.4 –-50.2).”
§ The Diversity-Weighted Living Planet Index: Controlling for Taxonomic Bias in a Global Biodiversity Indicator > Results > Impact of diversity weighting at the level of a realm: the palearctic
plain- Asserted: passes — The authors put it forward as true.
- Checkable: passes — It can be checked against evidence.
- Load-bearing: passes — The paper’s conclusions depend on it.
- Based: passes — The paper gives a reason why it holds.
A result the paper reports from its own data — it cites no other source for it, so there is none to check. The quote shows it is in the paper.
In the paper
“The significantly under-represented groups are Near Threatened/Lower Risk birds, Least Concern reptiles and fishes, Endangered amphibians and fishes, and Vulnerable birds and amphibians.”
§ The Diversity-Weighted Living Planet Index: Controlling for Taxonomic Bias in a Global Biodiversity Indicator > Results > Representation of threatened species
plaincorrelational- Asserted: passes — The authors put it forward as true.
- Checkable: passes — It can be checked against evidence.
- Load-bearing: passes — The paper’s conclusions depend on it.
- Based: passes — The paper gives a reason why it holds.
The paper states this without a source or data behind it here, so there is nothing to check it against. The quote shows it is in the paper.
In the paper
“The global index produced using the LPI-D approach shows a decline of 58% (95% CI: -48.3 –-66.0) between 1970 and 2012 (Fig 5) which equates to an average annual decline of 2% per year.”
§ The Diversity-Weighted Living Planet Index: Controlling for Taxonomic Bias in a Global Biodiversity Indicator > Results > Applying the LPI-D approach to the global living planet index
plain- Asserted: passes — The authors put it forward as true.
- Checkable: passes — It can be checked against evidence.
- Load-bearing: passes — The paper’s conclusions depend on it.
- Based: passes — The paper gives a reason why it holds.
A result the paper reports from its own data — it cites no other source for it, so there is none to check. The quote shows it is in the paper.
In the paper
“None of the categories for mammals showed significant over- or under- representation.”
§ The Diversity-Weighted Living Planet Index: Controlling for Taxonomic Bias in a Global Biodiversity Indicator > Results > Representation of threatened species
plain- Asserted: passes — The authors put it forward as true.
- Checkable: passes — It can be checked against evidence.
- Load-bearing: unclear — It is unclear whether the paper’s conclusions depend on it.
- Based: passes — The paper gives a reason why it holds.
A result the paper reports from its own data — it cites no other source for it, so there is none to check. The quote shows it is in the paper.
In the paper
“We find that Critically Endangered reptiles are significantly over-represented, along with Least Concern birds and amphibians, and Near Threatened/Lower Risk reptiles and fishes.”
§ The Diversity-Weighted Living Planet Index: Controlling for Taxonomic Bias in a Global Biodiversity Indicator > Results > Representation of threatened species
plaincorrelational- Asserted: passes — The authors put it forward as true.
- Checkable: passes — It can be checked against evidence.
- Load-bearing: passes — The paper’s conclusions depend on it.
- Based: passes — The paper gives a reason why it holds.
A result the paper reports from its own data — it cites no other source for it, so there is none to check. The quote shows it is in the paper.
In the paper
“The significantly under-represented groups are Near Threatened/Lower Risk birds, Least Concern reptiles and fishes, Endangered amphibians and fishes, and Vulnerable birds and amphibians.”
§ The Diversity-Weighted Living Planet Index: Controlling for Taxonomic Bias in a Global Biodiversity Indicator > Results > Representation of threatened species
plaincorrelational- Asserted: passes — The authors put it forward as true.
- Checkable: passes — It can be checked against evidence.
- Load-bearing: passes — The paper’s conclusions depend on it.
- Based: passes — The paper gives a reason why it holds.
A result the paper reports from its own data — it cites no other source for it, so there is none to check. The quote shows it is in the paper.
In the paper
“In general, the diversity weighted approach does not have a significant impact on the effect of removing these groups.”
§ The Diversity-Weighted Living Planet Index: Controlling for Taxonomic Bias in a Global Biodiversity Indicator > Results > The impact of low-representation groups
plain- Asserted: passes — The authors put it forward as true.
- Checkable: passes — It can be checked against evidence.
- Load-bearing: unclear — It is unclear whether the paper’s conclusions depend on it.
- Based: passes — The paper gives a reason why it holds.
A result the paper reports from its own data — it cites no other source for it, so there is none to check. The quote shows it is in the paper.
In the paper
“The significantly under-represented groups are Near Threatened/Lower Risk birds, Least Concern reptiles and fishes, Endangered amphibians and fishes, and Vulnerable birds and amphibians.”
§ The Diversity-Weighted Living Planet Index: Controlling for Taxonomic Bias in a Global Biodiversity Indicator > Results > Representation of threatened species
plaincorrelational- Asserted: passes — The authors put it forward as true.
- Checkable: passes — It can be checked against evidence.
- Load-bearing: passes — The paper’s conclusions depend on it.
- Based: passes — The paper gives a reason why it holds.
A result the paper reports from its own data — it cites no other source for it, so there is none to check. The quote shows it is in the paper.
In the paper
“| Marine | 0.644 | 0.513–0.805 | 1.125 | 0.940–1.336 |”
§ The Diversity-Weighted Living Planet Index: Controlling for Taxonomic Bias in a Global Biodiversity Indicator > Results > System trends: terrestrial, freshwater and marine
plain- Asserted: passes — The authors put it forward as true.
- Checkable: passes — It can be checked against evidence.
- Load-bearing: unclear — It is unclear whether the paper’s conclusions depend on it.
- Based: passes — The paper gives a reason why it holds.
A result the paper reports from its own data — it cites no other source for it, so there is none to check. The quote shows it is in the paper.
In the paper
“We find that Critically Endangered reptiles are significantly over-represented, along with Least Concern birds and amphibians, and Near Threatened/Lower Risk reptiles and fishes.”
§ The Diversity-Weighted Living Planet Index: Controlling for Taxonomic Bias in a Global Biodiversity Indicator > Results > Representation of threatened species
plaincorrelational- Asserted: passes — The authors put it forward as true.
- Checkable: passes — It can be checked against evidence.
- Load-bearing: passes — The paper’s conclusions depend on it.
- Based: passes — The paper gives a reason why it holds.
A result the paper reports from its own data — it cites no other source for it, so there is none to check. The quote shows it is in the paper.
In the paper
“When an unweighted average is used to calculate the Palearctic index, the group which contains the most species in the LPI database carries the most weight (S6A Table).”
§ The Diversity-Weighted Living Planet Index: Controlling for Taxonomic Bias in a Global Biodiversity Indicator > Results > Impact of diversity weighting at the level of a realm: the palearctic
plaindirect- Asserted: passes — The authors put it forward as true.
- Checkable: passes — It can be checked against evidence.
- Load-bearing: passes — The paper’s conclusions depend on it.
- Based: passes — The paper gives a reason why it holds.
A result the paper reports from its own data — it cites no other source for it, so there is none to check. The quote shows it is in the paper.
In the paper
“Across many of the species groups that are surveyed within the LPD, we see both significant over- and under- representation in comparison to the estimated number of species (S7 Table, S8 Table, Fig 3).”
§ The Diversity-Weighted Living Planet Index: Controlling for Taxonomic Bias in a Global Biodiversity Indicator > Discussion
plaincorrelational- Asserted: passes — The authors put it forward as true.
- Checkable: passes — It can be checked against evidence.
- Load-bearing: passes — The paper’s conclusions depend on it.
- Based: passes — The paper gives a reason why it holds.
A result the paper reports from its own data — it cites no other source for it, so there is none to check. The quote shows it is in the paper.
In the paper
“Using the unweighted method (LPI-U) the index for the Palearctic realm shows an overall significant increase of 38.4% (95% CI: 12.7–66.2) over the period 1970–2012 (Fig 4).”
§ The Diversity-Weighted Living Planet Index: Controlling for Taxonomic Bias in a Global Biodiversity Indicator > Results > Impact of diversity weighting at the level of a realm: the palearctic
plaindirect- Asserted: passes — The authors put it forward as true.
- Checkable: passes — It can be checked against evidence.
- Load-bearing: passes — The paper’s conclusions depend on it.
- Based: passes — The paper gives a reason why it holds.
A result the paper reports from its own data — it cites no other source for it, so there is none to check. The quote shows it is in the paper.
In the paper
“The significantly under-represented groups are Near Threatened/Lower Risk birds, Least Concern reptiles and fishes, Endangered amphibians and fishes, and Vulnerable birds and amphibians.”
§ The Diversity-Weighted Living Planet Index: Controlling for Taxonomic Bias in a Global Biodiversity Indicator > Results > Representation of threatened species
plaincorrelational- Asserted: passes — The authors put it forward as true.
- Checkable: passes — It can be checked against evidence.
- Load-bearing: passes — The paper’s conclusions depend on it.
- Based: passes — The paper gives a reason why it holds.
A result the paper reports from its own data — it cites no other source for it, so there is none to check. The quote shows it is in the paper.
In the paper
“There were no significant results for amphibians.”
§ The Diversity-Weighted Living Planet Index: Controlling for Taxonomic Bias in a Global Biodiversity Indicator > Results > Representation of threatened species
plain- Asserted: passes — The authors put it forward as true.
- Checkable: passes — It can be checked against evidence.
- Load-bearing: unclear — It is unclear whether the paper’s conclusions depend on it.
- Based: passes — The paper gives a reason why it holds.
A result the paper reports from its own data — it cites no other source for it, so there is none to check. The quote shows it is in the paper.
In the paper
“The significantly under-represented groups are Near Threatened/Lower Risk birds, Least Concern reptiles and fishes, Endangered amphibians and fishes, and Vulnerable birds and amphibians.”
§ The Diversity-Weighted Living Planet Index: Controlling for Taxonomic Bias in a Global Biodiversity Indicator > Results > Representation of threatened species
plaincorrelational- Asserted: passes — The authors put it forward as true.
- Checkable: passes — It can be checked against evidence.
- Load-bearing: passes — The paper’s conclusions depend on it.
- Based: passes — The paper gives a reason why it holds.
A result the paper reports from its own data — it cites no other source for it, so there is none to check. The quote shows it is in the paper.
In the paper
“However, we note that when we remove those species groups for which we have very little data (< 1% species), the overall trends decline more (Fig 7), potentially suggesting that overall declines may be worse than we currently present.”
§ The Diversity-Weighted Living Planet Index: Controlling for Taxonomic Bias in a Global Biodiversity Indicator > Discussion
hedgeddirect- Asserted: passes — The authors put it forward as true.
- Checkable: passes — It can be checked against evidence.
- Load-bearing: passes — The paper’s conclusions depend on it.
- Based: passes — The paper gives a reason why it holds.
None of the sources cited for this claim have been checked yet.
In the paper
“However, no indicator of this kind yet exists which has a global extent and covers taxonomic groups beyond birds and butterflies [15,16].”
§ The Diversity-Weighted Living Planet Index: Controlling for Taxonomic Bias in a Global Biodiversity Indicator > Introduction
What the sources say
- Not checked yetcites [15] RD Gregory, 2005, Developing indicators for European birds, Philosophical Transactions of the Royal Society of London B: Biological Sciences source
- Not checked yetcites [16] CAM van Swaay, 2008, Butterfly monitoring in Europe: methods, applications and perspectives, Biodiversity and Conservation source
plain- Asserted: passes — The authors put it forward as true.
- Checkable: passes — It can be checked against evidence.
- Load-bearing: passes — The paper’s conclusions depend on it.
- Based: passes — The paper gives a reason why it holds.
A conclusion the paper draws from its own results — it cites no other source for it, so there is none to check. The quote shows it is in the paper.
In the paper
“These results not only show starker declines than previously estimated, but suggests that those species for which there is poorer data coverage may be declining more rapidly.”
§ The Diversity-Weighted Living Planet Index: Controlling for Taxonomic Bias in a Global Biodiversity Indicator > Abstract
hedgedconditional- Asserted: passes — The authors put it forward as true.
- Checkable: passes — It can be checked against evidence.
- Load-bearing: passes — The paper’s conclusions depend on it.
- Based: passes — The paper gives a reason why it holds.
In the paper
“However, its reliance on available data means there is bias in the LPD resulting from the taxonomic and geographical distribution of the data used [8].”
§ The Diversity-Weighted Living Planet Index: Controlling for Taxonomic Bias in a Global Biodiversity Indicator > Introduction
What the sources say
- Not checked yetcites [8] B Collen, 2009, Monitoring Change in Vertebrate Abundance: the Living Planet Index, Conservation Biology source
plaindirect- Asserted: passes — The authors put it forward as true.
- Checkable: passes — It can be checked against evidence.
- Load-bearing: passes — The paper’s conclusions depend on it.
- Based: passes — The paper gives a reason why it holds.
A conclusion the paper draws from its own results — it cites no other source for it, so there is none to check. The quote shows it is in the paper.
In the paper
“However the impact may be partially tempered by the proportional weighting at taxonomic group level.”
§ The Diversity-Weighted Living Planet Index: Controlling for Taxonomic Bias in a Global Biodiversity Indicator > Discussion
hedgedconditional- Asserted: passes — The authors put it forward as true.
- Checkable: passes — It can be checked against evidence.
- Load-bearing: passes — The paper’s conclusions depend on it.
- Based: passes — The paper gives a reason why it holds.
A conclusion the paper draws from its own results — it cites no other source for it, so there is none to check. The quote shows it is in the paper.
In the paper
“As well as addressing taxonomic disparity in the data set, the LPI-D approach accounts for the broad scale geographic bias present in the LPD by placing more weight on the largely tropical, more species-rich realms.”
§ The Diversity-Weighted Living Planet Index: Controlling for Taxonomic Bias in a Global Biodiversity Indicator > Discussion
plaindirect- Asserted: passes — The authors put it forward as true.
- Checkable: passes — It can be checked against evidence.
- Load-bearing: passes — The paper’s conclusions depend on it.
- Based: passes — The paper gives a reason why it holds.
A conclusion the paper draws from its own results — it cites no other source for it, so there is none to check. The quote shows it is in the paper.
In the paper
“However, issues of coverage still remain at smaller spatial scales which this approach does not tackle.”
§ The Diversity-Weighted Living Planet Index: Controlling for Taxonomic Bias in a Global Biodiversity Indicator > Discussion
plain- Asserted: passes — The authors put it forward as true.
- Checkable: passes — It can be checked against evidence.
- Load-bearing: unclear — It is unclear whether the paper’s conclusions depend on it.
- Based: passes — The paper gives a reason why it holds.
A conclusion the paper draws from its own results — it cites no other source for it, so there is none to check. The quote shows it is in the paper.
In the paper
“Declines appear to be masked in the LPI-U as a result of a high proportion of well monitored, increasing populations in temperate regions in the data set.”
§ The Diversity-Weighted Living Planet Index: Controlling for Taxonomic Bias in a Global Biodiversity Indicator > Discussion
hedgeddirect- Asserted: passes — The authors put it forward as true.
- Checkable: passes — It can be checked against evidence.
- Load-bearing: passes — The paper’s conclusions depend on it.
- Based: passes — The paper gives a reason why it holds.
In the paper
“However, it necessarily suffers from a variety of publication biases arising for reasons such as lack of resources or infrastructure for monitoring, logistical difficulties in accessing sites or barriers to the dissemination of data into the public realm [12].”
§ The Diversity-Weighted Living Planet Index: Controlling for Taxonomic Bias in a Global Biodiversity Indicator > Discussion
What the sources say
- Not checked yetcites [12] B Collen, 2008, The tropical biodiversity data gap: addressing disparity in global monitoring, Tropical Conservation Science source
plaindirect- Asserted: passes — The authors put it forward as true.
- Checkable: passes — It can be checked against evidence.
- Load-bearing: passes — The paper’s conclusions depend on it.
- Based: passes — The paper gives a reason why it holds.
A conclusion the paper draws from its own results — it cites no other source for it, so there is none to check. The quote shows it is in the paper.
In the paper
“Accounting for the diversity of species using the LPI-D method allows the LPI to be calculated in a more taxonomically representative way.”
§ The Diversity-Weighted Living Planet Index: Controlling for Taxonomic Bias in a Global Biodiversity Indicator > Discussion
plaindirect- Asserted: passes — The authors put it forward as true.
- Checkable: passes — It can be checked against evidence.
- Load-bearing: passes — The paper’s conclusions depend on it.
- Based: passes — The paper gives a reason why it holds.
None of the sources cited for this claim have been checked yet.
In the paper
“This is exacerbated by a tendency for monitoring to occur in areas where scientists live and work [21,32].”
§ The Diversity-Weighted Living Planet Index: Controlling for Taxonomic Bias in a Global Biodiversity Indicator > Discussion
What the sources say
- Not checked yetcites [21] LJ Martin, 2012, Mapping where ecologists work: biases in the global distribution of terrestrial ecological observations, Frontiers in Ecology and the Environment source
- Not checked yetcites [32] P Pyšek, Geographical and taxonomic biases in invasion ecology, Trends in Ecology & Evolution source
plaindirect- Asserted: passes — The authors put it forward as true.
- Checkable: passes — It can be checked against evidence.
- Load-bearing: unclear — It is unclear whether the paper’s conclusions depend on it.
- Based: passes — The paper gives a reason why it holds.
A conclusion the paper draws from its own results — it cites no other source for it, so there is none to check. The quote shows it is in the paper.
In the paper
“Weighting by species diversity in the LPI-D thus distributes the responsibility for the index across regions and taxa according to species richness.”
§ The Diversity-Weighted Living Planet Index: Controlling for Taxonomic Bias in a Global Biodiversity Indicator > Discussion
plaindirect- Asserted: passes — The authors put it forward as true.
- Checkable: passes — It can be checked against evidence.
- Load-bearing: passes — The paper’s conclusions depend on it.
- Based: passes — The paper gives a reason why it holds.
A conclusion the paper draws from its own results — it cites no other source for it, so there is none to check. The quote shows it is in the paper.
In the paper
“More specifically, trends that equally weight these species groups (as in the ‘traditional’ Living Planet Index) will be significantly biased by the disproportionate representation of these groups, skewing the calculation of trends in global wildlife abundance.”
§ The Diversity-Weighted Living Planet Index: Controlling for Taxonomic Bias in a Global Biodiversity Indicator > Discussion
plaindirect- Asserted: passes — The authors put it forward as true.
- Checkable: passes — It can be checked against evidence.
- Load-bearing: passes — The paper’s conclusions depend on it.
- Based: passes — The paper gives a reason why it holds.
None of the sources cited for this claim have been checked yet.
In the paper
“While the geographic and taxonomic bias we demonstrate in the LPI is consistent with other studies [8,33] and comparable data sets [21], the spatial mismatch between the known diversity of vertebrate species and the available data (Fig 2) could lead to inaccurate estimates of status and trends in biodiversity.”
§ The Diversity-Weighted Living Planet Index: Controlling for Taxonomic Bias in a Global Biodiversity Indicator > Discussion
What the sources say
- Not checked yetcites [8] B Collen, 2009, Monitoring Change in Vertebrate Abundance: the Living Planet Index, Conservation Biology source
- Not checked yetcites [33] V Proença, Global biodiversity monitoring: From data sources to Essential Biodiversity Variables, Biological Conservation
- Not checked yetcites [21] LJ Martin, 2012, Mapping where ecologists work: biases in the global distribution of terrestrial ecological observations, Frontiers in Ecology and the Environment source
hedgedconditional- Asserted: passes — The authors put it forward as true.
- Checkable: passes — It can be checked against evidence.
- Load-bearing: passes — The paper’s conclusions depend on it.
- Based: passes — The paper gives a reason why it holds.
A conclusion the paper draws from its own results — it cites no other source for it, so there is none to check. The quote shows it is in the paper.
In the paper
“However, we note that when we remove those species groups for which we have very little data (< 1% species), the overall trends decline more (Fig 7), potentially suggesting that overall declines may be worse than we currently present.”
§ The Diversity-Weighted Living Planet Index: Controlling for Taxonomic Bias in a Global Biodiversity Indicator > Discussion
hedgedconditional- Asserted: passes — The authors put it forward as true.
- Checkable: passes — It can be checked against evidence.
- Load-bearing: passes — The paper’s conclusions depend on it.
- Based: passes — The paper gives a reason why it holds.
In the paper
“For example we know that tropical vertebrate populations are in worse decline than those in temperate regions [45] and that amphibians are threatened with a greater risk of extinction than mammals or birds [46].”
§ The Diversity-Weighted Living Planet Index: Controlling for Taxonomic Bias in a Global Biodiversity Indicator > Discussion
What the sources say
- Not checked yetcites [45] McRae L, Freeman R, Deinet S (2014) 'The Living Planet Index' in: Living Planet Report 2014: species and spaces, people and places WWF, Gland, Switzerland.
boostedcorrelational- Asserted: passes — The authors put it forward as true.
- Checkable: passes — It can be checked against evidence.
- Load-bearing: passes — The paper’s conclusions depend on it.
- Based: passes — The paper gives a reason why it holds.
A conclusion the paper draws from its own results — it cites no other source for it, so there is none to check. The quote shows it is in the paper.
In the paper
“Our analysis suggests that prior estimates of the trends in global wildlife populations may have underestimated their global decline.”
§ The Diversity-Weighted Living Planet Index: Controlling for Taxonomic Bias in a Global Biodiversity Indicator > Discussion
hedgedconditional- Asserted: passes — The authors put it forward as true.
- Checkable: passes — It can be checked against evidence.
- Load-bearing: passes — The paper’s conclusions depend on it.
- Based: passes — The paper gives a reason why it holds.
A conclusion the paper draws from its own results — it cites no other source for it, so there is none to check. The quote shows it is in the paper.
In the paper
“This appears to be due to those well monitored groups for which we have disproportionate amounts of data (predominantly in the Nearctic and Palearctic) declining less than those species in more speciose regions for which we have proportionally less data.”
§ The Diversity-Weighted Living Planet Index: Controlling for Taxonomic Bias in a Global Biodiversity Indicator > Discussion
hedgeddirect- Asserted: passes — The authors put it forward as true.
- Checkable: passes — It can be checked against evidence.
- Load-bearing: passes — The paper’s conclusions depend on it.
- Based: passes — The paper gives a reason why it holds.
- It may state two separate claims as one. 42
- Probably not a substantial claim. 18
A result the paper reports from its own data — it cites no other source for it, so there is none to check. The quote shows it is in the paper.
In the paper
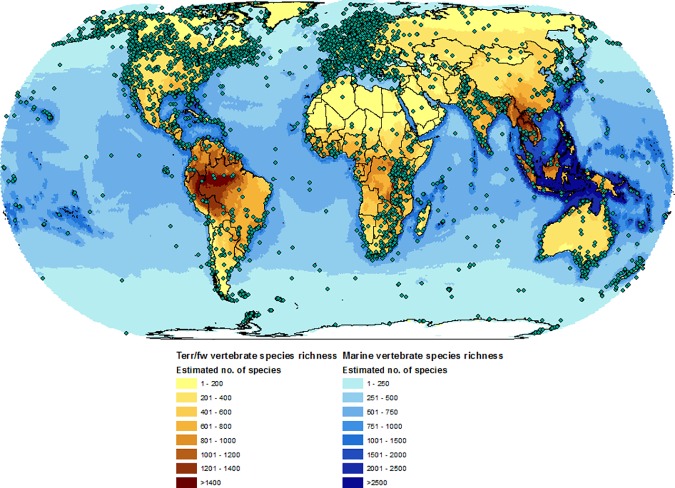
“Global vertebrate richness overlaid with locations of populations currently recorded within the Living Planet Index shows biases towards temperate regions, which the Living Planet Index over-represents, and under-representation of tropical regions (Fig 2).”
§ The Diversity-Weighted Living Planet Index: Controlling for Taxonomic Bias in a Global Biodiversity Indicator > Results > Geographic representation within the living planet index
plaincorrelational- Asserted: passes — The authors put it forward as true.
- Checkable: passes — It can be checked against evidence.
- Load-bearing: passes — The paper’s conclusions depend on it.
- Based: passes — The paper gives a reason why it holds.
It may state two separate claims as one.
A result the paper reports from its own data — it cites no other source for it, so there is none to check. The quote shows it is in the paper.
In the paper
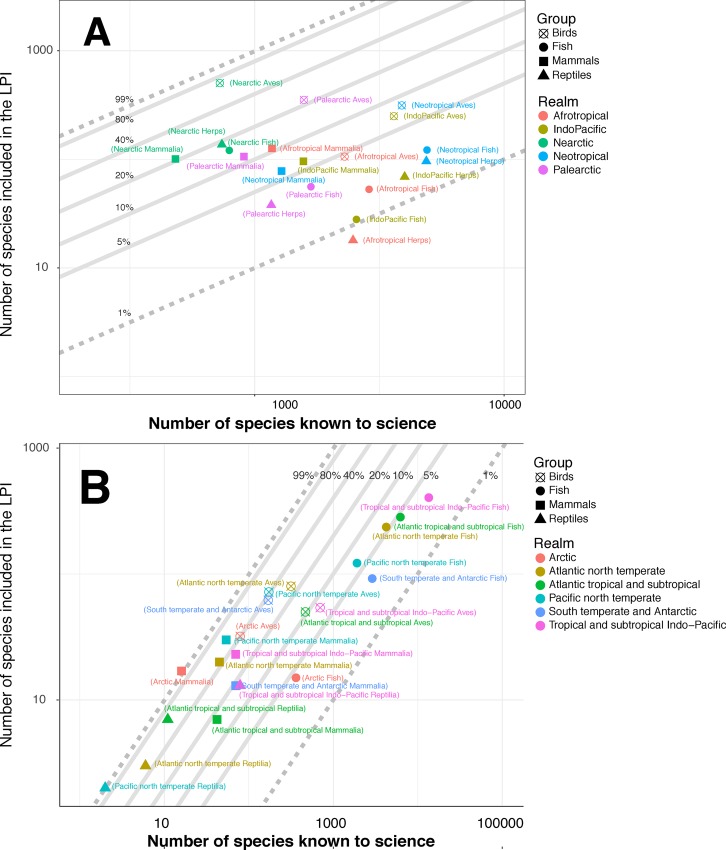
“Afrotropical amphibians and reptiles (‘Afrotropical Herps’) represent less than 1% of known species and South temperate and Antarctic reptiles are currently not represented at all in the LPI database (0%, of a possible 3 species; not shown in figure).”
§ The Diversity-Weighted Living Planet Index: Controlling for Taxonomic Bias in a Global Biodiversity Indicator > Results > Taxonomic representation and bias within the living planet index
plain- Asserted: passes — The authors put it forward as true.
- Checkable: passes — It can be checked against evidence.
- Load-bearing: passes — The paper’s conclusions depend on it.
- Based: passes — The paper gives a reason why it holds.
It may state two separate claims as one.
A result the paper reports from its own data — it cites no other source for it, so there is none to check. The quote shows it is in the paper.
In the paper
“The terrestrial index shows a 37.9% decline (95% CI: -20.4 –-51.5) from 1970 to 2012, averaging at a 1.13% decline per year.”
§ The Diversity-Weighted Living Planet Index: Controlling for Taxonomic Bias in a Global Biodiversity Indicator > Results > System trends: terrestrial, freshwater and marine
plain- Asserted: passes — The authors put it forward as true.
- Checkable: passes — It can be checked against evidence.
- Load-bearing: passes — The paper’s conclusions depend on it.
- Based: passes — The paper gives a reason why it holds.
It may state two separate claims as one.
A result the paper reports from its own data — it cites no other source for it, so there is none to check. The quote shows it is in the paper.
In the paper
“In the marine system, the highest representation of species is for Pacific north temperate reptiles (100%, 2 species).”
§ The Diversity-Weighted Living Planet Index: Controlling for Taxonomic Bias in a Global Biodiversity Indicator > Results > Taxonomic representation and bias within the living planet index
plain- Asserted: passes — The authors put it forward as true.
- Checkable: passes — It can be checked against evidence.
- Load-bearing: fails — The paper’s conclusions may not depend on it.
- Based: passes — The paper gives a reason why it holds.
Probably not a substantial claim. The paper’s conclusions may not depend on it.
A result the paper reports from its own data — it cites no other source for it, so there is none to check. The quote shows it is in the paper.
In the paper
“The freshwater index shows a decline of greater magnitude, 81.5% (95% CI: -68.5 –-89.3) over the 42-year period and an average annual decline of 3.94% per year.”
§ The Diversity-Weighted Living Planet Index: Controlling for Taxonomic Bias in a Global Biodiversity Indicator > Results > System trends: terrestrial, freshwater and marine
plain- Asserted: passes — The authors put it forward as true.
- Checkable: passes — It can be checked against evidence.
- Load-bearing: passes — The paper’s conclusions depend on it.
- Based: passes — The paper gives a reason why it holds.
It may state two separate claims as one.
In the paper
“The pattern of representation in wealthy countries was similar to Martin et al. but overall results were mixed with over- und under-representation of high and low income countries compared to the number of sites expected (S4 Table).”
§ The Diversity-Weighted Living Planet Index: Controlling for Taxonomic Bias in a Global Biodiversity Indicator > Results > Geographic representation within the living planet index
What the sources say
- Not checked yetcites Martin et al.
plaincorrelational- Asserted: passes — The authors put it forward as true.
- Checkable: passes — It can be checked against evidence.
- Load-bearing: unclear — It is unclear whether the paper’s conclusions depend on it.
- Based: passes — The paper gives a reason why it holds.
It may state two separate claims as one.
A result the paper reports from its own data — it cites no other source for it, so there is none to check. The quote shows it is in the paper.
In the paper
“The highest terrestrial and freshwater representation is for Nearctic birds (68%, 492 species out of a possible 725 species) and the lowest is for Afrotropical reptiles and amphibians (0.7%, 18 species of a possible 2,480 species).”
§ The Diversity-Weighted Living Planet Index: Controlling for Taxonomic Bias in a Global Biodiversity Indicator > Results > Taxonomic representation and bias within the living planet index
plain- Asserted: passes — The authors put it forward as true.
- Checkable: passes — It can be checked against evidence.
- Load-bearing: unclear — It is unclear whether the paper’s conclusions depend on it.
- Based: passes — The paper gives a reason why it holds.
It may state two separate claims as one.
A result the paper reports from its own data — it cites no other source for it, so there is none to check. The quote shows it is in the paper.
In the paper
“For the marine system, 6 subsets represent between 1 and 10% and 16 subsets represent 10% or more of known species (S6B Table).”
§ The Diversity-Weighted Living Planet Index: Controlling for Taxonomic Bias in a Global Biodiversity Indicator > Results > Taxonomic representation and bias within the living planet index
plain- Asserted: passes — The authors put it forward as true.
- Checkable: passes — It can be checked against evidence.
- Load-bearing: unclear — It is unclear whether the paper’s conclusions depend on it.
- Based: passes — The paper gives a reason why it holds.
It may state two separate claims as one.
A result the paper reports from its own data — it cites no other source for it, so there is none to check. The quote shows it is in the paper.
In the paper
“The taxonomic groups that are significantly under-represented in each terrestrial and freshwater realm are amphibians and reptiles, as well as fishes, the exception being Nearctic species which are all over-represented.”
§ The Diversity-Weighted Living Planet Index: Controlling for Taxonomic Bias in a Global Biodiversity Indicator > Results > Taxonomic representation and bias within the living planet index
plaincorrelational- Asserted: passes — The authors put it forward as true.
- Checkable: passes — It can be checked against evidence.
- Load-bearing: passes — The paper’s conclusions depend on it.
- Based: passes — The paper gives a reason why it holds.
It may state two separate claims as one.
A result the paper reports from its own data — it cites no other source for it, so there is none to check. The quote shows it is in the paper.
In the paper
“The rate with which new data are incorporated is relatively constant (S1 Fig), as a wealth of data remains available in the literature.”
§ The Diversity-Weighted Living Planet Index: Controlling for Taxonomic Bias in a Global Biodiversity Indicator > Discussion
plain- Asserted: passes — The authors put it forward as true.
- Checkable: passes — It can be checked against evidence.
- Load-bearing: fails — The paper’s conclusions may not depend on it.
- Based: passes — The paper gives a reason why it holds.
Probably not a substantial claim. The paper’s conclusions may not depend on it.
A result the paper reports from its own data — it cites no other source for it, so there is none to check. The quote shows it is in the paper.
In the paper
“The results of the LPI-D approach on the three system indices reveal that each show a greater decline than the LPI-U approach (Fig 6).”
§ The Diversity-Weighted Living Planet Index: Controlling for Taxonomic Bias in a Global Biodiversity Indicator > Results > System trends: terrestrial, freshwater and marine
plaincorrelational- Asserted: passes — The authors put it forward as true.
- Checkable: passes — It can be checked against evidence.
- Load-bearing: passes — The paper’s conclusions depend on it.
- Based: passes — The paper gives a reason why it holds.
It may state two separate claims as one.
A result the paper reports from its own data — it cites no other source for it, so there is none to check. The quote shows it is in the paper.
In the paper
“For marine realms, the significant results for birds, mammals and reptiles show they are over-represented in all realms with the exception of South temperate and Antarctic reptiles where there is no representation of the three species (S8 Table).”
§ The Diversity-Weighted Living Planet Index: Controlling for Taxonomic Bias in a Global Biodiversity Indicator > Results > Taxonomic representation and bias within the living planet index
plaincorrelational- Asserted: passes — The authors put it forward as true.
- Checkable: passes — It can be checked against evidence.
- Load-bearing: unclear — It is unclear whether the paper’s conclusions depend on it.
- Based: passes — The paper gives a reason why it holds.
It may state two separate claims as one.
A result the paper reports from its own data — it cites no other source for it, so there is none to check. The quote shows it is in the paper.
In the paper
“The effect of using proportional weighting means that the influence of the over-represented groups such as birds and mammals has been reduced by over half and almost a fifth respectively, whereas the influence of fishes has been increased by over three-fold and amphibians/reptiles by over two-fold.”
§ The Diversity-Weighted Living Planet Index: Controlling for Taxonomic Bias in a Global Biodiversity Indicator > Results > Impact of diversity weighting at the level of a realm: the palearctic
plaindirect- Asserted: passes — The authors put it forward as true.
- Checkable: passes — It can be checked against evidence.
- Load-bearing: passes — The paper’s conclusions depend on it.
- Based: passes — The paper gives a reason why it holds.
It may state two separate claims as one.
A result the paper reports from its own data — it cites no other source for it, so there is none to check. The quote shows it is in the paper.
In the paper
“Each index shows a greater decline when these groups are removed, which is most noticeable in the Terrestrial LPI-D index but it is not significantly different.”
§ The Diversity-Weighted Living Planet Index: Controlling for Taxonomic Bias in a Global Biodiversity Indicator > Results > The impact of low-representation groups
plain- Asserted: passes — The authors put it forward as true.
- Checkable: passes — It can be checked against evidence.
- Load-bearing: unclear — It is unclear whether the paper’s conclusions depend on it.
- Based: passes — The paper gives a reason why it holds.
It may state two separate claims as one.
A result the paper reports from its own data — it cites no other source for it, so there is none to check. The quote shows it is in the paper.
In the paper
“The difference is also notable at the global level where the LPI-U suggests a decline of 19.7%, compared to a significantly larger declines of 58% in the LPI-D.”
§ The Diversity-Weighted Living Planet Index: Controlling for Taxonomic Bias in a Global Biodiversity Indicator > Discussion
plain- Asserted: passes — The authors put it forward as true.
- Checkable: passes — It can be checked against evidence.
- Load-bearing: passes — The paper’s conclusions depend on it.
- Based: passes — The paper gives a reason why it holds.
It may state two separate claims as one.
A result the paper reports from its own data — it cites no other source for it, so there is none to check. The quote shows it is in the paper.
In the paper
“This weighted approach (LPI-D) suggests that, on average, species populations within the Palearctic may have declined by 30.3% as opposed to increasing in abundance by 38.4% (Fig 4) in the unweighted index (LPI-U).”
§ The Diversity-Weighted Living Planet Index: Controlling for Taxonomic Bias in a Global Biodiversity Indicator > Discussion
hedgedconditional- Asserted: passes — The authors put it forward as true.
- Checkable: passes — It can be checked against evidence.
- Load-bearing: passes — The paper’s conclusions depend on it.
- Based: passes — The paper gives a reason why it holds.
It may state two separate claims as one.
A result the paper reports from its own data — it cites no other source for it, so there is none to check. The quote shows it is in the paper.
In the paper
“This representation is varied with 12 subsets representing between 1 and 10% and 7 subsets representing over 10% of known species in the terrestrial and freshwater systems (S6A Table).”
§ The Diversity-Weighted Living Planet Index: Controlling for Taxonomic Bias in a Global Biodiversity Indicator > Results > Taxonomic representation and bias within the living planet index
plain- Asserted: passes — The authors put it forward as true.
- Checkable: passes — It can be checked against evidence.
- Load-bearing: unclear — It is unclear whether the paper’s conclusions depend on it.
- Based: passes — The paper gives a reason why it holds.
It may state two separate claims as one.
A result the paper reports from its own data — it cites no other source for it, so there is none to check. The quote shows it is in the paper.
In the paper
“The data tend to be over-represented for temperate bird and mammal species, and under-represented for most species groups in tropical realms and for marine fishes.”
§ The Diversity-Weighted Living Planet Index: Controlling for Taxonomic Bias in a Global Biodiversity Indicator > Discussion
plaincorrelational- Asserted: passes — The authors put it forward as true.
- Checkable: passes — It can be checked against evidence.
- Load-bearing: passes — The paper’s conclusions depend on it.
- Based: passes — The paper gives a reason why it holds.
It may state two separate claims as one.
The paper states this without a source or data behind it here, so there is nothing to check it against. The quote shows it is in the paper.
In the paper
“Likewise in the Afrotropics, eastern and southern Africa are better represented than western and central Africa.”
§ The Diversity-Weighted Living Planet Index: Controlling for Taxonomic Bias in a Global Biodiversity Indicator > Discussion
plaincorrelational- Asserted: passes — The authors put it forward as true.
- Checkable: passes — It can be checked against evidence.
- Load-bearing: fails — The paper’s conclusions may not depend on it.
- Based: fails — The paper may give no reason why it holds.
Probably not a substantial claim. The paper’s conclusions may not depend on it. The paper may give no reason why it holds.
None of the sources cited for this claim have been checked yet.
In the paper
“For the marine system, data tend to be clustered near the coasts which is where most known impact from human activity occurs [41] but also the areas of higher species richness [42].”
§ The Diversity-Weighted Living Planet Index: Controlling for Taxonomic Bias in a Global Biodiversity Indicator > Discussion
What the sources say
plaincorrelational- Asserted: passes — The authors put it forward as true.
- Checkable: passes — It can be checked against evidence.
- Load-bearing: unclear — It is unclear whether the paper’s conclusions depend on it.
- Based: passes — The paper gives a reason why it holds.
It may state two separate claims as one.
The paper states this without a source or data behind it here, so there is nothing to check it against. The quote shows it is in the paper.
In the paper
“For example, amphibians, which are not significantly over-represented by threatened species, along with reptiles, are given the highest weighting among the terrestrial species and the second highest weighting among freshwater species.”
§ The Diversity-Weighted Living Planet Index: Controlling for Taxonomic Bias in a Global Biodiversity Indicator > Discussion
plain- Asserted: passes — The authors put it forward as true.
- Checkable: passes — It can be checked against evidence.
- Load-bearing: unclear — It is unclear whether the paper’s conclusions depend on it.
- Based: passes — The paper gives a reason why it holds.
It may state two separate claims as one.
A result the paper reports from its own data — it cites no other source for it, so there is none to check. The quote shows it is in the paper.
In the paper
“Compared to the expected number of sites across biomes, the LPI over-represents Tropical deciduous woodland and under-represents Tropical evergreen woodland (S3 Table).”
§ The Diversity-Weighted Living Planet Index: Controlling for Taxonomic Bias in a Global Biodiversity Indicator > Results > Geographic representation within the living planet index
plaincorrelational- Asserted: passes — The authors put it forward as true.
- Checkable: passes — It can be checked against evidence.
- Load-bearing: unclear — It is unclear whether the paper’s conclusions depend on it.
- Based: passes — The paper gives a reason why it holds.
It may state two separate claims as one.
A result the paper reports from its own data — it cites no other source for it, so there is none to check. The quote shows it is in the paper.
In the paper
“For example, the data from the Palearctic realm is largely from Europe and there is much less coverage in Asia (Fig 2).”
§ The Diversity-Weighted Living Planet Index: Controlling for Taxonomic Bias in a Global Biodiversity Indicator > Discussion
plain- Asserted: passes — The authors put it forward as true.
- Checkable: passes — It can be checked against evidence.
- Load-bearing: unclear — It is unclear whether the paper’s conclusions depend on it.
- Based: passes — The paper gives a reason why it holds.
It may state two separate claims as one.
A result the paper reports from its own data — it cites no other source for it, so there is none to check. The quote shows it is in the paper.
In the paper
“When compared to the expected diversity of species across realms, the significant results for birds and mammals show over-representation within terrestrial and freshwater realms with the exception of Afrotropical birds which are under-represented (Binomial test of proportions, see S7 Table).”
§ The Diversity-Weighted Living Planet Index: Controlling for Taxonomic Bias in a Global Biodiversity Indicator > Results > Taxonomic representation and bias within the living planet index
plaincorrelational- Asserted: passes — The authors put it forward as true.
- Checkable: passes — It can be checked against evidence.
- Load-bearing: unclear — It is unclear whether the paper’s conclusions depend on it.
- Based: passes — The paper gives a reason why it holds.
It may state two separate claims as one.
A result the paper reports from its own data — it cites no other source for it, so there is none to check. The quote shows it is in the paper.
In the paper
“We also find a geographic bias in the terrestrial data portion of the LPD towards protected areas, tropical deciduous woodland and some wealthy countries, at the same time as under-representation of tropical evergreen woodland biomes.”
§ The Diversity-Weighted Living Planet Index: Controlling for Taxonomic Bias in a Global Biodiversity Indicator > Discussion
plaincorrelational- Asserted: passes — The authors put it forward as true.
- Checkable: passes — It can be checked against evidence.
- Load-bearing: unclear — It is unclear whether the paper’s conclusions depend on it.
- Based: passes — The paper gives a reason why it holds.
It may state two separate claims as one.
The paper states this without a source or data behind it here, so there is nothing to check it against. The quote shows it is in the paper.
In the paper
“What is also important to note is that the majority of fish species (745 out of 1,369 species) have not yet been assessed by the IUCN Red List and a further 40 species are assessed as Data Deficient so these species were not included in this analysis.”
§ The Diversity-Weighted Living Planet Index: Controlling for Taxonomic Bias in a Global Biodiversity Indicator > Discussion
plaindirect- Asserted: passes — The authors put it forward as true.
- Checkable: passes — It can be checked against evidence.
- Load-bearing: passes — The paper’s conclusions depend on it.
- Based: passes — The paper gives a reason why it holds.
Probably not a substantial claim. It may state two separate claims as one.
A result the paper reports from its own data — it cites no other source for it, so there is none to check. The quote shows it is in the paper.
In the paper
“For values derived from an equal distribution of sites by global area, all other biomes except Tundra are over-represented while results are less clear by an assumed equal distribution among biomes (S3 Table).”
§ The Diversity-Weighted Living Planet Index: Controlling for Taxonomic Bias in a Global Biodiversity Indicator > Results > Geographic representation within the living planet index
plaincorrelational- Asserted: passes — The authors put it forward as true.
- Checkable: passes — It can be checked against evidence.
- Load-bearing: unclear — It is unclear whether the paper’s conclusions depend on it.
- Based: passes — The paper gives a reason why it holds.
It may state two separate claims as one.
A result the paper reports from its own data — it cites no other source for it, so there is none to check. The quote shows it is in the paper.
In the paper
“Fishes are a significantly under-represented group in the tropical and south temperate marine realms but are significantly over-represented in the Pacific north temperate.”
§ The Diversity-Weighted Living Planet Index: Controlling for Taxonomic Bias in a Global Biodiversity Indicator > Results > Taxonomic representation and bias within the living planet index
plaincorrelational- Asserted: passes — The authors put it forward as true.
- Checkable: passes — It can be checked against evidence.
- Load-bearing: passes — The paper’s conclusions depend on it.
- Based: passes — The paper gives a reason why it holds.
It may state two separate claims as one.
A result the paper reports from its own data — it cites no other source for it, so there is none to check. The quote shows it is in the paper.
In the paper
“The marine index shows a similar decline of 35.6% (95% CI: -19.5 –-48.8) over the same period, with an average annual decline of 1.04% per year.”
§ The Diversity-Weighted Living Planet Index: Controlling for Taxonomic Bias in a Global Biodiversity Indicator > Results > System trends: terrestrial, freshwater and marine
plain- Asserted: passes — The authors put it forward as true.
- Checkable: passes — It can be checked against evidence.
- Load-bearing: passes — The paper’s conclusions depend on it.
- Based: passes — The paper gives a reason why it holds.
It may state two separate claims as one.
A result the paper reports from its own data — it cites no other source for it, so there is none to check. The quote shows it is in the paper.
In the paper
“The LPI-D index for the Palearctic realm shows wider confidence intervals than the LPI-U index as well as a more undulating trend.”
§ The Diversity-Weighted Living Planet Index: Controlling for Taxonomic Bias in a Global Biodiversity Indicator > Results > Impact of diversity weighting at the level of a realm: the palearctic
plaincorrelational- Asserted: passes — The authors put it forward as true.
- Checkable: passes — It can be checked against evidence.
- Load-bearing: unclear — It is unclear whether the paper’s conclusions depend on it.
- Based: passes — The paper gives a reason why it holds.
It may state two separate claims as one.
None of the sources cited for this claim have been checked yet.
In the paper
“These types of bias are a common feature of other global biodiversity databases [10,11], usually with a noticeable gap in data from tropical regions [12].”
§ The Diversity-Weighted Living Planet Index: Controlling for Taxonomic Bias in a Global Biodiversity Indicator > Introduction
What the sources say
- Not checked yetcites [10] EH Boakes, 2010, Distorted Views of Biodiversity: Spatial and Temporal Bias in Species Occurrence Data, PLoS Biol source
- Not checked yetcites [11] C Yesson, 2007, How Global Is the Global Biodiversity Information Facility?, PLoS ONE source
- Not checked yetcites [12] B Collen, 2008, The tropical biodiversity data gap: addressing disparity in global monitoring, Tropical Conservation Science source
plaincorrelational- Asserted: passes — The authors put it forward as true.
- Checkable: passes — It can be checked against evidence.
- Load-bearing: fails — The paper’s conclusions may not depend on it.
- Based: passes — The paper gives a reason why it holds.
Probably not a substantial claim. The paper’s conclusions may not depend on it. It may state two separate claims as one.
None of the sources cited for this claim have been checked yet.
In the paper
“Furthermore, the performance of biodiversity indicators such as the LPI can be compromised by the presence of bias in the data and limited in effectiveness as tools in measuring progress towards specific policy targets [1,14].”
§ The Diversity-Weighted Living Planet Index: Controlling for Taxonomic Bias in a Global Biodiversity Indicator > Introduction
What the sources say
plaindirect- Asserted: passes — The authors put it forward as true.
- Checkable: passes — It can be checked against evidence.
- Load-bearing: passes — The paper’s conclusions depend on it.
- Based: passes — The paper gives a reason why it holds.
It may state two separate claims as one.
None of the sources cited for this claim have been checked yet.
In the paper
“Other indicators based on species abundance (e.g. [15,16]) are developed for a selected group of species using a systematic monitoring protocol to collect the data used, so the indicator is spatially and taxonomically representative of the region and taxa in question.”
§ The Diversity-Weighted Living Planet Index: Controlling for Taxonomic Bias in a Global Biodiversity Indicator > Introduction
What the sources say
- Not checked yetcites [15] RD Gregory, 2005, Developing indicators for European birds, Philosophical Transactions of the Royal Society of London B: Biological Sciences source
- Not checked yetcites [16] CAM van Swaay, 2008, Butterfly monitoring in Europe: methods, applications and perspectives, Biodiversity and Conservation source
plaindirect- Asserted: passes — The authors put it forward as true.
- Checkable: passes — It can be checked against evidence.
- Load-bearing: passes — The paper’s conclusions depend on it.
- Based: passes — The paper gives a reason why it holds.
It may state two separate claims as one.
None of the sources cited for this claim have been checked yet.
In the paper
“The Living Planet Index (LPI) [7–9], one in the suite of global species indicators used to track progress towards Aichi Target 12, focusses on monitoring the population trends of vertebrate species.”
§ The Diversity-Weighted Living Planet Index: Controlling for Taxonomic Bias in a Global Biodiversity Indicator > Introduction
What the sources say
- Not checked yetcites [7] WWF (2016) Living Planet Report 2016: Risk and resilience in a new era WWF International, Gland, Switzerland.
- Not checked yetcites [8] B Collen, 2009, Monitoring Change in Vertebrate Abundance: the Living Planet Index, Conservation Biology source
- Not checked yetcites [9] J Loh, 2005, The Living Planet Index: using species population time series to track trends in biodiversity, Philosophical Transactions of the Royal Society of London B: Biological Sciences source
plain- Asserted: passes — The authors put it forward as true.
- Checkable: passes — It can be checked against evidence.
- Load-bearing: fails — The paper’s conclusions may not depend on it.
- Based: passes — The paper gives a reason why it holds.
Probably not a substantial claim. The paper’s conclusions may not depend on it. It may state two separate claims as one.
What the paper did — it cites no source for this, so there is none to check. The quote shows it is in the paper.
In the paper
“The Living Planet Database contains a number of abundance records that have been provided in confidence. These are used to calculate the presented trends and statistics, but cannot be made publically available.”
§ The Diversity-Weighted Living Planet Index: Controlling for Taxonomic Bias in a Global Biodiversity Indicator > Materials and Methods > Calculating the LPI
plain- Asserted: passes — The authors put it forward as true.
- Checkable: passes — It can be checked against evidence.
- Load-bearing: fails — The paper’s conclusions may not depend on it.
- Based: passes — The paper gives a reason why it holds.
Probably not a substantial claim. The paper’s conclusions may not depend on it. It may state two separate claims as one.
What the paper did — it cites no source for this, so there is none to check. The quote shows it is in the paper.
In the paper
“The year 2012 is chosen as the cut-off point for the index because at present there are insufficient data to calculate a robust index after this point due to publication time-lag.”
§ The Diversity-Weighted Living Planet Index: Controlling for Taxonomic Bias in a Global Biodiversity Indicator > Materials and Methods > Data collection for the LPI
plaindirect- Asserted: passes — The authors put it forward as true.
- Checkable: passes — It can be checked against evidence.
- Load-bearing: fails — The paper’s conclusions may not depend on it.
- Based: passes — The paper gives a reason why it holds.
Probably not a substantial claim. The paper’s conclusions may not depend on it.
None of the sources cited for this claim have been checked yet.
In the paper
“The LPI includes available published data, primarily in the scientific and grey literature (e.g. government/NGO reports) taken from the Living Planet Database (LPD) and records trends in 14,152 populations of 3,706 species.”
§ The Diversity-Weighted Living Planet Index: Controlling for Taxonomic Bias in a Global Biodiversity Indicator > Introduction
What the sources say
- Not checked yetcites [7] WWF (2016) Living Planet Report 2016: Risk and resilience in a new era WWF International, Gland, Switzerland.
- Not checked yetcites [8] B Collen, 2009, Monitoring Change in Vertebrate Abundance: the Living Planet Index, Conservation Biology source
- Not checked yetcites [9] J Loh, 2005, The Living Planet Index: using species population time series to track trends in biodiversity, Philosophical Transactions of the Royal Society of London B: Biological Sciences source
plain- Asserted: passes — The authors put it forward as true.
- Checkable: passes — It can be checked against evidence.
- Load-bearing: fails — The paper’s conclusions may not depend on it.
- Based: passes — The paper gives a reason why it holds.
Probably not a substantial claim. The paper’s conclusions may not depend on it. It may state two separate claims as one.
A conclusion the paper draws from its own results — it cites no other source for it, so there is none to check. The quote shows it is in the paper.
In the paper
“We note that weighting by species diversity is only one of a number of potential weightings that could be applied to make the trends more ‘representative’.”
§ The Diversity-Weighted Living Planet Index: Controlling for Taxonomic Bias in a Global Biodiversity Indicator > Discussion
hedged- Asserted: passes — The authors put it forward as true.
- Checkable: passes — It can be checked against evidence.
- Load-bearing: fails — The paper’s conclusions may not depend on it.
- Based: passes — The paper gives a reason why it holds.
Probably not a substantial claim. The paper’s conclusions may not depend on it.
In the paper
“Improving the coverage of Data Deficient species, as categorised by the IUCN Red List, might introduce negative trends if these species are likely to be threatened, as has been predicted for terrestrial mammals [43].”
§ The Diversity-Weighted Living Planet Index: Controlling for Taxonomic Bias in a Global Biodiversity Indicator > Discussion
What the sources say
- Not checked yetcites [43] LM Bland, 2015, Predicting the conservation status of data-deficient species, Conservation Biology source
hedgedconditional- Asserted: passes — The authors put it forward as true.
- Checkable: passes — It can be checked against evidence.
- Load-bearing: fails — The paper’s conclusions may not depend on it.
- Based: passes — The paper gives a reason why it holds.
Probably not a substantial claim. The paper’s conclusions may not depend on it.
In the paper
“However, tropical regions tend to have higher richness and a greater proportion of threatened species [34], so this method may introduce another bias by placing a high proportion of weight on groups that may be less well monitored, under-represented, or more likely to be categorized as threatened.”
§ The Diversity-Weighted Living Planet Index: Controlling for Taxonomic Bias in a Global Biodiversity Indicator > Discussion
What the sources say
- Not checked yetcites [34] R Grenyer, 2006, Global distribution and conservation of rare and threatened vertebrates, Nature source
hedgedconditional- Asserted: passes — The authors put it forward as true.
- Checkable: passes — It can be checked against evidence.
- Load-bearing: passes — The paper’s conclusions depend on it.
- Based: passes — The paper gives a reason why it holds.
It may state two separate claims as one.
A conclusion the paper draws from its own results — it cites no other source for it, so there is none to check. The quote shows it is in the paper.
In the paper
“Furthermore, species threatened under other criteria may be experiencing population declines but sufficient data are just not available to contribute to the Red Listing assessment.”
§ The Diversity-Weighted Living Planet Index: Controlling for Taxonomic Bias in a Global Biodiversity Indicator > Discussion
hedgedconditional- Asserted: passes — The authors put it forward as true.
- Checkable: passes — It can be checked against evidence.
- Load-bearing: fails — The paper’s conclusions may not depend on it.
- Based: fails — The paper may give no reason why it holds.
Probably not a substantial claim. The paper’s conclusions may not depend on it. The paper may give no reason why it holds. It may state two separate claims as one.
In the paper
“Estimates for the number of as yet unidentified birds and mammals are small (e.g. ~10–15 species), but the number of unidentified amphibians, reptiles and fish are much larger with respective estimates of 57%, 13% and 22% undescribed [44].”
§ The Diversity-Weighted Living Planet Index: Controlling for Taxonomic Bias in a Global Biodiversity Indicator > Discussion
What the sources say
- Not checked yetcites [44] BR Scheffers, 2012, What we know and don’t know about Earth's missing biodiversity, Trends in Ecology & Evolution source
hedged- Asserted: passes — The authors put it forward as true.
- Checkable: passes — It can be checked against evidence.
- Load-bearing: passes — The paper’s conclusions depend on it.
- Based: passes — The paper gives a reason why it holds.
It may state two separate claims as one.
In the paper
“Other approaches have been used, for example, to account for the differing proportion of a species’ total population across different countries [15].”
§ The Diversity-Weighted Living Planet Index: Controlling for Taxonomic Bias in a Global Biodiversity Indicator > Discussion
What the sources say
- Not checked yetcites [15] RD Gregory, 2005, Developing indicators for European birds, Philosophical Transactions of the Royal Society of London B: Biological Sciences source
plain- Asserted: passes — The authors put it forward as true.
- Checkable: passes — It can be checked against evidence.
- Load-bearing: fails — The paper’s conclusions may not depend on it.
- Based: passes — The paper gives a reason why it holds.
Probably not a substantial claim. The paper’s conclusions may not depend on it.
A conclusion the paper draws from its own results — it cites no other source for it, so there is none to check. The quote shows it is in the paper.
In the paper
“A limitation of our current approach is that it is reliant on reasonable species lists, which are known to change over time and may be of lower quality for less studied groups and regions.”
§ The Diversity-Weighted Living Planet Index: Controlling for Taxonomic Bias in a Global Biodiversity Indicator > Discussion
boostedconditional- Asserted: passes — The authors put it forward as true.
- Checkable: passes — It can be checked against evidence.
- Load-bearing: passes — The paper’s conclusions depend on it.
- Based: passes — The paper gives a reason why it holds.
It may state two separate claims as one.
A conclusion the paper draws from its own results — it cites no other source for it, so there is none to check. The quote shows it is in the paper.
In the paper
“For example, the bias towards data from protected areas might suggest the LPI would show a greater decline if counterfactuals from unprotected sites were equally monitored, on the assumption that protection has a positive effect on population trends.”
§ The Diversity-Weighted Living Planet Index: Controlling for Taxonomic Bias in a Global Biodiversity Indicator > Discussion
hedgedconditional- Asserted: fails — The authors may not put it forward as true.
- Checkable: passes — It can be checked against evidence.
- Load-bearing: fails — The paper’s conclusions may not depend on it.
- Based: fails — The paper may give no reason why it holds.
Probably not a substantial claim. The authors may not put it forward as true. The paper’s conclusions may not depend on it. The paper may give no reason why it holds.
- The authors state this as an assumption: Protection has a positive effect on population trends.
None of the sources cited for this claim have been checked yet.
In the paper
“Trends in abundance of species populations are a crucial indicator of biodiversity [28,29] and can provide early warnings of declines prior to species qualifying for high levels of extinction risk [30].”
§ The Diversity-Weighted Living Planet Index: Controlling for Taxonomic Bias in a Global Biodiversity Indicator > Discussion
What the sources say
- Not checked yetcites [28] L Santini, Assessing the suitability of diversity metrics to detect biodiversity change, Biological Conservation
- Not checked yetcites [29] ST Buckland, 2011, The geometric mean of relative abundance indices: a biodiversity measure with a difference, Ecosphere source
- Not checked yetcites [30] B Collen, 2011, Predicting how populations decline to extinction. Philosophical Transactions of the Royal Society B, Biological Sciences source
plaincorrelational- Asserted: passes — The authors put it forward as true.
- Checkable: passes — It can be checked against evidence.
- Load-bearing: passes — The paper’s conclusions depend on it.
- Based: passes — The paper gives a reason why it holds.
It may state two separate claims as one.
In the paper
“Consequently, this metric has been recommended as an Essential Biodiversity Variable [31], and, its use in geometric mean abundance indicators such as the Living Planet Index (LPI), is part of the mechanism to monitor biodiversity and assess progress towards the Aichi Targets.”
§ The Diversity-Weighted Living Planet Index: Controlling for Taxonomic Bias in a Global Biodiversity Indicator > Discussion
What the sources say
- Not checked yetcites [31] HM Pereira, 2013, Essential Biodiversity Variables, Science source
plaincorrelational- Asserted: passes — The authors put it forward as true.
- Checkable: passes — It can be checked against evidence.
- Load-bearing: fails — The paper’s conclusions may not depend on it.
- Based: passes — The paper gives a reason why it holds.
Probably not a substantial claim. The paper’s conclusions may not depend on it. It may state two separate claims as one.
A conclusion the paper draws from its own results — it cites no other source for it, so there is none to check. The quote shows it is in the paper.
In the paper
“Alternatively, declines may be exacerbated by a prevalence of coastal marine data; areas of high human impact and where many heavily exploited commercial fish stocks are monitored.”
§ The Diversity-Weighted Living Planet Index: Controlling for Taxonomic Bias in a Global Biodiversity Indicator > Discussion
hedgedconditional- Asserted: passes — The authors put it forward as true.
- Checkable: passes — It can be checked against evidence.
- Load-bearing: fails — The paper’s conclusions may not depend on it.
- Based: passes — The paper gives a reason why it holds.
Probably not a substantial claim. The paper’s conclusions may not depend on it.
A conclusion the paper draws from its own results — it cites no other source for it, so there is none to check. The quote shows it is in the paper.
In the paper
“As threatened species assessed under Criterion A are significantly over-represented in all groups except for amphibians, we can infer that the LPI has a bias towards negative population trends.”
§ The Diversity-Weighted Living Planet Index: Controlling for Taxonomic Bias in a Global Biodiversity Indicator > Discussion
plaindirect- Asserted: passes — The authors put it forward as true.
- Checkable: passes — It can be checked against evidence.
- Load-bearing: passes — The paper’s conclusions depend on it.
- Based: passes — The paper gives a reason why it holds.
It may state two separate claims as one.
A conclusion the paper draws from its own results — it cites no other source for it, so there is none to check. The quote shows it is in the paper.
In the paper
“These latter groups would therefore be given even greater weight, suggesting that vertebrate populations may be declining, on average, even more rapidly that we currently estimate.”
§ The Diversity-Weighted Living Planet Index: Controlling for Taxonomic Bias in a Global Biodiversity Indicator > Discussion
hedgedconditional- Asserted: passes — The authors put it forward as true.
- Checkable: passes — It can be checked against evidence.
- Load-bearing: passes — The paper’s conclusions depend on it.
- Based: passes — The paper gives a reason why it holds.
It may state two separate claims as one.
A conclusion the paper draws from its own results — it cites no other source for it, so there is none to check. The quote shows it is in the paper.
In the paper
“We might expect that as the weighted index places more weight on less monitored groups in more species-rich regions, we would be exaggerating the declines in abundance–as we might expect these groups to be declining more.”
§ The Diversity-Weighted Living Planet Index: Controlling for Taxonomic Bias in a Global Biodiversity Indicator > Discussion
hedgedconditional- Asserted: passes — The authors put it forward as true.
- Checkable: passes — It can be checked against evidence.
- Load-bearing: fails — The paper’s conclusions may not depend on it.
- Based: passes — The paper gives a reason why it holds.
Probably not a substantial claim. The paper’s conclusions may not depend on it. It may state two separate claims as one.
In the paper
“For example we know that tropical vertebrate populations are in worse decline than those in temperate regions [45] and that amphibians are threatened with a greater risk of extinction than mammals or birds [46].”
§ The Diversity-Weighted Living Planet Index: Controlling for Taxonomic Bias in a Global Biodiversity Indicator > Discussion
What the sources say
- Not checked yetcites [46] SN Stuart, 2004, Status and Trends of Amphibian Declines and Extinctions Worldwide, Science source
boostedcorrelational- Asserted: passes — The authors put it forward as true.
- Checkable: passes — It can be checked against evidence.
- Load-bearing: fails — The paper’s conclusions may not depend on it.
- Based: passes — The paper gives a reason why it holds.
Probably not a substantial claim. The paper’s conclusions may not depend on it.
The authors state this as an assumption.
Protection has a positive effect on population trends.
“on the assumption that protection has a positive effect on population trends.”
Claims other papers make about this one
Each is checked against this paper’s own text: does it say what the citing paper says it does?
In the citing paper
“Freshwater ecosystems have suffered the strongest decline of global biodiversity, while their vertebrate populations alone have declined by 83% between 1970 and 2012 [4], with maximum values of 94% in the Neotropics [5].”
From Urban Stream and Wetland Restoration in the Global South—A DPSIR Analysis (2019) · cites this paper as [4]
Self-check
Percentages, sums and reported differences re-computed from the paper’s own numbers.
Each contradiction between two passages listed here was confirmed by an independent check.
Rated major: it would touch a result — a value a result rests on, reported and recomputed p-values on opposite sides of the significance level, two passages that conflict with no sign which is right, or a cited work retracted before this paper was published.
In the paper
§ The Diversity-Weighted Living Planet Index: Controlling for Taxonomic Bias in a Global Biodiversity Indicator > Abstract
“freshwater populations have declined by 81%, marine populations by 36%, and terrestrial populations by 38% when using proportional weighting (compared to trends of -46%, +12% and +15% respectively).”
§ The Diversity-Weighted Living Planet Index: Controlling for Taxonomic Bias in a Global Biodiversity Indicator > Results > System trends: terrestrial, freshwater and marine
“| Terrestrial | 0.621 | 0.485–0.796 | 0.848 | 0.702–1.02 |”
Rated minor: it would not touch a result — a value no result rests on, a p-value that stays on the same side of the significance level, or a conflict that is clerical, resolved elsewhere in the paper, or outside its own findings.
In the paper
§ The Diversity-Weighted Living Planet Index: Controlling for Taxonomic Bias in a Global Biodiversity Indicator > Results > Taxonomic representation and bias within the living planet index
“South temperate and Antarctic reptiles are currently not represented at all in the LPI database (0%, of a possible 3 species; not shown in figure).”
§ The Diversity-Weighted Living Planet Index: Controlling for Taxonomic Bias in a Global Biodiversity Indicator > Results > The impact of low-representation groups
“As no groups within the marine realm have < 1% representation, we only present the differences in global, freshwater and terrestrial indices.”
Citations
Cites
Transforming Our World: The 2030 Agenda for Sustainable Development
Desa, U. (2018) · Springer Publishing Company eBooks · doi:10.1891/9780826190123.ap02 · Cited by 19,478
A global map of human impact on marine ecosystems
Halpern, B. S., Walbridge, S., Selkoe, K. A., Kappel, C. V., Micheli, F., D'Agrosa, C., Bruno, J. F., Casey, K. S., Ebert, C., Fox, H. E., et al. (2008) · Science · doi:10.1126/science.1149345 · Cited by 6,627
Status and Trends of Amphibian Declines and Extinctions Worldwide
Stuart, S. N., Chanson, J. S., Cox, N. A., Young, B. E., Rodrigues, A. S. L., Fischman, D. L., & Waller, R. W. (2004) · Science · doi:10.1126/science.1103538 · Cited by 4,508
Defaunation in the Anthropocene
Dirzo, R., Young, H. S., Galetti, M., Ceballos, G., Isaac, N. J. B., & Collen, B. (2014) · Science · doi:10.1126/science.1251817 · Cited by 4,474
Accelerated modern human–induced species losses: Entering the sixth mass extinction
Ceballos, G., Ehrlich, P. R., Barnosky, A. D., García, A., Pringle, R. M., & Palmer, T. M. (2015) · Science Advances · doi:10.1126/sciadv.1400253 · Cited by 4,220
The biodiversity of species and their rates of extinction, distribution, and protection
Pimm, S. L., Jenkins, C. N., Abell, R., Brooks, T. M., Gittleman, J. L., Joppa, L. N., Raven, P. H., Roberts, C. M., & Sexton, J. O. (2014) · Science · doi:10.1126/science.1246752 · Cited by 3,542
Abell, R., Thieme, M. L., Revenga, C., Bryer, M., Kottelat, M., Bogutskaya, N., Coad, B., Mandrak, N., Balderas, S. C., Bussing, W., et al. (2008) · BioScience · doi:10.1641/b580507 · Cited by 2,045
Essential Biodiversity Variables
Pereira, H. M., Ferrier, S., Walters, M., Geller, G. N., Jongman, R. H. G., Scholes, R. J., Bruford, M. W., Brummitt, N., Butchart, S. H. M., Cardoso, A. C., et al. (2013) · Science · doi:10.1126/science.1229931 · Cited by 1,637
Global patterns and predictors of marine biodiversity across taxa
Tittensor, D. P., Mora, C., Jetz, W., Lotze, H. K., Ricard, D., Berghe, E. V., & Worm, B. (2010) · Nature · doi:10.1038/nature09329 · Cited by 1,524
A mid-term analysis of progress toward international biodiversity targets
Tittensor, D. P., Walpole, M., Hill, S. L. L., Boyce, D. G., Britten, G. L., Burgess, N. D., Butchart, S. H. M., Leadley, P. W., Regan, E. C., Alkemade, R., et al. (2014) · Science · doi:10.1126/science.1257484 · Cited by 1,227
Cited by
Sorted by citations
Bending the Curve of Global Freshwater Biodiversity Loss: An Emergency Recovery Plan
Tickner, D., Opperman, J. J., Abell, R., Acreman, M., Arthington, A. H., Bunn, S. E., Cooke, S. J., Dalton, J., Darwall, W., Edwards, G., et al. (2020) · BioScience · doi:10.1093/biosci/biaa002 · Cited by 1,241
The direct drivers of recent global anthropogenic biodiversity loss
Jaureguiberry, P., Titeux, N., Wiemers, M., Bowler, D. E., Coscieme, L., Golden, A. S., Guerra, C. A., Jacob, U., Takahashi, Y., Settele, J., et al. (2022) · Science Advances · doi:10.1126/sciadv.abm9982 · Cited by 1,121
Bending the curve of terrestrial biodiversity needs an integrated strategy
Leclère, D., Obersteiner, M., Barrett, M., Butchart, S. H. M., Chaudhary, A., De Palma, A., DeClerck, F. A. J., Di Marco, M., Doelman, J. C., Dürauer, M., et al. (2020) · Nature · doi:10.1038/s41586-020-2705-y · Cited by 922
Self-citationAiming higher to bend the curve of biodiversity loss
Mace, G. M., Barrett, M., Burgess, N. D., Cornell, S. E., Freeman, R., Grooten, M., & Purvis, A. (2018) · Nature Sustainability · doi:10.1038/s41893-018-0130-0 · Cited by 550
Self-citationKissling, W. D., Ahumada, J., Bowser, A., Fernández, M., Fernández, N., García, E. A., Guralnick, R., Isaac, N. J. B., Kelling, S., Los, W., et al. (2017) · Biological reviews/Biological reviews of the Cambridge Philosophical Society · doi:10.1111/brv.12359 · Cited by 323
“org/data_portal) as well as with the latest publication (McRae et al., 2017) and as part of the Living Planet Report (http://www.”
Self-citation
Metadata
- Authors
- McRae, L., Deinet, S., & Freeman, R.
- Affiliations
- Zoological Society of London (GB)
- Corresponding author
- McRae, Louise
- Venue
- PLOS ONE
- Publisher
- Public Library of Science (PLoS)
- Published
- 2017-01-03
- Volume
- 12
- Issue
- 1
- Pages
- e0169156
- ISSN
- 1932-6203 (ISSN-L)
- PMC
- PMC5207715
- OpenAlex
- W2493835817
- Cited by
- 236
- References
- 37
- Citations by year
- 2026: 13 · 2025: 26 · 2024: 22 · 2023: 42 · 2022: 42 · 2021: 22 · 2020: 36 · 2019: 15 · 2018: 13 · 2017: 5
- FWCI
- 15.55
- Type
- journal article
- Language
- en
- Open access
- gold
- doi.org
- Licence
- Locations
- PLoS ONE (publishedVersion, cc-by)
- Europe PMC (PubMed Central) (publishedVersion, cc-by)
- PubMed Central (publishedVersion, cc-by)
- PubMed (publishedVersion)
- DOAJ (DOAJ: Directory of Open Access Journals) (submittedVersion, cc-by-sa)
- UCL Discovery (University College London) (submittedVersion)
- Figshare (submittedVersion, cc-by)
- Funders
- WWF International
- Topics
- Physical Sciences › Environmental Science › Nature and Landscape Conservation › Ecology and Vegetation Dynamics Studies
- Physical Sciences › Environmental Science › Ecology › Wildlife Ecology and Conservation
- Physical Sciences › Environmental Science › Global and Planetary Change › Conservation, Biodiversity, and Resource Management
- Keywords
- Living Planet Index, biodiversity indicators, taxonomic bias, geographic bias, vertebrates, freshwater biodiversity, marine biodiversity, terrestrial biodiversity, biogeographical realms, data coverage, biodiversity monitoring
- MeSH terms
- Animals, Conservation of Natural Resources, Fresh Water, Geography, International Cooperation, Marine Biology, Science, Species Specificity, Time Factors, Vertebrates, Databases, Factual, Ecosystem, Earth, Planet, Biodiversity
About these checks
Registry, retraction, Cites and statistics results are computed, not judged, with one exception: a printed reference that no index lists is read once by a model before it counts as a citation error. Claims are extracted by a model and kept only when their quote appears verbatim in the text; each cited source is then checked, with a model’s help, for whether it says what the claim relies on. Those verdicts can be wrong — read the claim’s quote and the cited source before relying on one.
A language model drew the claims from the paper on 2026-10-07, under version 3 of the claim definition (model deepseek-v4.1-flash, prompt extract-v3).
A second model labelled each claim on 2026-10-07 (model jev-1.13-20260917, definition revision gold-guideline-v0.2).
Statistics and arithmetic are recomputed, not judged.
Confidence bands are shown only for fields calibrated on our annotated test set. None is calibrated yet, so no band is shown.
What counts as a claim ›How we measure confidence ›How we check this ›
Are you an author, or do you see a problem with this page? Request a review
