

The DOI matches its Crossref record; 51 of the 51 references it cites were found in a registry or an index.
Debunking in a world of tribes
Open accessAbstract
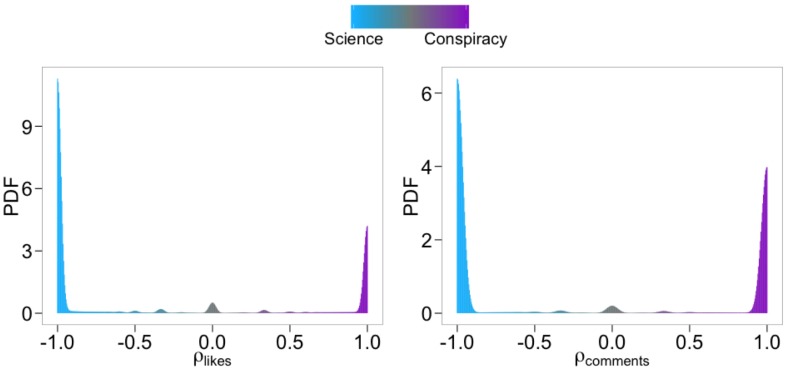
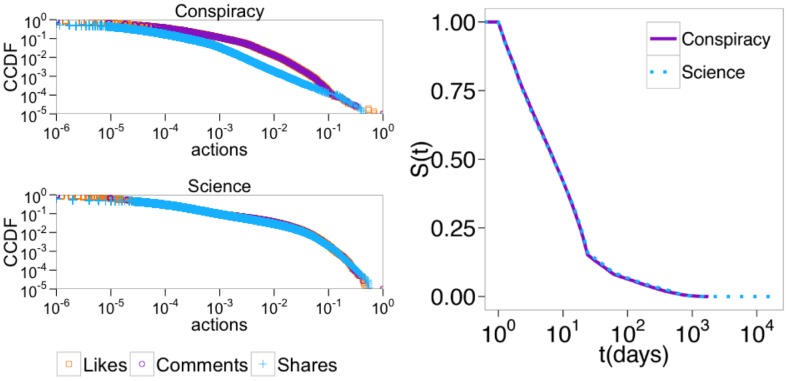
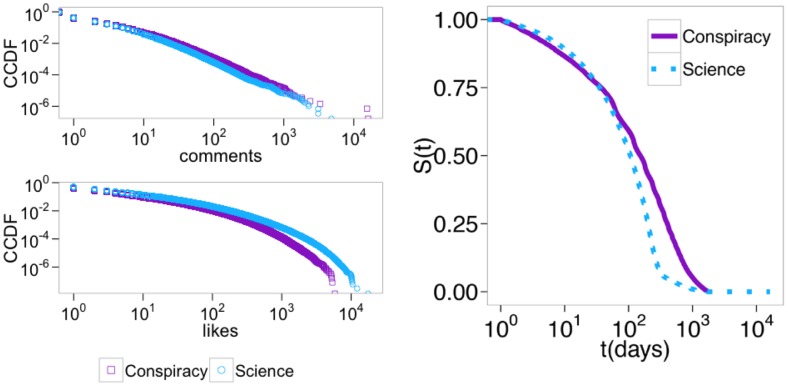
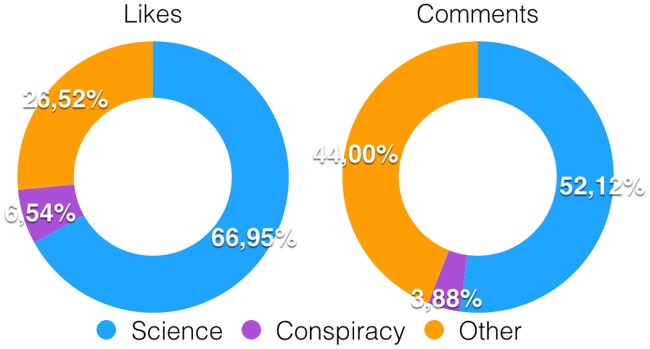
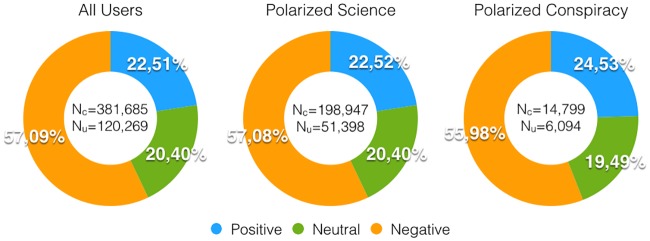
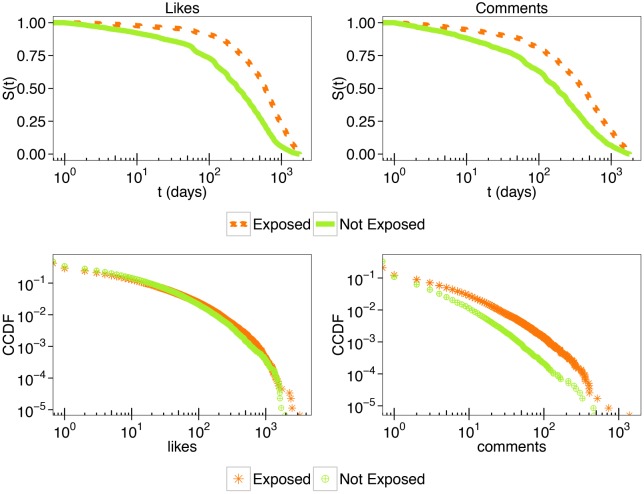
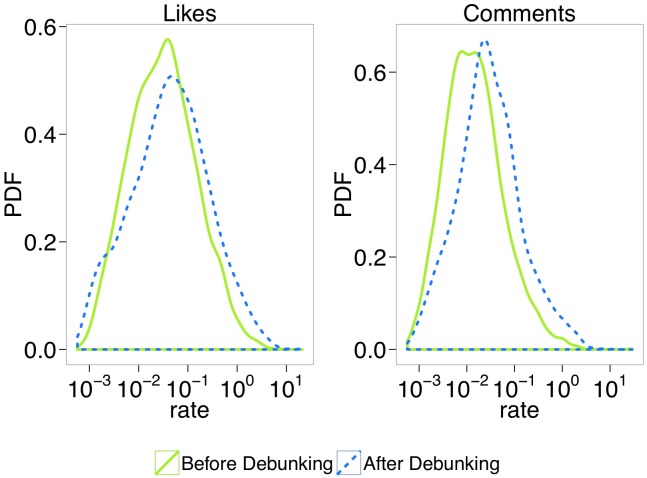
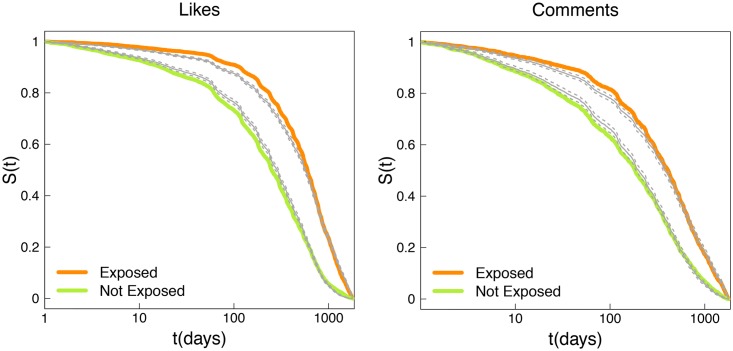
Social media aggregate people around common interests eliciting collective framing of narratives and worldviews. However, in such a disintermediated environment misinformation is pervasive and attempts to debunk are often undertaken to contrast this trend. In this work, we examine the effectiveness of debunking on Facebook through a quantitative analysis of 54 million users over a time span of five years (Jan 2010, Dec 2014). In particular, we compare how users usually consuming proven (scientific) and unsubstantiated (conspiracy-like) information on Facebook US interact with specific debunking posts. Our findings confirm the existence of echo chambers where users interact primarily with either conspiracy-like or scientific pages. However, both groups interact similarly with the information within their echo chamber. Then, we measure how users from both echo chambers interacted with 50,220 debunking posts accounting for both users consumption patterns and the sentiment expressed in their comments. Sentiment analysis reveals a dominant negativity in the comments to debunking posts. Furthermore, such posts remain mainly confined to the scientific echo chamber. Only few conspiracy users engage with corrections and their liking and commenting rates on conspiracy posts increases after the interaction.
Overview
The claims and statistics of this paper haven’t been checked yet.
Run the check — free, no account needed. It reads the open-access text and checks the sources it cites.
Integrity signals
Registry
Cites
Statistics
Figures
Verification
Claims the paper makes
The claims and statistics of this paper haven’t been checked yet.
Run the check — free, no account needed. It reads the open-access text and checks the sources it cites.
Claims other papers make about this one
Each is checked against this paper’s own text: does it say what the citing paper says it does?
The source backs part of the claim, not all of it — or backs it for a different population, condition or comparison.
In the citing paper
“This phenomenon is particularly pronounced in segregated networks, such as”
From A systematic review of echo chamber research: comparative analysis of conceptualizations, operationalizations, and varying outcomes (2025) · cites this paper as [50]
Experimental — accuracy not yet measuredThe source backs part of the claim, not all of it — or backs it for a different population, condition or comparison.
In the citing paper
“They find that the amount of media a person consumes is anti-proportional to their chance of being trapped in an echo chamber, which contradicts findings by CSS studies [48,50,66,67] that find that engagement and echo chambers are positively correlated.”
From A systematic review of echo chamber research: comparative analysis of conceptualizations, operationalizations, and varying outcomes (2025) · cites this paper as [50]
Experimental — accuracy not yet measuredIn the citing paper
“fact-checks are unlikely to reach everyone who was exposed to the initial misinformation (10);”
From Psychological inoculation improves resilience against misinformation on social media (2022) · cites this paper as [10]
Self-check
Percentages, sums and reported differences re-computed from the paper’s own numbers.
The self-check needs the paper’s full text.
Citations
Cites
Nonparametric Estimation from Incomplete Observations
Kaplan, E. L., & Meier, P. (1992) · Springer series in statistics · doi:10.1007/978-1-4612-4380-9_25 · Cited by 45,239
Regression Models and Life-Tables
Cox, D. R. (1972) · Journal of the Royal Statistical Society Series B: Statistical Methodology · doi:10.1111/j.2517-6161.1972.tb00899.x · Cited by 39,793
Nonparametric Estimation from Incomplete Observations
Kaplan, E. L., & Meier, P. (1958) · Journal of the American Statistical Association · doi:10.1080/01621459.1958.10501452 · Cited by 39,158
The Nature of Statistical Learning Theory
Vapnik, V. N. (1995) · doi:10.1007/978-1-4757-2440-0 · Cited by 39,138
Regression Models and Life-Tables
Cox, D. R. (1992) · Springer Series in Statistics · doi:10.1007/978-1-4612-4380-9_37 · Cited by 26,297
Content Analysis: An Introduction to its Methodology.
Shelley, M., & Krippendorff, K. (1984) · Journal of the American Statistical Association · doi:10.2307/2288384 · Cited by 24,346
Content Analysis: An Introduction to Its Methodology
Krippendorff, K. (2019) · doi:10.4135/9781071878781 · Cited by 15,448
On a Test of Whether one of Two Random Variables is Stochastically Larger than the Other
Mann, H. B., & Whitney, D. R. (1947) · The Annals of Mathematical Statistics · doi:10.1214/aoms/1177730491 · Cited by 14,320
Ellison, N. B., Steinfield, C., & Lampe, C. (2007) · Journal of Computer-Mediated Communication · doi:10.1111/j.1083-6101.2007.00367.x · Cited by 9,939
Power-Law Distributions in Empirical Data
Clauset, A., Shalizi, C. R., & Newman, M. E. J. (2009) · SIAM Review · doi:10.1137/070710111 · Cited by 8,019
Research works printed but not linked: 1
- Resnick P, Carton S, Park S, Shen Y, Zeffer N. RumorLens: A System for Analyzing the Impact of Rumors and Corrections in Social Media. In: Proc. Computational Journalism Conference; 2014.
Cited by
Sorted by citations
Using social and behavioural science to support COVID-19 pandemic response
Bavel, J. J. V., Baicker, K., Boggio, P. S., Capraro, V., Cichocka, A., Cikara, M., Crockett, M. J., Crum, A. J., Douglas, K. M., Druckman, J. N., et al. (2020) · Nature Human Behaviour · doi:10.1038/s41562-020-0884-z · Cited by 4,964
The COVID-19 social media infodemic
Cinelli, M., Quattrociocchi, W., Galeazzi, A., Valensise, C. M., Brugnoli, E., Schmidt, A. L., Zola, P., Zollo, F., & Scala, A. (2020) · Scientific Reports · doi:10.1038/s41598-020-73510-5 · Cited by 2,313
Self-citationInfluence of fake news in Twitter during the 2016 US presidential election
Bovet, A., & Makse, H. A. (2019) · CUNY Academic Works (City University of New York) · Cited by 882
Horne, B. D., & Adalı, S. (2017) · Proceedings of the International AAAI Conference on Web and Social Media · doi:10.1609/icwsm.v11i1.14976 · Cited by 787
Misinformation: susceptibility, spread, and interventions to immunize the public
van der Linden, S. (2022) · Nature Medicine · doi:10.1038/s41591-022-01713-6 · Cited by 570
Metadata
- Authors
- Zollo, F., Bessi, A., Del Vicario, M., Scala, A., Caldarelli, G., Shekhtman, L., Havlin, S., & Quattrociocchi, W.
- Affiliations
- IMT School for Advanced Studies Lucca (IT)
- Istituto Universitario di Studi Superiori di Pavia (IT)
- Bar-Ilan University (IL)
- Corresponding author
- Zollo, Fabiana
- ORCID
- Venue
- PLOS ONE
- Publisher
- Public Library of Science (PLoS)
- Published
- 2017-07-24
- Volume
- 12
- Issue
- 7
- Pages
- e0181821
- ISSN
- 1932-6203 (ISSN-L)
- PMC
- PMC5524392
- OpenAlex
- W2962740444
- Cited by
- 345
- References
- 51
- Citations by year
- 2026: 19 · 2025: 39 · 2024: 32 · 2023: 34 · 2022: 39 · 2021: 53 · 2020: 55 · 2019: 30 · 2018: 21 · 2017: 16
- FWCI
- 85.15
- Type
- journal article
- Language
- en
- Open access
- gold
- doi.org
- Licence
- Locations
- PLoS ONE (publishedVersion, cc-by)
- Europe PMC (PubMed Central) (publishedVersion, cc-by)
- PubMed Central (publishedVersion, cc-by)
- PubMed (publishedVersion)
- arXiv (Cornell University) (submittedVersion)
- DOAJ (DOAJ: Directory of Open Access Journals) (submittedVersion, cc-by-sa)
- IRIS Research product catalog (Sapienza University of Rome) (submittedVersion)
- ARCA (Università Ca' Foscari Venezia) (submittedVersion)
- arXiv (Cornell University)
- Topics
- Social Sciences › Sociology and Political Science › Misinformation and Its Impacts
- Physical Sciences › Physics and Astronomy › Statistical and Nonlinear Physics › Complex Network Analysis Techniques
- Social Sciences › Communication › Social Media and Politics
- Keywords
- debunking, misinformation, conspiracy beliefs, echo chambers, Facebook, social media, user engagement, sentiment analysis, scientific information, disintermediation
- MeSH terms
- Attention, Communication, Humans, United States, Social Networking, Social Media
About these checks
Registry, retraction, Cites and statistics results are computed, not judged, with one exception: a printed reference that no index lists is read once by a model before it counts as a citation error. Claims are extracted by a model and kept only when their quote appears verbatim in the text; each cited source is then checked, with a model’s help, for whether it says what the claim relies on. Those verdicts can be wrong — read the claim’s quote and the cited source before relying on one.
Statistics and arithmetic are recomputed, not judged.
Confidence bands are shown only for fields calibrated on our annotated test set. None is calibrated yet, so no band is shown.
What counts as a claim ›How we measure confidence ›How we check this ›
Are you an author, or do you see a problem with this page? Request a review
