

Algorithmic bias amplifies opinion fragmentation and polarization: A bounded confidence model
Open accessThe DOI matches its Crossref record; 57 of the 57 references it cites were found in a registry or an index.
Abstract
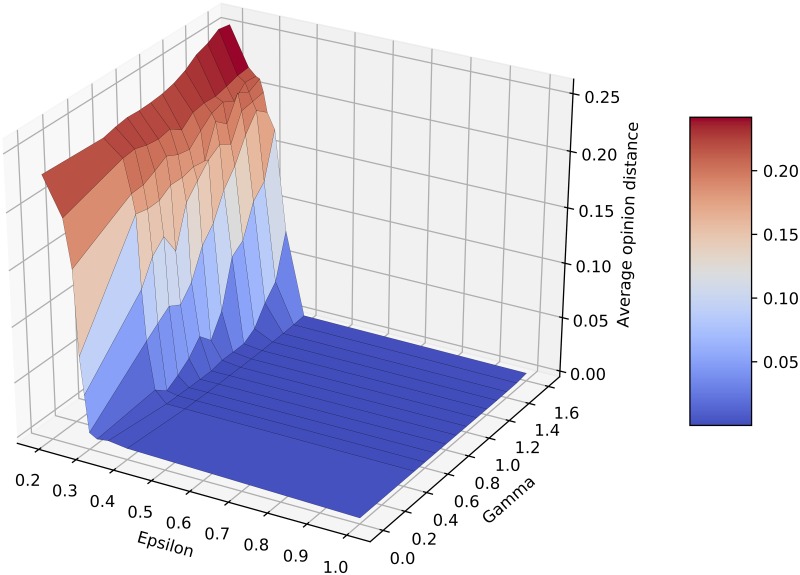
The flow of information reaching us via the online media platforms is optimized not by the information content or relevance but by popularity and proximity to the target. This is typically performed in order to maximise platform usage. As a side effect, this introduces an algorithmic bias that is believed to enhance fragmentation and polarization of the societal debate. To study this phenomenon, we modify the well-known continuous opinion dynamics model of bounded confidence in order to account for the algorithmic bias and investigate its consequences. In the simplest version of the original model the pairs of discussion participants are chosen at random and their opinions get closer to each other if they are within a fixed tolerance level. We modify the selection rule of the discussion partners: there is an enhanced probability to choose individuals whose opinions are already close to each other, thus mimicking the behavior of online media which suggest interaction with similar peers. As a result we observe: a) an increased tendency towards opinion fragmentation, which emerges also in conditions where the original model would predict consensus, b) increased polarisation of opinions and c) a dramatic slowing down of the speed at which the convergence at the asymptotic state is reached, which makes the system highly unstable. Fragmentation and polarization are augmented by a fragmented initial population.
Overview
The claims and statistics of this paper haven’t been checked yet.
Free: it reads the open-access text and checks the first 5 claims that cite a source we can check. Create a free account to check every claim.
Integrity signals
Registry
Cites
Statistics
Figures



Verification
Claims the paper makes
The claims and statistics of this paper haven’t been checked yet.
Free: it reads the open-access text and checks the first 5 claims that cite a source we can check. Create a free account to check every claim.
Self-check
Percentages, sums and reported differences re-computed from the paper’s own numbers.
The self-check needs the paper’s full text.
Citations
Cites
Emergence of Scaling in Random Networks
Barabási, A.-L., & Albert, R. (1999) · Science · doi:10.1126/science.286.5439.509 · Cited by 36,135
(2011) · Cited by 4,430
Epidemic processes in complex networks
Pastor-Satorras, R., Castellano, C., Van Mieghem, P., & Vespignani, A. (2015) · Reviews of Modern Physics · doi:10.1103/revmodphys.87.925 · Cited by 3,697
Exposure to ideologically diverse news and opinion on Facebook
Bakshy, E., Messing, S., & Adamic, L. A. (2015) · Science · doi:10.1126/science.aaa1160 · Cited by 3,245 · cited 1×
“The variety of interactions of a person (family, school, work, hobby, etc.) may contribute to diversification of information sources [14], nevertheless, regarding political views homophily seems particularly strong [15].”
BackgroundThe spreading of misinformation online
Del Vicario, M., Bessi, A., Zollo, F., Petroni, F., Scala, A., Caldarelli, G., Stanley, H. E., & Quattrociocchi, W. (2016) · Proceedings of the National Academy of Sciences · doi:10.1073/pnas.1517441113 · Cited by 2,407
Opinion Dynamics and Bounded Confidence Models, Analysis and Simulation
Hegselmann, R., & Krause, U. (2002) · RePEc: Research Papers in Economics · Cited by 2,362
Mixing beliefs among interacting agents
Deffuant, G., Neau, D., Amblard, F., & Weisbuch, G. (2000) · Advances in Complex Systems · doi:10.1142/s0219525900000078 · Cited by 2,165 · cited 4×
“The original bounded confidence model [17] considers a population of N individuals, where each individual i holds a continuous opinion x i ∈ [0 , 1].”
BackgroundMethodInfluentialPrior, M. (2007) · Cambridge University Press eBooks · doi:10.1017/cbo9781139878425 · Cited by 1,582
(2007) · Choice Reviews Online · doi:10.5860/choice.45-1733 · Cited by 1,178
Colleoni, E., Rozza, A., & Arvidsson, A. (2014) · Journal of Communication · doi:10.1111/jcom.12084 · Cited by 1,151
The Mass Media and American Politics: A Review Essay
Pfau, M. (1989) · Western Political Quarterly · doi:10.1177/106591298904200113 · Cited by 926
Messing, S., & Westwood, S. J. (2014) · Communication Research · doi:10.1177/0093650212466406 · Cited by 902 · cited 1×
“Somewhat counterintuitively, this has not lead to a more balanced information acquisition and a stronger tendency towards consensus, as argued in [7], on the contrary.”
Mass Media and American Politics, by Doris A. Graber
Kumar, M. J. (1980) · Political Science Quarterly · doi:10.2307/2150629 · Cited by 837
CONTINUOUS OPINION DYNAMICS UNDER BOUNDED CONFIDENCE: A SURVEY
Lorenz, J. (2012) · RePEc: Research Papers in Economics · Cited by 583
SHARE, LIKE, RECOMMEND: Decoding the social media news consumer
Hermida, A., Fletcher, F., Korell, D., & Logan, D. (2012) · Journalism Studies · doi:10.1080/1461670x.2012.664430 · Cited by 570 · cited 1×
“A considerable and rapidly increasing part of the population does not use traditional media (printed press, radio, TV or even online journals) for obtaining news [10, 11, 12] but turns to the new media like online social networks or blogs.”
BackgroundCONTINUOUS OPINION DYNAMICS UNDER BOUNDED CONFIDENCE: A SURVEY
LORENZ, J. (2007) · International Journal of Modern Physics C · doi:10.1142/s0129183107011789 · Cited by 561
New Media and the Polarization of American Political Discourse
Baum, M. A., & Groeling, T. (2008) · Political Communication · doi:10.1080/10584600802426965 · Cited by 536
Political Discourse on Social Media: Echo Chambers, Gatekeepers, and the Price of Bipartisanship
Garimella, K., De Francisci Morales, G., Gionis, A., & Mathioudakis, M. (2018) · Proceedings of the 2018 World Wide Web Conference on World Wide Web - WWW '18 · doi:10.1145/3178876.3186139 · Cited by 335 · cited 1×
“on Facebook, leading to an echo-chamber effect [20], as well as on Twitter where partisan users were demonstrated to have an important role in polarization [24].”
BackgroundAnatomy of news consumption on Facebook
Schmidt, A. L., Zollo, F., Del Vicario, M., Bessi, A., Scala, A., Caldarelli, G., Stanley, H. E., & Quattrociocchi, W. (2017) · Proceedings of the National Academy of Sciences · doi:10.1073/pnas.1617052114 · Cited by 305
Macroeconomic Policy in DSGE and Agent-Based Models Redux: New Developments and Challenges Ahead
Fagiolo, G., & Roventini, A. (2017) · Journal of Artificial Societies and Social Simulation · doi:10.18564/jasss.3280 · Cited by 273
Consensus formation on adaptive networks
Kozma, B., & Barrat, A. (2008) · Physical Review E · doi:10.1103/physreve.77.016102 · Cited by 271
Beneath the Veneer of Fragmentation: Television Audience Polarization in a Multichannel World
Webster, J. G. (2005) · Journal of Communication · doi:10.1093/joc/55.2.366 · Cited by 264
Jager, W., & Amblard, F. (2005) · Computational & Mathematical Organization Theory · doi:10.1007/s10588-005-6282-2 · Cited by 235
Emergence of Communities in Weighted Networks
Kumpula, J. M., Onnela, J.-P., Saramäki, J., Kaski, K., & Kertész, J. (2007) · Physical Review Letters · doi:10.1103/physrevlett.99.228701 · Cited by 222
Self-citationThe Rise of Partisanship and Super-Cooperators in the U.S. House of Representatives
Andris, C., Lee, D., Hamilton, M. J., Martino, M., Gunning, C. E., & Selden, J. A. (2015) · PLOS ONE · doi:10.1371/journal.pone.0123507 · Cited by 197 · cited 1×
“Political polarization is a generally observed, ingravescent negative trend in modern western societies [1, 2, 21, 22] with such concomitants as “alternative realities”, “filter bubbles”, “echo chambers”, and “fake news”.”
BackgroundPolarized: Making Sense of a Divided America
(2017) · Contemporary Sociology: A Journal of Reviews · doi:10.1177/0094306117692575 · Cited by 196 · cited 1×
“Several causes have been identified (see, e.g., [3]) but there is increasing evidence that new online media is one of them [4, 5, 6].”
BackgroundIndividualization as Driving Force of Clustering Phenomena in Humans
Mäs, M., Flache, A., & Helbing, D. (2010) · PLoS Computational Biology · doi:10.1371/journal.pcbi.1000959 · Cited by 190
Opinion Dynamics: Models, Extensions and External Effects
Sîrbu, A., Loreto, V., Servedio, V. D. P., & Tria, F. (2017) · Understanding Complex Systems · doi:10.1007/978-3-319-25658-0_17 · Cited by 186
Self-citationReducing Controversy by Connecting Opposing Views
Garimella, K., De Francisci Morales, G., Gionis, A., & Mathioudakis, M. (2017) · Proceedings of the Tenth ACM International Conference on Web Search and Data Mining · doi:10.1145/3018661.3018703 · Cited by 165
UNIVERSALITY OF THE THRESHOLD FOR COMPLETE CONSENSUS FOR THE OPINION DYNAMICS OF DEFFUANTet al.
Fortunato, S. (2004) · International Journal of Modern Physics C · doi:10.1142/s0129183104006728 · Cited by 141
Mass media and American politics
Graber, D. A., & Dunaway, J. (n.d.) · Cited by 141
Bounded confidence and social networks
Weisbuch, G. (2004) · The European Physical Journal B - Condensed Matter · doi:10.1140/epjb/e2004-00126-9 · Cited by 134
Disambiguation of social polarization concepts and measures
Bramson, A., Grim, P., Singer, D. J., Fisher, S., Berger, W., Sack, G., & Flocken, C. (2016) · The Journal of Mathematical Sociology · doi:10.1080/0022250x.2016.1147443 · Cited by 128
News on the Internet: Information and Citizenship in the 21st Century
Tewksbury, D., & Rittenberg, J. (2012) · Oxford University Press eBooks · doi:10.1093/acprof:osobl/9780195391961.001.0001 · Cited by 123
Geographies of an Online Social Network
Lengyel, B., Varga, A., Ságvári, B., Jakobi, Á., & Kertész, J. (2015) · PLoS ONE · doi:10.1371/journal.pone.0137248 · Cited by 112
Self-citationStructural transition in social networks: The role of homophily
Murase, Y., Jo, H.-H., Török, J., Kertész, J., & Kaski, K. (2019) · Scientific Reports · doi:10.1038/s41598-019-40990-z · Cited by 107
Self-citationNDlib: a python library to model and analyze diffusion processes over complex networks
Rossetti, G., Milli, L., Rinzivillo, S., Sîrbu, A., Pedreschi, D., & Giannotti, F. (2017) · International Journal of Data Science and Analytics · doi:10.1007/s41060-017-0086-6 · Cited by 104
Self-citationSIMULATION OF CONSENSUS MODEL OF DEFFUANT et al. ON A BARABÁSI–ALBERT NETWORK
STAUFFER, D., & MEYER-ORTMANNS, H. (2004) · International Journal of Modern Physics C · doi:10.1142/s0129183104005644 · Cited by 99
News on the Internet: information and citizenship in the 21st century
(2012) · Choice Reviews Online · doi:10.5860/choice.50-1300 · Cited by 93
Stoica, A.-A., Riederer, C., & Chaintreau, A. (2018) · Proceedings of the 2018 World Wide Web Conference on World Wide Web - WWW '18 · doi:10.1145/3178876.3186140 · Cited by 90
Participatory Sensing, Opinions and Collective Awareness
Loreto, V., Haklay, M., Andreas Hotho, A., Servedio, V. D. P., Stumme, G., Theunis, J., & Tria, F. (2016) · Understanding complex systems · doi:10.1007/978-3-319-25658-0 · Cited by 81
Multilayer weighted social network model
Murase, Y., Török, J., Jo, H.-H., Kaski, K. K., & Kertész, J. (2014) · Physical Review E · doi:10.1103/physreve.90.052810 · Cited by 75
Self-citationCarro, A., Toral, R., & Miguel, M. S. (2012) · Journal of Statistical Physics · doi:10.1007/s10955-012-0635-2 · Cited by 71
The Role of Homophily in the Emergence of Opinion Controversies
Gargiulo, F., & Gandica, Y. (2017) · Journal of Artificial Societies and Social Simulation · doi:10.18564/jasss.3448 · Cited by 65
Will the Personalization of Online Social Networks Foster Opinion Polarization?Preprint
Mäs, M., & Bischofberger, L. (2015) · SSRN Electronic Journal · doi:10.2139/ssrn.2553436 · Cited by 51
Opinion Dynamics with Disagreement and Modulated Information
Sîrbu, A., Loreto, V., Servedio, V. D. P., & Tria, F. (2013) · Journal of Statistical Physics · doi:10.1007/s10955-013-0724-x · Cited by 42
Self-citationNews Consumption during the Italian Referendum: A Cross-Platform Analysis on Facebook and Twitter
Vicario, M. D., Gaito, S., Quattrociocchi, W., Zignani, M., & Zollo, F. (2017) · 2017 IEEE International Conference on Data Science and Advanced Analytics (DSAA) · doi:10.1109/dsaa.2017.33 · Cited by 36 · cited 1×
“Political polarization is a generally observed, ingravescent negative trend in modern western societies [1, 2, 21, 22] with such concomitants as “alternative realities”, “filter bubbles”, “echo chambers”, and “fake news”.”
BackgroundOrder-Disorder Phase Transition and Critical Slowing Down in Photorefractive Self-Oscillators
Engin, D., Orlov, S. S., Segev, M., Valley, G. C., & Yariv, A. (1995) · Physical Review Letters · doi:10.1103/physrevlett.74.1743 · Cited by 30
Campbell, J. E. (2018) · Princeton University Press eBooks · doi:10.1515/9781400889273 · Cited by 26
NDlib: Studying Network Diffusion Dynamics
Rossetti, G., Milli, L., Rinzivillo, S., Sîrbu, A., Pedreschi, D., & Giannotti, F. (2017) · IEEE International Conference on Data Science and Advanced Analytics (DSAA) · doi:10.1109/dsaa.2017.6 · Cited by 20
Self-citationVilli, M., Matikainen, J., & Khaldarova, I. (2015) · Springer eBooks · doi:10.1007/978-3-642-54484-2_16 · Cited by 18
Anomalous critical slowdown at a first order phase transition in single polymer chains
Zhang, S., Qi, S., Klushin, L. I., Skvortsov, A. M., Yan, D., & Schmid, F. (2017) · The Journal of Chemical Physics · doi:10.1063/1.4997435 · Cited by 17
Polarization Rank: A Study on European News Consumption on FacebookPreprint
Schmidt, A. L., Zollo, F., Scala, A., & Quattrociocchi, W. (2018) · arXiv (Cornell University) · doi:10.48550/arxiv.1805.08030 · Cited by 15
Campbell, J. E. (2018) · Princeton University Press eBooks · doi:10.2307/j.ctt1wf4cgv · Cited by 13
Media Convergence Handbook - Vol. 2
Lugmayr, A. R., & Zotto, C. D. (2016) · Springer eBooks · doi:10.1007/978-3-642-54487-3 · Cited by 11
Fragmentation and Polarization of the Public Sphere in the 2000s: Evidence from Italy and Russia
Bodrunova, S. S., & Бодрунова, С. (2013) · Global Media Journal: German Edition · Cited by 7
Media/Democracy a Comparative Study
Charles, A. (2013) · Cited by 2
Research works printed but not linked: 2
- K Purcell, 2010, Understanding the participatory news consumer, Pew Internet and American Life Project, 1, 19
- MW Macy, 2003, Polarization in dynamic networks: A Hopfield model of emergent structure, Dynamic social network modeling and analysis, 162
Cited by
Online misinformation about climate change
Treen, K. M. D., Williams, H. T. P., & O'Neill, S. J. (2020) · WIREs Climate Change · doi:10.1002/wcc.665 · Cited by 441
Recent advances in opinion propagation dynamics: a 2020 survey
Noorazar, H. (2020) · The European Physical Journal Plus · doi:10.1140/epjp/s13360-020-00541-2 · Cited by 177
Marks, J., Copland, E., Loh, E., Sunstein, C. R., & Sharot, T. (2019) · Cognition · doi:10.1016/j.cognition.2018.10.003 · Cited by 124
Evolution and impact of bias in human and machine learning algorithm interaction
Sun, W., Nasraoui, O., & Shafto, P. (2020) · PLOS ONE · doi:10.1371/journal.pone.0235502 · Cited by 116
From classical to modern opinion dynamics
Noorazar, H., Vixie, K. R., Talebanpour, A., & Hu, Y. (2020) · International Journal of Modern Physics C · doi:10.1142/s0129183120501016 · Cited by 133
“In [46], the DW version of the bounded confidence model (i.”
BackgroundMethod
Metadata
- Authors
- Sîrbu, A., Pedreschi, D., Giannotti, F., & Kertész, J.
- Affiliations
- University of Pisa (IT)
- Istituto di Scienza e Tecnologie dell'Informazione "Alessandro Faedo" (IT)
- Budapest University of Technology and Economics (HU)
- Corresponding author
- Sîrbu, Alina
- Venue
- PLOS ONE
- Publisher
- Public Library of Science (PLoS)
- Published
- 2019-03-05
- Volume
- 14
- Issue
- 3
- Pages
- e0213246
- ISSN
- 1932-6203 (ISSN-L)
- PMC
- PMC6400382
- OpenAlex
- W2790854217
- Cited by
- 112
- References
- 56
- Citations by year
- 2026: 11 · 2025: 14 · 2024: 19 · 2023: 18 · 2022: 22 · 2021: 13 · 2020: 11 · 2019: 3
- FWCI
- 5.67
- Type
- journal article
- Language
- en
- Open access
- gold
- doi.org
- Licence
- Locations
- PLoS ONE (publishedVersion, cc-by)
- Europe PMC (PubMed Central) (publishedVersion, cc-by)
- PubMed Central (publishedVersion, cc-by)
- PubMed (publishedVersion)
- arXiv (Cornell University) (submittedVersion)
- Scuola Normale Superiore di Pisa (submittedVersion, cc-by)
- RePEc: Research Papers in Economics (submittedVersion)
- CINECA IRIS Institutial research information system (University of Pisa) (submittedVersion, cc-by)
- Archivio istituzionale della ricerca (Alma Mater Studiorum Università di Bologna) (submittedVersion)
- ISTI Open Portal (submittedVersion, other-oa)
- DOAJ (DOAJ: Directory of Open Access Journals) (submittedVersion, cc-by-sa)
- Open Research (Auckland University of Technology) (submittedVersion, cc-by)
- arXiv (Cornell University)
- Funders
- H2020 Future and Emerging Technologies (641191)
- Topics
- Physical Sciences › Physics and Astronomy › Statistical and Nonlinear Physics › Opinion Dynamics and Social Influence
- Social Sciences › Communication › Social Media and Politics
- Social Sciences › Sociology and Political Science › Media Influence and Politics
- Keywords
- algorithmic bias, opinion dynamics, bounded confidence model, opinion fragmentation, political polarization, social media, information filtering, convergence rate, consensus formation
- MeSH terms
- Algorithms, Computer Simulation, Humans, Models, Theoretical, Probability, Public Opinion
About these checks
Registry, retraction, Cites and statistics results are computed, not judged, with one exception: a printed reference that no index lists is read once by a model before it counts as a citation error. Claims are extracted by a model and kept only when their quote appears verbatim in the text; each cited source is then checked, with a model’s help, for whether it says what the claim relies on. Those verdicts can be wrong — read the claim’s quote and the cited source before relying on one.
Statistics and arithmetic are recomputed, not judged.
Confidence bands are shown only for fields calibrated on our annotated test set. None is calibrated yet, so no band is shown.
What counts as a claim ›How we measure confidence ›How we check this ›
Are you an author, or do you see a problem with this page? Request a review
Data sources
Bibliographic data: Semantic Scholar, OpenAlex, Crossref.
Contains information from the Semantic Scholar Academic Graph Datasets, made available under the ODC Attribution License (ODC-BY 1.0).
Semantic Scholar’s data is described in: Kinney, R., et al. (2023). The Semantic Scholar Open Data Platform. arXiv:2301.10140.
