

The DOI matches its Crossref record; 166 of the 173 references it cites were found in a registry or an index; none of the 23 sources its claims cite is checked for support yet.
Evolution and impact of bias in human and machine learning algorithm interaction
Open accessAbstract
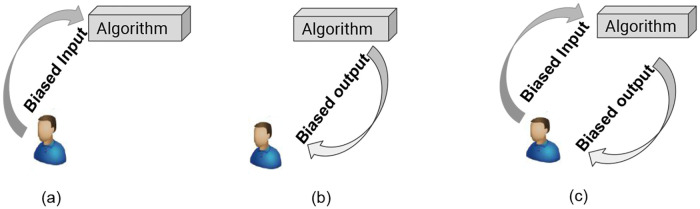
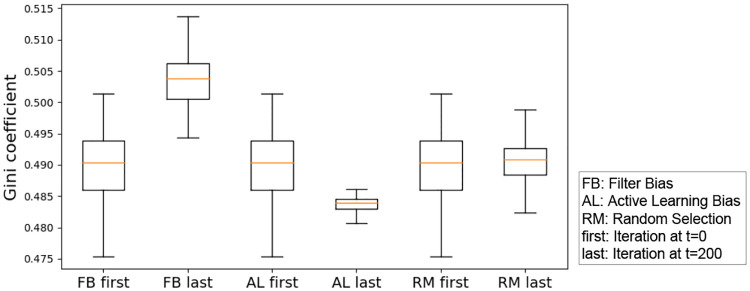
Traditionally, machine learning algorithms relied on reliable labels from experts to build predictions. More recently however, algorithms have been receiving data from the general population in the form of labeling, annotations, etc. The result is that algorithms are subject to bias that is born from ingesting unchecked information, such as biased samples and biased labels. Furthermore, people and algorithms are increasingly engaged in interactive processes wherein neither the human nor the algorithms receive unbiased data. Algorithms can also make biased predictions, leading to what is now known as algorithmic bias. On the other hand, human's reaction to the output of machine learning methods with algorithmic bias worsen the situations by making decision based on biased information, which will probably be consumed by algorithms later. Some recent research has focused on the ethical and moral implication of machine learning algorithmic bias on society. However, most research has so far treated algorithmic bias as a static factor, which fails to capture the dynamic and iterative properties of bias. We argue that algorithmic bias interacts with humans in an iterative manner, which has a long-term effect on algorithms' performance. For this purpose, we present an iterated-learning framework that is inspired from human language evolution to study the interaction between machine learning algorithms and humans. Our goal is to study two sources of bias that interact: the process by which people select information to label (human action); and the process by which an algorithm selects the subset of information to present to people (iterated algorithmic bias mode). We investigate three forms of iterated algorithmic bias (personalization filter, active learning, and random) and how they affect the performance of machine learning algorithms by formulating research questions about the impact of each type of bias. Based on statistical analyses of the results of several controlled experiments, we found that the three different iterated bias modes, as well as initial training data class imbalance and human action, do affect the models learned by machine learning algorithms. We also found that iterated filter bias, which is prominent in personalized user interfaces, can lead to more inequality in estimated relevance and to a limited human ability to discover relevant data. Our findings indicate that the relevance blind spot (items from the testing set whose predicted relevance probability is less than 0.5 and who thus risk being hidden from humans) amounted to 4% of all relevant items when using a content-based filter that predicts relevant items. A similar simulation using a real-life rating data set found that the same filter resulted in a blind spot size of 75% of the relevant testing set.
Overview
AI snapshot
Written from the paper’s full text.
TL;DR
The paper proposes an iterated-learning framework to study how algorithmic and human biases interact and evolve in recommendation/filtering loops. Across synthetic and MovieLens simulations, iterated filter bias consistently shifted learned relevance boundaries, increased prediction inequality, and enlarged blind spots that hide relevant items, while random selection and active learning often did not.
Key findings
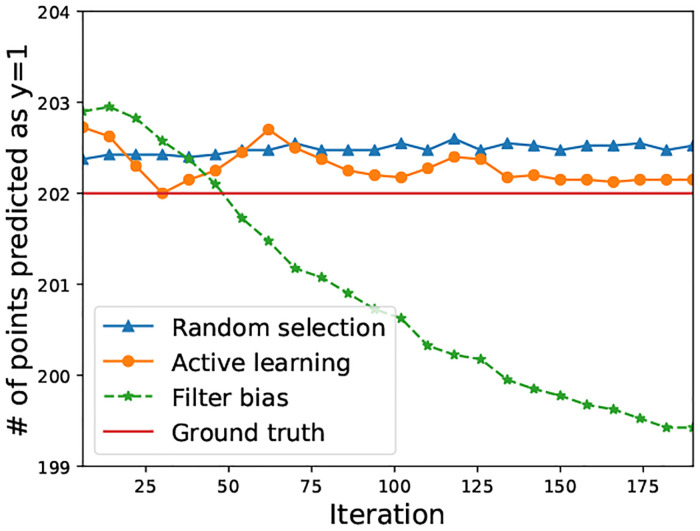
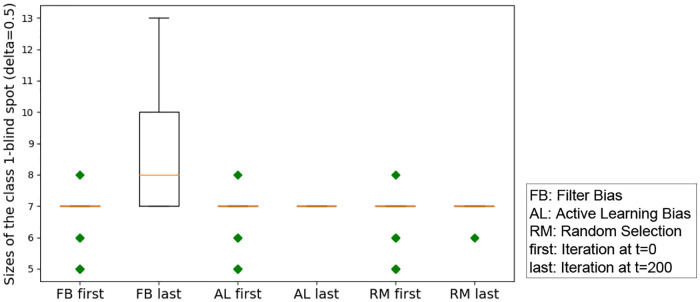
- Iterated filter bias had significant effects in 2D synthetic data: boundary shift p<.001, effect size = 1.96; class-1 blind spot p=2.4e-10, effect size = -1.22; all-classes blind spot p=5.9e-12, effect size = -1.44. Active learning and random selection did not significantly affect boundary shift (p=.15 and .77, respectively).
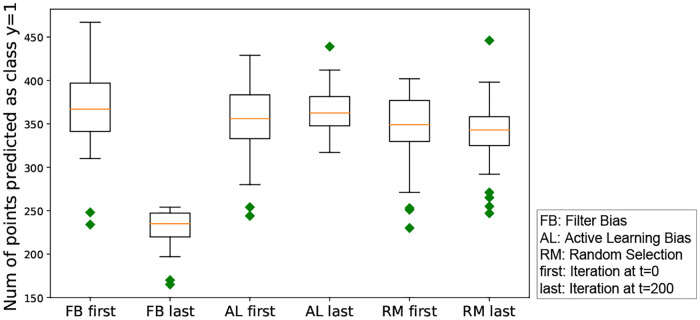
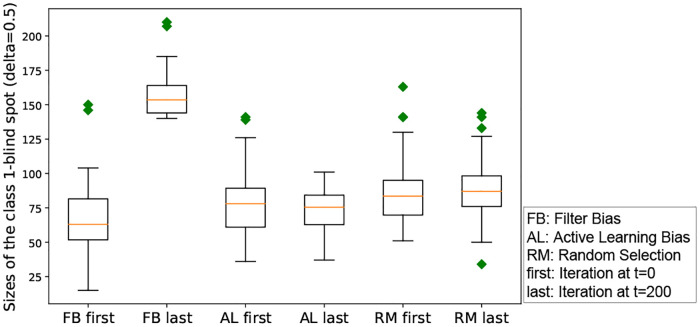
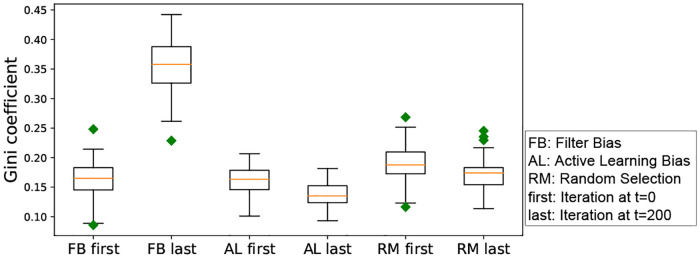
- On MovieLens real data, filter bias significantly decreased points predicted as class y=1 (p=7.1e-15, ES=1.88), increased class-1 blind spot (p=7.0e-15, ES=-1.89), and increased Gini inequality (p=7.7e-15, ES=-1.83); active learning also affected boundary shift and blind spot, while random selection did not significantly affect boundary or blind spot but decreased inequality.
- The abstract reports a relevance blind spot of 4% of all relevant items for a content-based filter in one simulation, and a blind spot size of 75% of the relevant testing set in a similar simulation using a real-life rating data set.
- Initial class imbalance and human action mattered: imbalanced initialization significantly affected boundary shift for all three bias modes (Kruskal-Wallis p=5.5e-19 filter, 3.27e-17 active learning, 1.34e-15 random); higher human action probability increased filter-bias boundary shift (p_action=1: p=0.4e-11, ES=3.087; p_action=0.5: p=1.8e-6, ES=0.87; p_action=0.01: p=.259). With class-dependent human action ratio 10:1, filter bias increased class-1 blind spot (p=1.1e-10, ES=-1.2) and random selection decreased it (p=.0008, ES=0.7).
Methods
- The authors use an iterated-learning framework inspired by language evolution, simplifying recommendation into a two-class classification problem (relevant/non-relevant) with a Naive Bayes classifier. They compare three selection mechanisms: random, active-bias, and filter-bias; human action probabilities of 1, 0.5, and 0.01; and a class-dependent action ratio of 10:1, running 200 iterations and 40 independent simulations per condition.
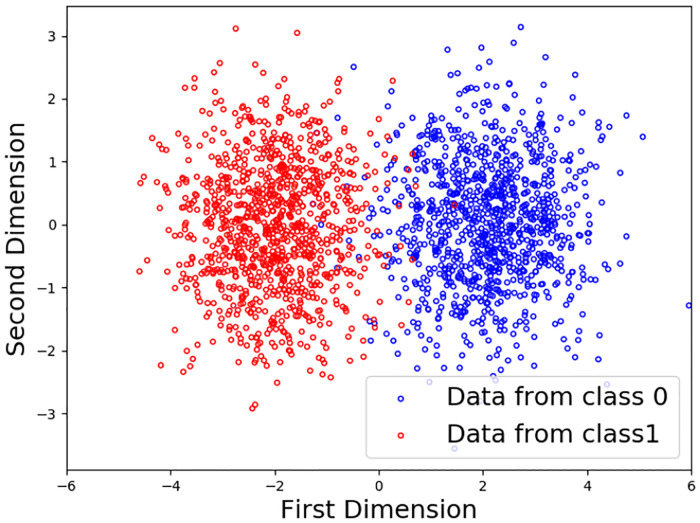
- Synthetic data: 2D Gaussian classes centered at {-2,0} and {2,0} with σ=1 and 1000 points per class, split into testing (200/class), validation (200/class), initialization ratios 10/100, 100/100, and 100/10, plus 3D, 4D, and 10D synthetic sets. Real data: MovieLens with 100,004 ratings on 9,125 movies from 671 users; user 547 (2,312 movies rated; 18 genres after filtering; PCA to 11 features) was studied first, then 7 more users; ratings were discretized as [1,3]=class 0 and (3,5]=class 1, with unbiased initialization only.
- Main analyses measure boundary shift, Gini coefficient, and blind spot size (δ=0.5), using Shapiro-Wilk, Mann-Whitney U, t-test, ANOVA, Kruskal-Wallis, and effect sizes.
Limitations
- The paper states future work will extend the framework to more users in a collaborative filtering setting, test additional parameters/configurations such as top-N recommendation list size and different active learning types beyond uncertainty-based active learning, and conduct human experiments similar to the simulated research questions.
- Evident from the text: the findings rely on simulations rather than human experiments, use a simplified two-class content-based recommendation setup with Naive Bayes and independent-feature assumptions, and the real-data experiments focus on one user at a time and only the 8 most active MovieLens users, with genres as item features and PCA.
- Evident from the text: for the real-life data set, the authors only explore unbiased initialization and assume action probabilities of 1, so human-action and class-imbalance effects are not tested on the real data.
Model-written summary. Check it against the paper before relying on it.
Integrity signals
Registry
Cites
Statistics
Figures

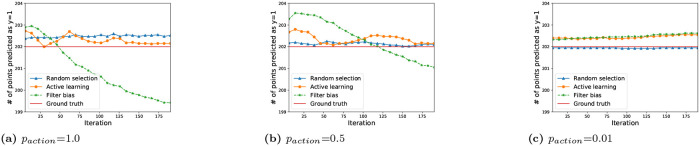
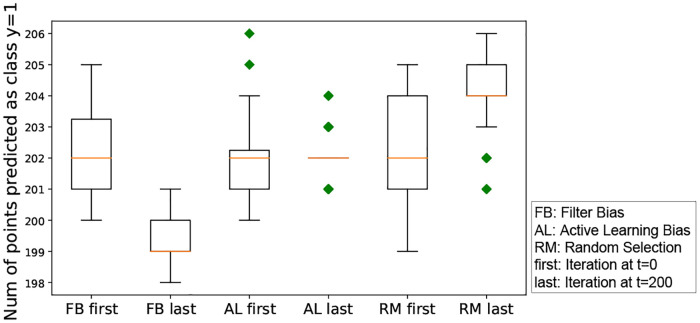
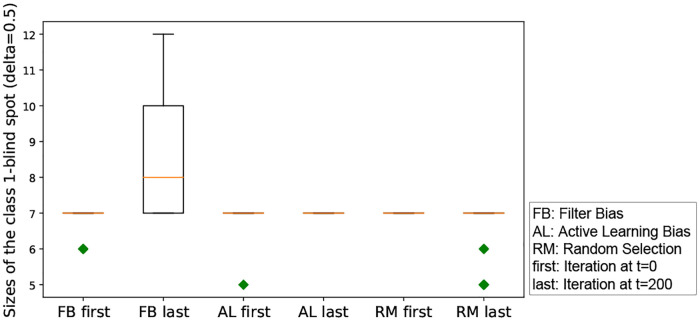
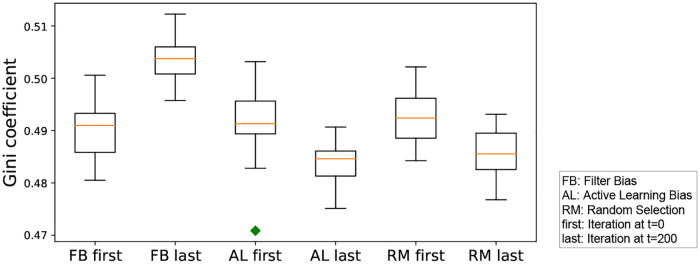
Verification
Claims the paper makes
71 Own result · 34 Own interpretation · 16 No basis given · 12 Not checked yet
The paper states this without a source or data behind it here, so there is nothing to check it against. The quote shows it is in the paper.
In the paper
“A similar simulation using a real-life rating data set found that the same filter resulted in a blind spot size of 75% of the relevant testing set.”
§ Evolution and impact of bias in human and machine learning algorithm interaction > Abstract
plaindirect- Asserted: passes — The authors put it forward as true.
- Checkable: passes — It can be checked against evidence.
- Load-bearing: unclear — It is unclear whether the paper’s conclusions depend on it.
- Based: unclear — It is unclear why the paper says it holds.
A result the paper reports from its own data — it cites no other source for it, so there is none to check. The quote shows it is in the paper.
In the paper
“Based on statistical analyses of the results of several controlled experiments, we found that the three different iterated bias modes, as well as initial training data class imbalance and human action, do affect the models learned by machine learning algorithms.”
§ Evolution and impact of bias in human and machine learning algorithm interaction > Abstract
plaindirect- Asserted: passes — The authors put it forward as true.
- Checkable: passes — It can be checked against evidence.
- Load-bearing: passes — The paper’s conclusions depend on it.
- Based: passes — The paper gives a reason why it holds.
A result the paper reports from its own data — it cites no other source for it, so there is none to check. The quote shows it is in the paper.
In the paper
“Our findings indicate that the relevance blind spot (items from the testing set whose predicted relevance probability is less than 0.5 and who thus risk being hidden from humans) amounted to 4% of all relevant items when using a content-based filter that predicts relevant items.”
§ Evolution and impact of bias in human and machine learning algorithm interaction > Abstract
hedged- Asserted: passes — The authors put it forward as true.
- Checkable: passes — It can be checked against evidence.
- Load-bearing: passes — The paper’s conclusions depend on it.
- Based: passes — The paper gives a reason why it holds.
A result the paper reports from its own data — it cites no other source for it, so there is none to check. The quote shows it is in the paper.
In the paper
“Despite the small effect, the iterated algorithmic bias forms affect this distribution in different ways, and iterated filter bias causes the largest heterogeneity level as can be seen in Fig 6.”
§ Evolution and impact of bias in human and machine learning algorithm interaction > Results > Experiments on 2D synthetic data
plaindirect- Asserted: passes — The authors put it forward as true.
- Checkable: passes — It can be checked against evidence.
- Load-bearing: unclear — It is unclear whether the paper’s conclusions depend on it.
- Based: passes — The paper gives a reason why it holds.
A result the paper reports from its own data — it cites no other source for it, so there is none to check. The quote shows it is in the paper.
In the paper
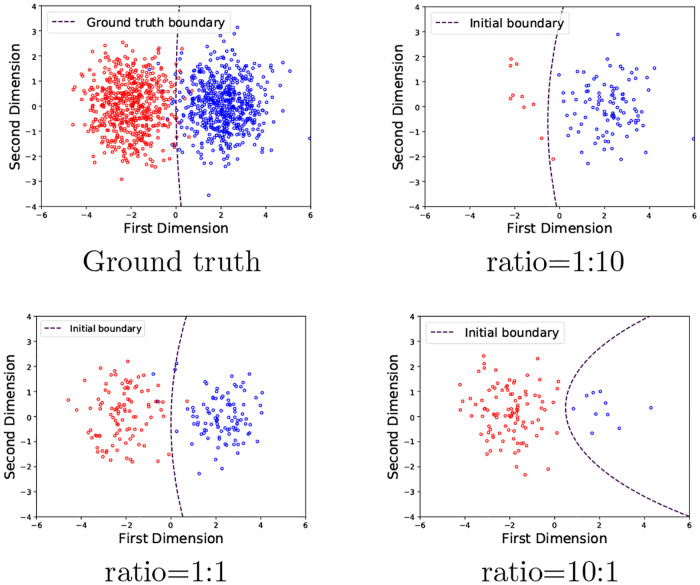
“On the other hand, the boundary shift of filter bias has a big difference when the ratio is 1:10, indicating that filter bias has a dramatic impact on the boundary shift when the imbalanced initialization ratio is high and more points are from the irrelevant class.”
§ Evolution and impact of bias in human and machine learning algorithm interaction > Results > Experiments on 2D synthetic data
hedgeddirect- Asserted: passes — The authors put it forward as true.
- Checkable: passes — It can be checked against evidence.
- Load-bearing: passes — The paper’s conclusions depend on it.
- Based: passes — The paper gives a reason why it holds.
A result the paper reports from its own data — it cites no other source for it, so there is none to check. The quote shows it is in the paper.
In the paper
“In all cases and regardless of whether extreme filtering, AL, or random selection is used to collect feedback from the user, the initial class imbalance has a significant impact on the shift in the learned model’s boundary between relevant and non-relevant items.”
§ Evolution and impact of bias in human and machine learning algorithm interaction > Results > Experiments on 2D synthetic data
plaindirect- Asserted: passes — The authors put it forward as true.
- Checkable: passes — It can be checked against evidence.
- Load-bearing: passes — The paper’s conclusions depend on it.
- Based: passes — The paper gives a reason why it holds.
A result the paper reports from its own data — it cites no other source for it, so there is none to check. The quote shows it is in the paper.
In the paper
“As shown in Fig 8, highly imbalanced class initialization leads to a bigger difference between the learned boundary and the ground-truth boundary.”
- Also stated in: § Conclusion · plain
“Highly imbalanced class initialization leads to a bigger difference between the learned boundary and the ground-truth boundary.”
§ Evolution and impact of bias in human and machine learning algorithm interaction > Results > Experiments on 2D synthetic data
plaindirect- Asserted: passes — The authors put it forward as true.
- Checkable: passes — It can be checked against evidence.
- Load-bearing: passes — The paper’s conclusions depend on it.
- Based: passes — The paper gives a reason why it holds.
- Also stated in: § Conclusion · plain
A result the paper reports from its own data — it cites no other source for it, so there is none to check. The quote shows it is in the paper.
In the paper
“The results indicate significant differences for the filter bias condition (p <.001 by Mann-Whitney test or t-test, effect size = 1.96).”
§ Evolution and impact of bias in human and machine learning algorithm interaction > Results > Experiments on 2D synthetic data
hedgedcorrelational- Asserted: passes — The authors put it forward as true.
- Checkable: passes — It can be checked against evidence.
- Load-bearing: passes — The paper’s conclusions depend on it.
- Based: passes — The paper gives a reason why it holds.
A result the paper reports from its own data — it cites no other source for it, so there is none to check. The quote shows it is in the paper.
In the paper
“Filter bias has significant effects on the class-1-blind spot, while random selection and active learning do not have a significant effect on the class-1-blind spot size (see Fig 7).”
§ Evolution and impact of bias in human and machine learning algorithm interaction > Results > Experiments on 2D synthetic data
plaindirect- Asserted: passes — The authors put it forward as true.
- Checkable: passes — It can be checked against evidence.
- Load-bearing: passes — The paper’s conclusions depend on it.
- Based: passes — The paper gives a reason why it holds.
A result the paper reports from its own data — it cites no other source for it, so there is none to check. The quote shows it is in the paper.
In the paper
“Filter bias, on the other hand, results in decreasing numbers of points predicted in the target category class 1, consistent with an overly restrictive category boundary.”
§ Evolution and impact of bias in human and machine learning algorithm interaction > Results > Experiments on 2D synthetic data
plaindirect- Asserted: passes — The authors put it forward as true.
- Checkable: passes — It can be checked against evidence.
- Load-bearing: passes — The paper’s conclusions depend on it.
- Based: passes — The paper gives a reason why it holds.
- It may state two separate claims as one. 33
- The quote only partly states this claim. 5
- Borderline: one of the tests for a substantial claim is unclear. 1
- Probably not a substantial claim. 11
A result the paper reports from its own data — it cites no other source for it, so there is none to check. The quote shows it is in the paper.
In the paper
“We also found that iterated filter bias, which is prominent in personalized user interfaces, can lead to more inequality in estimated relevance and to a limited human ability to discover relevant data.”
§ Evolution and impact of bias in human and machine learning algorithm interaction > Abstract
plaindirect- Asserted: passes — The authors put it forward as true.
- Checkable: passes — It can be checked against evidence.
- Load-bearing: passes — The paper’s conclusions depend on it.
- Based: passes — The paper gives a reason why it holds.
It may state two separate claims as one.
A result the paper reports from its own data — it cites no other source for it, so there is none to check. The quote shows it is in the paper.
In the paper
“The Number of label-changed points with ratio = 10:1 is higher than 2 for ratio = 1:1 in the iterated filter bias mode, and a similar result can be seen with iterated active learning bias and iterated random selection (see Fig 9).”
§ Evolution and impact of bias in human and machine learning algorithm interaction > Results > Experiments on 2D synthetic data
plaincorrelational- Asserted: passes — The authors put it forward as true.
- Checkable: passes — It can be checked against evidence.
- Load-bearing: passes — The paper’s conclusions depend on it.
- Based: passes — The paper gives a reason why it holds.
It may state two separate claims as one.
A result the paper reports from its own data — it cites no other source for it, so there is none to check. The quote shows it is in the paper.
In the paper
“Fig 5 shows that random selection and active learning bias converge to the ground-truth boundary.”
§ Evolution and impact of bias in human and machine learning algorithm interaction > Results > Experiments on 2D synthetic data
plain- Asserted: passes — The authors put it forward as true.
- Checkable: passes — It can be checked against evidence.
- Load-bearing: passes — The paper’s conclusions depend on it.
- Based: passes — The paper gives a reason why it holds.
It may state two separate claims as one.
A result the paper reports from its own data — it cites no other source for it, so there is none to check. The quote shows it is in the paper.
In the paper
“Both Filter bias and active learning bias show no significant difference between the two ratios.”
§ Evolution and impact of bias in human and machine learning algorithm interaction > Results > Experiments on 2D synthetic data
plain- Asserted: passes — The authors put it forward as true.
- Checkable: passes — It can be checked against evidence.
- Load-bearing: passes — The paper’s conclusions depend on it.
- Based: passes — The paper gives a reason why it holds.
It may state two separate claims as one. The quote only partly states this claim.
A result the paper reports from its own data — it cites no other source for it, so there is none to check. The quote shows it is in the paper.
In the paper
“Both active learning and random selection decrease the inequality.”
- Also stated in: § Experiments on 2D synthetic data · boosted
“random selection significantly decrease the Gini coefficient, as well as the active learning.”
§ Evolution and impact of bias in human and machine learning algorithm interaction > Results > Experiments on 2D synthetic data
boosteddirect- Asserted: passes — The authors put it forward as true.
- Checkable: passes — It can be checked against evidence.
- Load-bearing: passes — The paper’s conclusions depend on it.
- Based: passes — The paper gives a reason why it holds.
It may state two separate claims as one.
- Also stated in: § Experiments on 2D synthetic data · boosted
A result the paper reports from its own data — it cites no other source for it, so there is none to check. The quote shows it is in the paper.
In the paper
“Table 16 shows that there is a significant increase in the class-1 blind spot sizes in the testing set for iterated filter bias and active learning bias.”
§ Evolution and impact of bias in human and machine learning algorithm interaction > Results > Experiments on the real-life data set
plaindirect- Asserted: passes — The authors put it forward as true.
- Checkable: passes — It can be checked against evidence.
- Load-bearing: passes — The paper’s conclusions depend on it.
- Based: passes — The paper gives a reason why it holds.
The quote only partly states this claim.
The paper states this without a source or data behind it here, so there is nothing to check it against. The quote shows it is in the paper.
In the paper
“A similar impact was found when the initial labeled (training) set is class imbalanced with more relevant items than non relevant items.”
§ Evolution and impact of bias in human and machine learning algorithm interaction > Results > Experiments on the real-life data set
plaincorrelational- Asserted: passes — The authors put it forward as true.
- Checkable: passes — It can be checked against evidence.
- Load-bearing: unclear — It is unclear whether the paper’s conclusions depend on it.
- Based: unclear — It is unclear why the paper says it holds.
Borderline substantial claim. It is unclear whether the paper’s conclusions depend on it. It is unclear why the paper says it holds.
A result the paper reports from its own data — it cites no other source for it, so there is none to check. The quote shows it is in the paper.
In the paper
“On the other hand, random selection decreases the class-1 blind spot size.”
§ Evolution and impact of bias in human and machine learning algorithm interaction > Results > Experiments on 2D synthetic data
plaindirect- Asserted: passes — The authors put it forward as true.
- Checkable: passes — It can be checked against evidence.
- Load-bearing: unclear — It is unclear whether the paper’s conclusions depend on it.
- Based: passes — The paper gives a reason why it holds.
The quote only partly states this claim.
A result the paper reports from its own data — it cites no other source for it, so there is none to check. The quote shows it is in the paper.
In the paper
“Both iterated filter bias and iterated active learning bias have a significantly effect on the boundary shift”
§ Evolution and impact of bias in human and machine learning algorithm interaction > Conclusion
plaindirect- Asserted: passes — The authors put it forward as true.
- Checkable: passes — It can be checked against evidence.
- Load-bearing: passes — The paper’s conclusions depend on it.
- Based: passes — The paper gives a reason why it holds.
It may state two separate claims as one.
A result the paper reports from its own data — it cites no other source for it, so there is none to check. The quote shows it is in the paper.
In the paper
“We conclude that both iterated filter bias and iterated active learning bias have a significantly effect on the boundary shift, while random selection does not have a significant effect.”
§ Evolution and impact of bias in human and machine learning algorithm interaction > Results > Experiments on the real-life data set
plaindirect- Asserted: passes — The authors put it forward as true.
- Checkable: passes — It can be checked against evidence.
- Load-bearing: passes — The paper’s conclusions depend on it.
- Based: passes — The paper gives a reason why it holds.
It may state two separate claims as one.
A result the paper reports from its own data — it cites no other source for it, so there is none to check. The quote shows it is in the paper.
In the paper
“while both active learning and random selection result in a significant decrease in the Gini coefficient.”
§ Evolution and impact of bias in human and machine learning algorithm interaction > Results > Experiments on the real-life data set
plaindirect- Asserted: passes — The authors put it forward as true.
- Checkable: passes — It can be checked against evidence.
- Load-bearing: passes — The paper’s conclusions depend on it.
- Based: passes — The paper gives a reason why it holds.
It may state two separate claims as one.
A result the paper reports from its own data — it cites no other source for it, so there is none to check. The quote shows it is in the paper.
In the paper
“Both Filter bias and active learning bias show no significant difference between the two ratios.”
§ Evolution and impact of bias in human and machine learning algorithm interaction > Results > Experiments on 2D synthetic data
plain- Asserted: passes — The authors put it forward as true.
- Checkable: passes — It can be checked against evidence.
- Load-bearing: passes — The paper’s conclusions depend on it.
- Based: passes — The paper gives a reason why it holds.
It may state two separate claims as one.
The paper states this without a source or data behind it here, so there is nothing to check it against. The quote shows it is in the paper.
In the paper
“For both filter bias and active learning, the number of points predicted as class y = 1, with and without the class-dependent human action probability, show no significant difference.”
§ Evolution and impact of bias in human and machine learning algorithm interaction > Conclusion
plain- Asserted: passes — The authors put it forward as true.
- Checkable: passes — It can be checked against evidence.
- Load-bearing: passes — The paper’s conclusions depend on it.
- Based: passes — The paper gives a reason why it holds.
It may state two separate claims as one.
A result the paper reports from its own data — it cites no other source for it, so there is none to check. The quote shows it is in the paper.
In the paper
“The p-value is 3.4e-15 (<0.01), which indicates that they have different effects on the boundary shift (see Fig 12).”
§ Evolution and impact of bias in human and machine learning algorithm interaction > Results > Experiments on 2D synthetic data
hedgedcorrelational- Asserted: passes — The authors put it forward as true.
- Checkable: passes — It can be checked against evidence.
- Load-bearing: passes — The paper’s conclusions depend on it.
- Based: passes — The paper gives a reason why it holds.
The quote only partly states this claim.
A result the paper reports from its own data — it cites no other source for it, so there is none to check. The quote shows it is in the paper.
In the paper
“while both active learning and random selection show a significant decrease in the Gini coefficient”
§ Evolution and impact of bias in human and machine learning algorithm interaction > Conclusion
plaindirect- Asserted: passes — The authors put it forward as true.
- Checkable: passes — It can be checked against evidence.
- Load-bearing: passes — The paper’s conclusions depend on it.
- Based: passes — The paper gives a reason why it holds.
It may state two separate claims as one.
The paper states this without a source or data behind it here, so there is nothing to check it against. The quote shows it is in the paper.
In the paper
“Common to both recommender systems and information filters is: (1) selection, of a subset of data about which people express their preference, by a process that is not random sampling, and (2) an iterative learning process in which people’s responses to the selected subset are used to train the algorithm for subsequent iterations.”
§ Evolution and impact of bias in human and machine learning algorithm interaction > Introduction
plain- Asserted: passes — The authors put it forward as true.
- Checkable: passes — It can be checked against evidence.
- Load-bearing: passes — The paper’s conclusions depend on it.
- Based: passes — The paper gives a reason why it holds.
It may state two separate claims as one.
The paper states this without a source or data behind it here, so there is nothing to check it against. The quote shows it is in the paper.
In the paper
“The data used to train and optimize performance of these systems are based on human actions. Thus, data that are observed and omitted are not randomly selected, but are the consequences of people’s choices.”
§ Evolution and impact of bias in human and machine learning algorithm interaction > Introduction
plaindirect- Asserted: passes — The authors put it forward as true.
- Checkable: passes — It can be checked against evidence.
- Load-bearing: passes — The paper’s conclusions depend on it.
- Based: passes — The paper gives a reason why it holds.
It may state two separate claims as one.
The paper states this without a source or data behind it here, so there is nothing to check it against. The quote shows it is in the paper.
In the paper
“However, most research has so far treated algorithmic bias as a static factor, which fails to capture the dynamic and iterative properties of bias.”
- Also stated in: § Relationship between iterated algorithmic bias and other types of bias · plain
“we observe that most previous research has treated algorithmic bias as a static factor, which fails to capture the iterative nature of bias that is borne from continuous interaction between humans and algorithms.”
§ Evolution and impact of bias in human and machine learning algorithm interaction > Abstract
plaindirect- Asserted: passes — The authors put it forward as true.
- Checkable: passes — It can be checked against evidence.
- Load-bearing: passes — The paper’s conclusions depend on it.
- Based: passes — The paper gives a reason why it holds.
Probably not a substantial claim.
- Also stated in: § Relationship between iterated algorithmic bias and other types of bias · plain
A conclusion the paper draws from its own results — it cites no other source for it, so there is none to check. The quote shows it is in the paper.
In the paper
“We argue that algorithmic bias interacts with humans in an iterative manner, which has a long-term effect on algorithms’ performance.”
- Also stated in: § Relationship between iterated algorithmic bias and other types of bias · hedged
“We argue that algorithmic bias evolves with human interaction in an iterative manner, which may have a long-term effect on algorithm performance and humans’ discovery and learning.”
§ Evolution and impact of bias in human and machine learning algorithm interaction > Abstract
plainconditional- Asserted: passes — The authors put it forward as true.
- Checkable: passes — It can be checked against evidence.
- Load-bearing: passes — The paper’s conclusions depend on it.
- Based: unclear — It is unclear why the paper says it holds.
It may state two separate claims as one.
- Also stated in: § Relationship between iterated algorithmic bias and other types of bias · hedged
A conclusion the paper draws from its own results — it cites no other source for it, so there is none to check. The quote shows it is in the paper.
In the paper
“On the other hand, human’s reaction to the output of machine learning methods with algorithmic bias worsen the situations by making decision based on biased information, which will probably be consumed by algorithms later.”
§ Evolution and impact of bias in human and machine learning algorithm interaction > Abstract
hedgeddirect- Asserted: passes — The authors put it forward as true.
- Checkable: passes — It can be checked against evidence.
- Load-bearing: passes — The paper’s conclusions depend on it.
- Based: unclear — It is unclear why the paper says it holds.
It may state two separate claims as one.
In the paper
“Perfors et al. showed that, when certain assumptions about the independence of language and the world are abandoned, the learners converge to languages that depend on the structure as well as their prior biases [78].”
§ Evolution and impact of bias in human and machine learning algorithm interaction > Related work > Iterated learning and language evolution
What the sources say
- Not checked yetcites [78] A Perfors, 2014, Language evolution can be shaped by the structure of the world, Cognitive science source
plaindirect- Asserted: passes — The authors put it forward as true.
- Checkable: passes — It can be checked against evidence.
- Load-bearing: fails — The paper’s conclusions may not depend on it.
- Based: passes — The paper gives a reason why it holds.
Probably not a substantial claim. The paper’s conclusions may not depend on it.
A conclusion the paper draws from its own results — it cites no other source for it, so there is none to check. The quote shows it is in the paper.
In the paper
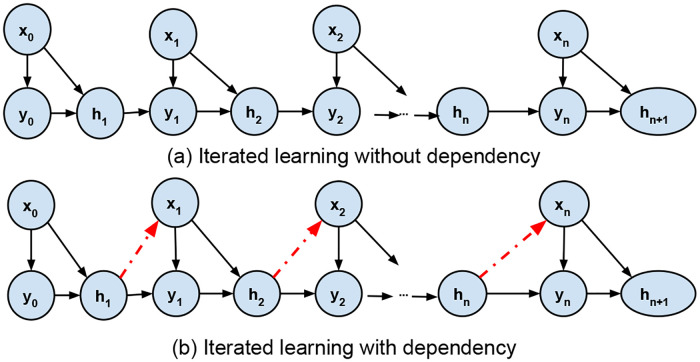
“More specifically in our setting, there is a dependency between the previous output and the next input, and it is this dependency that can generate iterated bias.”
§ Evolution and impact of bias in human and machine learning algorithm interaction > Related work > Iterated learning and language evolution
plaindirect- Asserted: passes — The authors put it forward as true.
- Checkable: passes — It can be checked against evidence.
- Load-bearing: passes — The paper’s conclusions depend on it.
- Based: passes — The paper gives a reason why it holds.
It may state two separate claims as one.
A conclusion the paper draws from its own results — it cites no other source for it, so there is none to check. The quote shows it is in the paper.
In the paper
“Specifically, the selection of relevant data allows the possibility of learning that an input that is predicted to be relevant is not, but does not allow the possibility of learning that an input that is predicted to be irrelevant is actually relevant.”
§ Evolution and impact of bias in human and machine learning algorithm interaction > Iterated algorithmic bias in online learning > Iterated learning with iterated filter-bias dependency
plaindirect- Asserted: passes — The authors put it forward as true.
- Checkable: passes — It can be checked against evidence.
- Load-bearing: passes — The paper’s conclusions depend on it.
- Based: passes — The paper gives a reason why it holds.
It may state two separate claims as one.
A conclusion the paper draws from its own results — it cites no other source for it, so there is none to check. The quote shows it is in the paper.
In the paper
“By deriving the transition matrices implied by iterated application of data selection biases, we can see that both active learning and filtering have different goals, but focus on an ever more extreme (and therefore not representative) subset of data.”
§ Evolution and impact of bias in human and machine learning algorithm interaction > Iterated algorithmic bias in online learning > Iterated learning with iterated active-bias dependency
plaindirect- Asserted: passes — The authors put it forward as true.
- Checkable: passes — It can be checked against evidence.
- Load-bearing: passes — The paper’s conclusions depend on it.
- Based: passes — The paper gives a reason why it holds.
It may state two separate claims as one.
In the paper
“After sufficient iterations, this process generates a certain hypothesis. This iterated learning chain is expected to converge the hypothesis to the prior distribution of all hypotheses in case that the learner is a Bayesian learner [69].”
§ Evolution and impact of bias in human and machine learning algorithm interaction > Related work > Iterated learning and language evolution
What the sources say
- Not checked yetcites [69] TL Griffiths, 2005
plaindirect- Asserted: passes — The authors put it forward as true.
- Checkable: passes — It can be checked against evidence.
- Load-bearing: fails — The paper’s conclusions may not depend on it.
- Based: passes — The paper gives a reason why it holds.
Probably not a substantial claim. The paper’s conclusions may not depend on it. It may state two separate claims as one.
In the paper
“Generally, selecting biased training samples leads to a biased model [96].”
§ Evolution and impact of bias in human and machine learning algorithm interaction > Related work > Relationship between iterated algorithmic bias and other types of bias
What the sources say
- Not checked yetcites [96] Heckman JJ. Sample selection bias as a specification error (with an application to the estimation of labor supply functions); 1977. source
plaindirect- Asserted: passes — The authors put it forward as true.
- Checkable: passes — It can be checked against evidence.
- Load-bearing: fails — The paper’s conclusions may not depend on it.
- Based: passes — The paper gives a reason why it holds.
Probably not a substantial claim. The paper’s conclusions may not depend on it.
In the paper
“For a rating based recommendation system, the ranking is based on the prediction from the system, or the probability of relevance from prediction. In both situations, the selected data point x is likely to be highly rated or relevant, given h.”
§ Evolution and impact of bias in human and machine learning algorithm interaction > Iterated algorithmic bias in online learning > Iterated learning with iterated filter-bias dependency
What the sources say
- Not checked yetcites [2] SE Robertson, 1977, The probability ranking principle in IR, Journal of documentation source
hedgedcorrelational- Asserted: passes — The authors put it forward as true.
- Checkable: passes — It can be checked against evidence.
- Load-bearing: passes — The paper’s conclusions depend on it.
- Based: passes — The paper gives a reason why it holds.
It may state two separate claims as one.
A conclusion the paper draws from its own results — it cites no other source for it, so there is none to check. The quote shows it is in the paper.
In the paper
“Alternatively, the utility of acting may depend on the value of y*. For example, it may be that there is greater perceived utility in acting when the value of y* is very low, as in the case of an angry customer or disappointed user.”
§ Evolution and impact of bias in human and machine learning algorithm interaction > Iterated algorithmic bias in online learning > Iterated learning with human action bias
hedgedconditional- Asserted: passes — The authors put it forward as true.
- Checkable: passes — It can be checked against evidence.
- Load-bearing: fails — The paper’s conclusions may not depend on it.
- Based: fails — The paper may give no reason why it holds.
Probably not a substantial claim. The paper’s conclusions may not depend on it. The paper may give no reason why it holds. It may state two separate claims as one.
None of the sources cited for this claim have been checked yet.
In the paper
“The post-algorithmic bias emerges when users interpret the output of machine learning algorithms [97–100].”
§ Evolution and impact of bias in human and machine learning algorithm interaction > Related work > Relationship between iterated algorithmic bias and other types of bias
What the sources say
- Not checked yetcites [97] Baeza-Yates R. Data and algorithmic bias in the web. In: Proceedings of the 8th ACM Conference on Web Science. ACM; 2016. p. 1–1. source
- Not checked yetcites [98] Pedreshi D, Ruggieri S, Turini F. Discrimination-aware data mining. In: Proceedings of the 14th ACM SIGKDD international conference on Knowledge discovery and data mining. ACM; 2008. p. 560–568. source
- Not checked yetcites [99] White R. Beliefs and biases in web search. In: Proceedings of the 36th international ACM SIGIR conference on Research and development in information retrieval. ACM; 2013. p. 3–12. source
- Not checked yetcites [100] M Ayub, 2019, Modeling user rating preference behavior to improve the performance of the collaborative filtering based recommender systems, PloS one source
plaindirect- Asserted: passes — The authors put it forward as true.
- Checkable: passes — It can be checked against evidence.
- Load-bearing: fails — The paper’s conclusions may not depend on it.
- Based: passes — The paper gives a reason why it holds.
Probably not a substantial claim. The paper’s conclusions may not depend on it.
None of the sources cited for this claim have been checked yet.
In the paper
“Iterated learning was found to produce meaningful structure patterns in language learning [72–76].”
§ Evolution and impact of bias in human and machine learning algorithm interaction > Related work > Iterated learning and language evolution
What the sources say
- Not checked yetcites [72] S Kirby, 2014, Iterated learning and the evolution of language, Current opinion in neurobiology source
- Not checked yetcites [73] S Kirby, 2008, Cumulative cultural evolution in the laboratory: An experimental approach to the origins of structure in human language, Proceedings of the National Academy of Sciences source
- Not checked yetcites [74] ML Kalish, 2007, Iterated learning: Intergenerational knowledge transmission reveals inductive biases, Psychonomic Bulletin & Review source
- Not checked yetcites [75] Smith K. Iterated learning in populations of Bayesian agents. In: Proceedings of the 31st annual conference of the cognitive science society. Citeseer; 2009. p. 697–702.
- Not checked yetcites [76] K Smith, 2003, Iterated learning: A framework for the emergence of language, Artificial life source
plaindirect- Asserted: passes — The authors put it forward as true.
- Checkable: passes — It can be checked against evidence.
- Load-bearing: fails — The paper’s conclusions may not depend on it.
- Based: passes — The paper gives a reason why it holds.
Probably not a substantial claim. The paper’s conclusions may not depend on it.
A conclusion the paper draws from its own results — it cites no other source for it, so there is none to check. The quote shows it is in the paper.
In the paper
“The selection of inputs depends on the hypothesis, and therefore information is not unbiased, p(x|hn)≠q(x).”
§ Evolution and impact of bias in human and machine learning algorithm interaction > Iterated algorithmic bias in online learning > Iterated learning with iterated filter-bias dependency
plaindirect- Asserted: passes — The authors put it forward as true.
- Checkable: passes — It can be checked against evidence.
- Load-bearing: passes — The paper’s conclusions depend on it.
- Based: passes — The paper gives a reason why it holds.
It may state two separate claims as one.
A conclusion the paper draws from its own results — it cites no other source for it, so there is none to check. The quote shows it is in the paper.
In the paper
“The limiting behavior depends on the iterated active learning bias, . This is, in most cases, in opposition to the goal of filtering, the algorithm will only select data point(s) which are closest to the learned model’s boundary, if we are learning a classifier for example.”
§ Evolution and impact of bias in human and machine learning algorithm interaction > Iterated algorithmic bias in online learning > Iterated learning with iterated active-bias dependency
hedgeddirect- Asserted: passes — The authors put it forward as true.
- Checkable: passes — It can be checked against evidence.
- Load-bearing: passes — The paper’s conclusions depend on it.
- Based: passes — The paper gives a reason why it holds.
It may state two separate claims as one.
- The authors state this as an assumption: A simplified algorithm where only the very uncertain data are selected, and a mixture of random sampling and active learning, is assumed.
The paper states this without a source or data behind it here, so there is nothing to check it against. The quote shows it is in the paper.
In the paper
“Humans’ choices, when labelling data, are also highly non-random, and would reflect not only their opinions about the presented content, but also inferences about why the content was presented.”
§ Evolution and impact of bias in human and machine learning algorithm interaction > Introduction
hedgedcorrelational- Asserted: passes — The authors put it forward as true.
- Checkable: passes — It can be checked against evidence.
- Load-bearing: passes — The paper’s conclusions depend on it.
- Based: unclear — It is unclear why the paper says it holds.
It may state two separate claims as one.
A conclusion the paper draws from its own results — it cites no other source for it, so there is none to check. The quote shows it is in the paper.
In the paper
“Finally, the bias that is introduced into the data at any point can be amplified after retraining models and this in turn would further impact the predictions or recommendations.”
§ Evolution and impact of bias in human and machine learning algorithm interaction > Introduction
hedgeddirect- Asserted: passes — The authors put it forward as true.
- Checkable: passes — It can be checked against evidence.
- Load-bearing: passes — The paper’s conclusions depend on it.
- Based: unclear — It is unclear why the paper says it holds.
It may state two separate claims as one.
In the paper
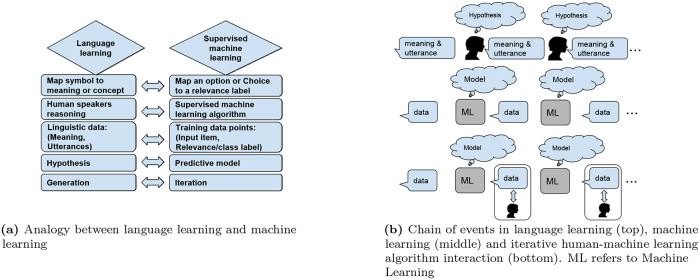
“Language learning and machine learning have several properties in common (see Fig 1). For example, a ‘hypothesis’ in language is analogous to a ‘model’ in machine learning. Learning a language which gets transmitted throughout consecutive generations of humans is analogous to learning an online model throughout consecutive iterations of machine learning [69].”
§ Evolution and impact of bias in human and machine learning algorithm interaction > Related work > Iterated learning and language evolution
What the sources say
- Not checked yetcites [69] TL Griffiths, 2005
plaincorrelational- Asserted: passes — The authors put it forward as true.
- Checkable: passes — It can be checked against evidence.
- Load-bearing: fails — The paper’s conclusions may not depend on it.
- Based: passes — The paper gives a reason why it holds.
Probably not a substantial claim. The paper’s conclusions may not depend on it. It may state two separate claims as one.
The paper states this without a source or data behind it here, so there is nothing to check it against. The quote shows it is in the paper.
In the paper
“One reason is that recommendation systems have more direct interaction options with humans, while information retrieval focuses on getting relevant information only.”
§ Evolution and impact of bias in human and machine learning algorithm interaction > Related work > Relationship between iterated algorithmic bias and other types of bias
plaincorrelational- Asserted: passes — The authors put it forward as true.
- Checkable: passes — It can be checked against evidence.
- Load-bearing: passes — The paper’s conclusions depend on it.
- Based: fails — The paper may give no reason why it holds.
Probably not a substantial claim. The paper may give no reason why it holds. It may state two separate claims as one.
A conclusion the paper draws from its own results — it cites no other source for it, so there is none to check. The quote shows it is in the paper.
In the paper
“Unlike standard learning theory, the training data are no longer randomly sampled. This in return puts in questions the guarantees about learning from such data.”
§ Evolution and impact of bias in human and machine learning algorithm interaction > Introduction
plaindirect- Asserted: passes — The authors put it forward as true.
- Checkable: passes — It can be checked against evidence.
- Load-bearing: passes — The paper’s conclusions depend on it.
- Based: passes — The paper gives a reason why it holds.
It may state two separate claims as one.
A conclusion the paper draws from its own results — it cites no other source for it, so there is none to check. The quote shows it is in the paper.
In the paper
“Either of the individual sources of bias could yield instability, thus motivating the need for a better understanding of the performance of such systems in the context of human-algorithm interactions.”
§ Evolution and impact of bias in human and machine learning algorithm interaction > Introduction
hedgedconditional- Asserted: passes — The authors put it forward as true.
- Checkable: passes — It can be checked against evidence.
- Load-bearing: passes — The paper’s conclusions depend on it.
- Based: passes — The paper gives a reason why it holds.
It may state two separate claims as one.
A conclusion the paper draws from its own results — it cites no other source for it, so there is none to check. The quote shows it is in the paper.
In the paper
“where the choice of whether to act depends on the relative utility of acting as opposed to not acting. For example, if it is especially effortful to act, then people will be biased against acting.”
§ Evolution and impact of bias in human and machine learning algorithm interaction > Iterated algorithmic bias in online learning > Iterated learning with human action bias
plaindirect- Asserted: passes — The authors put it forward as true.
- Checkable: passes — It can be checked against evidence.
- Load-bearing: passes — The paper’s conclusions depend on it.
- Based: fails — The paper may give no reason why it holds.
Probably not a substantial claim. The paper may give no reason why it holds. It may state two separate claims as one.
- The authors state this as an assumption: The choice of whether to act can be formalized using Luce choice, a special case of softmax.
A conclusion the paper draws from its own results — it cites no other source for it, so there is none to check. The quote shows it is in the paper.
In the paper
“This means that the nature of the model, and hence which items will be judged to be relevant to the user, changes depending on the iterated algorithmic bias, with filtering bias exerting the biggest influence.”
- Also stated in: § Conclusion · hedged
“indicating that the nature of the model, and hence which items will be judged to be relevant to the user, changes depending on the iterated algorithmic bias, with filtering bias exerting the biggest influence.”
§ Evolution and impact of bias in human and machine learning algorithm interaction > Results > Experiments on the real-life data set
plaindirect- Asserted: passes — The authors put it forward as true.
- Checkable: passes — It can be checked against evidence.
- Load-bearing: passes — The paper’s conclusions depend on it.
- Based: passes — The paper gives a reason why it holds.
It may state two separate claims as one.
- Also stated in: § Conclusion · hedged
A conclusion the paper draws from its own results — it cites no other source for it, so there is none to check. The quote shows it is in the paper.
In the paper
“Active learning aims to help learn correct boundary, therefore it highly depends on the initial data points.”
§ Evolution and impact of bias in human and machine learning algorithm interaction > Results > Experiments on the real-life data set
boosteddirect- Asserted: passes — The authors put it forward as true.
- Checkable: passes — It can be checked against evidence.
- Load-bearing: passes — The paper’s conclusions depend on it.
- Based: passes — The paper gives a reason why it holds.
Probably not a substantial claim.
- Rests on an assumption: Active learning aims to help learn the correct boundary.
A conclusion the paper draws from its own results — it cites no other source for it, so there is none to check. The quote shows it is in the paper.
In the paper
“Active learning affects points close to the boundary, thus it has limited effects overall.”
§ Evolution and impact of bias in human and machine learning algorithm interaction > Results > Experiments on the real-life data set
plaindirect- Asserted: passes — The authors put it forward as true.
- Checkable: passes — It can be checked against evidence.
- Load-bearing: passes — The paper’s conclusions depend on it.
- Based: passes — The paper gives a reason why it holds.
It may state two separate claims as one.
- Rests on an assumption: Active learning bias already prefers points that are close to the boundary.
A conclusion the paper draws from its own results — it cites no other source for it, so there is none to check. The quote shows it is in the paper.
In the paper
“Therefore, it slightly decreases the inequality.”
§ Evolution and impact of bias in human and machine learning algorithm interaction > Results > Experiments on 2D synthetic data
plaindirect- Asserted: passes — The authors put it forward as true.
- Checkable: passes — It can be checked against evidence.
- Load-bearing: unclear — It is unclear whether the paper’s conclusions depend on it.
- Based: passes — The paper gives a reason why it holds.
The quote only partly states this claim.
- Rests on an assumption: Random selection with class-dependent human action probability prefers points from class y = 1, however randomly.
A conclusion the paper draws from its own results — it cites no other source for it, so there is none to check. The quote shows it is in the paper.
In the paper
“Thus we conclude that human action affects the boundary shift: the more frequent human action is, the more significant is the effect on the boundary shift for only the iterated filter algorithmic bias.”
§ Evolution and impact of bias in human and machine learning algorithm interaction > Results > Experiments on 2D synthetic data
boosteddirect- Asserted: passes — The authors put it forward as true.
- Checkable: passes — It can be checked against evidence.
- Load-bearing: passes — The paper’s conclusions depend on it.
- Based: passes — The paper gives a reason why it holds.
It may state two separate claims as one.
The paper relies on this without support.
People and algorithms are increasingly engaged in interactive processes wherein neither the human nor the algorithms receive unbiased data.
“Furthermore, people and algorithms are increasingly engaged in interactive processes wherein neither the human nor the algorithms receive unbiased data.”
The authors state this as an assumption.
A Bayesian model for prediction is assumed for the algorithm.
“Following Griffiths’ model for human learners, we assume a Bayesian model for prediction.”
The authors state this as an assumption.
People's response is always observed in the above analysis.
“The above analysis assumes that people’s response is always observed.”
The authors state this as an assumption.
People have some target hypothesis h*, which represents optimal performance for the algorithm.
“Assume that people have some target hypothesis, h*, which represents optimal performance for the algorithm.”
The authors state this as an assumption.
A simplified algorithm where only the very uncertain data are selected, and a mixture of random sampling and active learning, is assumed.
“Assuming a simplified algorithm where only the very uncertain data are selected, we can investigate the limiting behavior of an algorithm with the active learning bias. Assuming a mixture of random sampling and active learning, we obtain:”
The authors state this as an assumption.
The choice of whether to act can be formalized using Luce choice, a special case of softmax.
“We can formalize this choice using Luce choice [56], a special case of softmax [137]”
The paper relies on this without support.
The synthetic dataset represents a typical classification problem and is comparable to the real-life dataset after selecting one user and corresponding items.
“The synthetic dataset represents a typical classification problem, it is the same for our real-life dataset after selecting one user and corresponding items.”
The paper relies on this without support.
In the real world, some data can be invisible to some users because of bias either from users or from the algorithm itself.
“In the real world, some data can be invisible to some users because of bias either from users or from the algorithm itself.”
The paper relies on this without support.
Class imbalance can emerge from the algorithm intentionally asking users to rate only the most popular items, a common strategy used to collect initial ratings for new users.
“Class imbalance can also emerge from the algorithm intentionally asking users to rate only the most popular items, a common strategy used to collect initial ratings for new users.”
The authors state this as an assumption.
In RQ2, humans have a prior probability to act that is not dependent on the true label of the item presented.
“In research question 2 (RQ 2), we assumed that humans have a prior probability to act which is not dependent on the true label of the item presented.”
The authors state this as an assumption.
Humans have a higher probability to label or rate when the item presented is from relevant class y = 1.
“we try to simulate this by assuming that humans have a higher probability to label or rate when the item presented is from relevant class y = 1 (see Eq 15).”
The paper relies on this without support.
Filter bias already prefers points from class y = 1.
“since filter bias already prefers points from class y = 1.”
The paper relies on this without support.
Active learning bias already prefers points that are close to the boundary.
“since this bias already prefers points that are close to the boundary.”
The paper relies on this without support.
Both random selection and active learning are used to build an accurate model in machine learning.
“both random selection and active learning are used to build an accurate model in machine learning.”
The paper relies on this without support.
Random selection with class-dependent human action probability prefers points from class y = 1, however randomly.
“Random selection with class-dependent human action probability prefer points from class y = 1, however randomly.”
The paper relies on this without support.
Active learning aims to help learn the correct boundary.
“Active learning aims to help learn correct boundary”
The paper relies on this without support.
Humans and AI algorithms are both increasingly intertwined in feedback loops that end up feeding biased data to both humans and algorithms.
“Humans and AI algorithms are both increasingly intertwined in feedback loops that end up feeding biased data to both humans and algorithms.”
Claims other papers make about this one
Each is checked against this paper’s own text: does it say what the citing paper says it does?
In the citing paper
“but it is possible for algorithmic bias to occur even with unbiased training data if the model’s design or decision-making mechanisms introduce bias [54,55].”
From Ethical Considerations of Using ChatGPT in Health Care (2023) · cites this paper as [54]
Self-check
Percentages, sums and reported differences re-computed from the paper’s own numbers.
Each contradiction between two passages listed here was confirmed by an independent check.
Rated major: it would touch a result — a value a result rests on, reported and recomputed p-values on opposite sides of the significance level, two passages that conflict with no sign which is right, or a cited work retracted before this paper was published.
In the paper
§ Evolution and impact of bias in human and machine learning algorithm interaction > Results > Experiments on the real-life data set
“On the other hand, there is no significant difference with active learning bias and random selection.”
§ Evolution and impact of bias in human and machine learning algorithm interaction > Results > Experiments on the real-life data set
“| Mann-Whitney test p-value | 7.1e- 15 | 0.002 | 0.42 | | t-test p-value | 7.6e- 25 | 0.0004 | 0.84 |”
Rated major: it would touch a result — a value a result rests on, reported and recomputed p-values on opposite sides of the significance level, two passages that conflict with no sign which is right, or a cited work retracted before this paper was published.
In the paper
§ Evolution and impact of bias in human and machine learning algorithm interaction > Results > Experiments on the real-life data set
“Table 16 shows that there is a significant increase in the class-1 blind spot sizes in the testing set for iterated filter bias and active learning bias.”
§ Evolution and impact of bias in human and machine learning algorithm interaction > Results > Experiments on the real-life data set
“Both random selection and active learning do not have a significant impact. | | Filter Bias | Active Learning | Random Selection | | --- | --- | --- | --- | | Mann-Whitney test p-value | 7.0e- 15 | 0.0002 | 0.15 | | t-test p-value | 4.2e- 26 | 0.0001 | 0.46 | | effect size | -1.89 | 0.66 | 0.16 |”
Rated minor: it would not touch a result — a value no result rests on, a p-value that stays on the same side of the significance level, or a conflict that is clerical, resolved elsewhere in the paper, or outside its own findings.
In the paper
§ Evolution and impact of bias in human and machine learning algorithm interaction > Experimental data sets
“User 547 has rated 2312 movies throughout the 10 years.”
§ Evolution and impact of bias in human and machine learning algorithm interaction > Results > Experiments on the real-life data set
“| User ID = 547 | 2391 | 1409 | 982 | FB | (7.6e-25, 1.88) | (4.2e-26, -1.89) | (7.4e-25, -1.83) |”
Rated minor: it would not touch a result — a value no result rests on, a p-value that stays on the same side of the significance level, or a conflict that is clerical, resolved elsewhere in the paper, or outside its own findings.
In the paper
§ Evolution and impact of bias in human and machine learning algorithm interaction > Results > Experiments on 2D synthetic data
“Filter bias has significant effects on the class-1-blind spot, while random selection and active learning do not have a significant effect on the class-1-blind spot size (see Fig 7).”
§ Evolution and impact of bias in human and machine learning algorithm interaction > Results > Experiments on 2D synthetic data
“| Mann-Whitney test p-value | 2.4e-10 | 0.03 | 0.06 | | t-test p-value | 2.2e-10 | 0.03 | 0.06 |”
Rated minor: it would not touch a result — a value no result rests on, a p-value that stays on the same side of the significance level, or a conflict that is clerical, resolved elsewhere in the paper, or outside its own findings.
In the paper
§ Evolution and impact of bias in human and machine learning algorithm interaction > Results > Experiments on 2D synthetic data
“The other bias modes are not affected by different human action probabilities.”
§ Evolution and impact of bias in human and machine learning algorithm interaction > Results > Experiments on 2D synthetic data
“| paction = 1 | Mann-Whitney test p-value | 0.4e- 11 | 0.9e- 5 | 0.486 | | paction = 1 | t-test p-value | 7.1e- 14 | 0.002 | 0.52 |”
Rated minor: it would not touch a result — a value no result rests on, a p-value that stays on the same side of the significance level, or a conflict that is clerical, resolved elsewhere in the paper, or outside its own findings.
In the paper
§ Evolution and impact of bias in human and machine learning algorithm interaction > Results > Experiments on 2D synthetic data
“For AL, the effect size has the opposite sign (positive) implying a significant decrease in hidden items (both relevant and non-relevant) based on the Mann-Whitney U test.”
§ Evolution and impact of bias in human and machine learning algorithm interaction > Results > Experiments on 2D synthetic data
“| Mann-Whitney test p-value | 5.9e-12 | 0.5 | 0.47 | | t-test p-value | 1.4e-19 | 0.18 | 0.13 | | effect size | -1.44 | -0.3 | -0.29 |”
Rated minor: it would not touch a result — a value no result rests on, a p-value that stays on the same side of the significance level, or a conflict that is clerical, resolved elsewhere in the paper, or outside its own findings.
In the paper
§ Evolution and impact of bias in human and machine learning algorithm interaction > Results > Experiments on 2D synthetic data
“The negative effect size for filter bias shows that it decreases the number of points which are predicted to be in class y = 1.”
§ Evolution and impact of bias in human and machine learning algorithm interaction > Results > Experiments on 2D synthetic data
“| effect size | 1.6 | -0.2 | -1.1 |”
Citations
Cites
Statistical Power Analysis for the Behavioral Sciences
Muller, K. E., & Cohen, J. (1989) · Technometrics · doi:10.2307/1270020 · Cited by 99,603
Statistical power analysis for the behavioral sciences
Cohen, J. (1990) · Computers Environment and Urban Systems · doi:10.1016/0198-9715(90)90050-4 · Cited by 65,417
Cortes, C., & Vapnik, V. (1995) · Machine Learning · doi:10.1007/bf00994018 · Cited by 59,421
(1990) · Choice Reviews Online · doi:10.5860/choice.27-3338 · Cited by 35,305
Cortes, C., & Vapnik, V. N. (1995) · Machine Learning · doi:10.1023/a:1022627411411 · Cited by 34,565
Reinforcement Learning: An Introduction
Sutton, R. S., & Barto, A. G. (1998) · IEEE Transactions on Neural Networks · doi:10.1109/tnn.1998.712192 · Cited by 27,225
Reinforcement Learning: An Introduction
Sutton, R. S., & Barto, A. (2005) · IEEE Transactions on Neural Networks · doi:10.1109/tnn.2004.842673 · Cited by 25,268
An analysis of variance test for normality (complete samples)
SHAPIRO, S. S., & WILK, M. B. (1965) · Biometrika · doi:10.1093/biomet/52.3-4.591 · Cited by 23,480
Nearest neighbor pattern classification
Cover, T., & Hart, P. (1967) · IEEE Transactions on Information Theory · doi:10.1109/tit.1967.1053964 · Cited by 16,936 · cited 1×
“K-nearest neighbors [31, 32] and non-negative matrix factorization (NMF) [33–37], that have close analogs in the psychology literatures on concept learning, e.”
BackgroundAdvances in Neural Information Processing Systems 19
(2007) · The MIT Press eBooks · doi:10.52202/085713 · Cited by 16,043
Research works printed but not linked: 11
- Spark KJ. Artificial Intelligence: What can it offer to Information Retrieval. Proceedings of the Informatics 3, Aslib, ed, London. 1978;.
- McFadden DL. Quantal choice analaysis: A survey. In: Annals of Economic and Social Measurement, Volume 5, number 4. NBER; 1976. p. 363–390.
- TL Griffiths, 2005, Proceedings of the Cognitive Science Society
- Smith K. Iterated learning in populations of Bayesian agents. In: Proceedings of the 31st annual conference of the cognitive science society. Citeseer; 2009. p. 697–702.
- KJ Rothman, 2008, Modern epidemiology
- Dwork C, Immorlica N, Kalai AT, Leiserson MD. Decoupled classifiers for group-fair and efficient machine learning. In: Conference on Fairness, Accountability and Transparency; 2018. p. 119–133.
- Barocas S. Data mining and the discourse on discrimination. In: Data Ethics Workshop, Conference on Knowledge Discovery and Data Mining; 2014.
- Schnabel T, Swaminathan A, Singh A, Chandak N, Joachims T. Recommendations as treatments: Debiasing learning and evaluation. arXiv preprint arXiv:160205352. 2016;.
- A Sinha, 2016, Advances in neural information processing systems, 3243
- S Milano, 2020, AI & SOCIETY, 1
- A Stuart, 1994, Distribution theory
Cited by
Sorted by citations
Beyond the Imitation Game: Quantifying and extrapolating the capabilities of language models
Srivastava, A., Rastogi, A., Rao, A., Shoeb, A. A. M., Abid, A., Fisch, A., Brown, A. R., Santoro, A., Gupta, A., Garriga-Alonso, A., et al. (2022) · arXiv · doi:10.48550/arxiv.2206.04615 · Cited by 569
Ethical Considerations of Using ChatGPT in Health Care
Wang, C., Liu, S., Yang, H., Guo, J., Wu, Y., & Liu, J. (2023) · Journal of Medical Internet Research · doi:10.2196/48009 · Cited by 541
“Data bias can directly contribute to algorithmic bias [53], but it is possible for algorithmic bias to occur even with unbiased training data if the model’s design or decision-making mechanisms introduce bias [54,55].”
Algorithmic bias in data-driven innovation in the age of AI
Akter, S., McCarthy, G., Sajib, S., Michael, K., Dwivedi, Y. K., D’Ambra, J., & Shen, K. N. (2021) · International Journal of Information Management · doi:10.1016/j.ijinfomgt.2021.102387 · Cited by 440
Pagano, T. P., Loureiro, R. B., Lisboa, F. V. N., Peixoto, R. M., Guimarães, G. A. D. S., Cruz, G. O. R., Araujo, M. M., dos Santos, L. L., Cruz, M. A. S., Oliveira, E. L. S., et al. (2023) · Big Data and Cognitive Computing · doi:10.3390/bdcc7010015 · Cited by 421
“The first occurs when the goal is to provide relevant information or preferences [52].”
BackgroundA framework for AI-powered service innovation capability: Review and agenda for future research
Akter, S., Hossain, M. A., Sajib, S., Sultana, S., Rahman, M., Vrontis, D., & McCarthy, G. (2023) · Technovation · doi:10.1016/j.technovation.2023.102768 · Cited by 336
Algorithmic bias in machine learning-based marketing models
Akter, S., Dwivedi, Y. K., Sajib, S., Biswas, K., Bandara, R. J., & Michael, K. (2022) · Journal of Business Research · doi:10.1016/j.jbusres.2022.01.083 · Cited by 242
A Comprehensive Review of AI Techniques for Addressing Algorithmic Bias in Job Hiring
Albaroudi, E., Mansouri, T., & Alameer, A. (2024) · AI · doi:10.3390/ai5010019 · Cited by 191
Designing Futuristic Telemedicine Using Artificial Intelligence and Robotics in the COVID-19 Era
Bhaskar, S., Bradley, S., Sakhamuri, S., Moguilner, S., Chattu, V. K., Pandya, S., Schroeder, S., Ray, D., & Banach, M. (2020) · Frontiers in Public Health · doi:10.3389/fpubh.2020.556789 · Cited by 137
Artificial intelligence for diagnostic and prognostic neuroimaging in dementia: a systematic review
Borchert, R. J., Azevedo, T., Badhwar, A., Bernal, J., Betts, M., Bruffaerts, R., Burkhart, M. C., Dewachter, I., Gellersen, H. M., Low, A., et al. (2023) · Alzheimer's & Dementia · doi:10.1002/alz.13412 · Cited by 125
“167 Concernshavebeenraisedmoregenerallyaboutbias in ML models, 168 including in the context of health applications.”
BackgroundAdvancing algorithmic bias management capabilities in AI-driven marketing analytics research
Akter, S., Sultana, S., Mariani, M. M., Wamba, S. F., Spanaki, K., & Dwivedi, Y. K. (2023) · Industrial Marketing Management · doi:10.1016/j.indmarman.2023.08.013 · Cited by 127
Predicting the future of neuroimaging predictive models in mental health
Tejavibulya, L., Rolison, M. J., Gao, S., Liang, Q., Peterson, H., Dadashkarimi, J., Farruggia, M. C., Hahn, C. A., Noble, S., Lichenstein, S. D., et al. (2022) · Molecular Psychiatry · doi:10.1038/s41380-022-01635-2 · Cited by 58
“For these reasons, some argue that bias in machine learning is solely rooted in biased data and that algorithms are not biased [22].”
BackgroundInterpretability of Machine Learning Solutions in Public Healthcare: The CRISP-ML Approach
Kolyshkina, I., & Simoff, S. (2021) · Frontiers in Big Data · doi:10.3389/fdata.2021.660206 · Cited by 60
“In healthcare, such pressure is amplified by the nature of the interactive processes, wherein neither humans nor the algorithms operate with unbiased data (Sun et al., 2020).”
BackgroundQuantifying Meibomian Gland Morphology Using Artificial Intelligence
Wang, J., Shixuan, L., Yeh, T. N., et al. (2021) · Optometry and Vision Science · doi:10.1097/opx.0000000000001767 · Cited by 51
Detection and Evaluation of Machine Learning Bias
Alelyani, S. (2021) · Applied Sciences · doi:10.3390/app11146271 · Cited by 53
“[18] argues that the bias is introduced from humans who are responsible of labeling training data.”
BackgroundEvangelista, K., Silva, B. S. D. F., Yamamoto‐Silva, F. P., Valladares‐Neto, J., Silva, M. A. G., Cevidanes, L., Canto, G. D. L., & Massignan, C. (2022) · Clinical Oral Investigations · doi:10.1007/s00784-022-04742-0 · Cited by 41
“Human training expertise for artificial intelligence training is a crucial contribution for the final model [29].”
BackgroundAI ethical biases: normative and information systems development conceptual framework
Chowdhury, T., & Oredo, J. O. (2022) · Journal of Decision System · doi:10.1080/12460125.2022.2062849 · Cited by 38
“(Davenport et al., 2020; Fahse et al., 2021; Sun et al., 2020; Suresh & Guttag, 2021) Training dataset may not be adequate or may not be randomly sampled from the target population leading to sample inadequacy or sample selection bias.”
BackgroundCan AI See Bias in X-ray Images?
Alicja, K., & Maciej, S. (2022) · International Journal of Network Dynamics and Intelligence · doi:10.53941/ijndi0101005 · Cited by 34
Vaccine development using artificial intelligence and machine learning: A review
Asediya, V., Anjaria, P. A., Mathakiya, R. A., KORINGA, P. G., Nayak, J. B., Bisht, D., Fulmali, D., Patel, V. A., & Desai, D. N. (2024) · International Journal of Biological Macromolecules · doi:10.1016/j.ijbiomac.2024.136643 · Cited by 35
Clinical impact of artificial intelligence-based solutions on imaging of the pancreas and liver
Berbis, M. A., Paulano‐Godino, F., del Val, J. R., Mata, L. A., & Luna, A. (2023) · World Journal of Gastroenterology · doi:10.3748/wjg.v29.i9.1427 · Cited by 31
Oduoye, M. O., Javed, B., Gupta, N., & Sih, C. M. V. (2023) · International Journal of Surgery · doi:10.1097/js9.0000000000000552 · Cited by 25
“A basic example of one ethical principle is to treat everyone with respect [19,20] .”
BackgroundEpstein, R., Lee, V., Mohr, R., & Zankich, V. R. (2022) · PLoS ONE · doi:10.1371/journal.pone.0268081 · Cited by 19
Artificial Intelligence for Quality Education: Successes and Challenges for AI in Meeting SDG4
Kabudi, T. (2022) · IFIP advances in information and communication technology · doi:10.1007/978-3-031-19429-0_21 · Cited by 25
Leong, K., & Sung, A. (2024) · Humanities and Social Sciences Communications · doi:10.1057/s41599-024-03660-8 · Cited by 27
“As per Sun et al. (2020), bias in the dataset can lead to an increase in inequality in a model ’ s predictions.”
Nimmy, S. F., Hussain, F. K., Chakrabortty, R. K., Hussain, F. K., & Saberi, M. (2023) · Knowledge-Based Systems · doi:10.1016/j.knosys.2023.110552 · Cited by 20
von Groote, T., Ghoreishi, N., Björklund, M., Porschen, C., & Puljak, L. (2022) · Systematic Reviews · doi:10.1186/s13643-022-01984-7 · Cited by 17
Cybersecurity and privacy in smart bioprinting
Isichei, J., Khorsandroo, S., & Desai, S. S. (2023) · Bioprinting · doi:10.1016/j.bprint.2023.e00321 · Cited by 17
Zhou, Z., Huang, C., Fu, P., Huang, H., Zhang, Q., Wu, X., Yu, Q. Z., & Sun, Y. (2022) · CNS Neuroscience & Therapeutics · doi:10.1111/cns.13993 · Cited by 16
“37,38 To overcome the issue, patients with normokalemia were resampled in a 1:1 ratio using a propensity score matching approach to balance the gender and age of patients with moderate- to-severe hypokalemia (serum potassium below 3.0 mmol/L).”
MethodInfluentialBorchert, R. J., Azevedo, T., Badhwar, A., Bernal, J., Betts, M. R., Bruffaerts, R., Burkhart, M. C., Dewachter, I., Gellersen, H. M., Low, A., et al. (2021) · medRxiv · doi:10.1101/2021.12.12.21267677 · Cited by 17
Can Artificial Intelligence Assist in Delivering Continuous Renal Replacement Therapy?
Hammouda, N., & Neyra, J. A. (2022) · Advances in Chronic Kidney Disease · doi:10.1053/j.ackd.2022.08.001 · Cited by 17
Bricout, J. C., Greer, J., Fields, N. L., Xu, L., Tamplain, P. M., Doelling, K., & Sharma, B. B. (2021) · Assistive Technology · doi:10.1080/10400435.2021.1930282 · Cited by 16
“…exchanges between human and machine that bias the machine’s algorithms and skew its performance may be a result of how people selectively label information (through a personal lens, randomly or through active learning), and the algorithm’s own process of information selection (Sun et al., 2020).”
BackgroundAS DUALIDADES ENTRE O USO DA INTELIGÊNCIA ARTIFICIAL NA EDUCAÇÃO E OS RISCOS DE VIESES ALGORÍTMICOS
Heggler, J. M., Szmoski, R. M., & Miquelin, A. F. (2025) · Educação & Sociedade · doi:10.1590/es.289323 · Cited by 16
Bagge-Petersen, C. M., Langstrup, H., Larsen, J. E., & Frølich, A. (2022) · Digital Health · doi:10.1177/20552076221109531 · Cited by 13
“Theoretically speaking, and voiced by other scholars as bias in machine learning (see for instance Sun et al. 57 ), the machine learning algorithm would provide insights into ‘ adult patient condition patterns ’ because this is what it would continuously detect.”
BackgroundBesculides, M., Mazumdar, M., Phlegar, S., Freeman, R., Wilson, S., Joshi, H., Kia, A., & Gorbenko, K. (2023) · JMIR Formative Research · doi:10.2196/42262 · Cited by 12
Lee, J., Yang, S., Holland-Hall, C. M., Sezgın, E., Gill, M., Linwood, S. L., Huang, Y., & Hoffman, J. (2022) · JMIR Medical Informatics · doi:10.2196/38482 · Cited by 10
Rashidi, H. H., Pepper, J., Howard, T., Klein, K., May, L. S., Albahra, S., Phinney, B. S., Salemi, M., & Tran, N. K. (2022) · PLoS ONE · doi:10.1371/journal.pone.0263954 · Cited by 12
Augmenting machine learning with human insights: the model development for B2B personalization
Yaghtin, S., & Mero, J. (2023) · Journal of Business and Industrial Marketing · doi:10.1108/jbim-02-2023-0073 · Cited by 10
CREDO: a friendly Customizable, REproducible, DOcker file generator for bioinformatics applications
Alessandri, S., Ratto, M. L., Rabellino, S., et al. (2024) · BMC Bioinformatics · doi:10.1186/s12859-024-05695-9 · Cited by 8
“In addition, the choice of methods and algorithms can also have a significant impact on the results, leading to different outcomes for the same data [4].”
BackgroundBiases in machine-learning models of human single-cell data
Willem, T., Shitov, V. A., Luecken, M. D., Kilbertus, N., Bauer, S., Piraud, M., Buyx, A., & Theis, F. J. (2025) · Nature Cell Biology · doi:10.1038/s41556-025-01619-8 · Cited by 12
Raclin, T., Price, A. I., Stave, C. D., Lee, E., Reddy, B., Kim, J., & Chu, L. F. (2022) · JMIR Research Protocols · doi:10.2196/36395 · Cited by 8
Advanced Image Analysis Methods for Automated Segmentation of Subnuclear Chromatin Domains
Berens, P. J. T., Schivre, G., Theune, M. L., et al. (2022) · Epigenomes · doi:10.3390/epigenomes6040034 · Cited by 7
“The “programmer”-based bias starts to be investigated as a potential explanation for dataset-specific performance [45,56].”
BackgroundFair XIDS: Ensuring fairness and transparency in intrusion detection models
Chinu, & Bansal, U. (2024) · Concurrency and Computation Practice and Experience · doi:10.1002/cpe.8268 · Cited by 7
Impact of analytical bias on machine learning models for sepsis prediction using laboratory data
Yeşil, M. R., Talli, I., Pelloso, M., Cosma, C., Pangrazzi, E., Plebani, M., Üstündağ, Y., & Padoan, A. (2025) · Clinical Chemistry and Laboratory Medicine (CCLM) · doi:10.1515/cclm-2025-0491 · Cited by 8
Zorina, V. A., & Андреевна, О. Е. (2021) · Theoretical and Practical Issues of Journalism · doi:10.17150/2308-6203.2021.10(4).734-744 · Cited by 8
Artificial Intelligence in Healthcare
Aggarwal, N., Matheny, M. E., Shachar, C., Wang, S. X. Y., & Israni, S. T. (2022) · Oxford University Press eBooks · doi:10.1093/oxfordhb/9780197579329.013.50 · Cited by 6
Sengupta, K., & Srivast, P. R. (2023) · Research Square · doi:10.21203/rs.3.rs-2509731/v1 · Cited by 8
Alves, B., Alhussein, G., Riggare, S. S., Duncan, T. S., Saada, A., Lyreskog, D. M., Chatzichristos, C., Gerasimou, I., Hadjidimitriou, S., Hadjileontiadis, L. J., et al. (2025) · Journal of Medical Internet Research · doi:10.2196/73710 · Cited by 6
“Data bias, originating from unrepresentative datasets, can lead to skewed model predictions [44].”
Adoption Factors of Artificial intelligence in Human Resource Management
Tuffaha, M. (2022) · RiuNet (Universitat Politècnica de València) · doi:10.4995/thesis/10251/185909 · Cited by 11
Bautista, C. J. C., Gallegos, R. K. B., & Lampayan, R. M. (2025) · Digital Twin · doi:10.1080/27525783.2025.2562418 · Cited by 5
Diversity and Internationalisation: A New Core Competence for Research Managers?
Christensen, J. F., & Smith, L. (2023) · Emerald Group Publishing Limited eBooks · doi:10.1108/978-1-80382-701-820231033 · Cited by 5
Professional planners’ preparedness for digital transformation: an empirical analysis of PlanTech
Boland, P., McHenry, J., Potts, R., et al. (2024) · Town Planning Review · doi:10.3828/tpr.2024.48 · Cited by 5
“Others argue algorithms, AI/ ML, and other forms of human programmed software and hardware retain the conscious and unconscious biases of those who design them (Sun et al., 2020; Turner Lee, 2018).”
Balancing autonomy and expertise in autonomous synthesis laboratories
Liu, X., Ouyang, B., & Zeng, Y. (2025) · Nature Computational Science · doi:10.1038/s43588-025-00769-x · Cited by 5
Great debate: artificial intelligence will replace much of what cardiologists do
Averbuch, T., Asselbergs, F. W., Vardas, P. E., & Spall, H. G. C. V. (2025) · European Heart Journal · doi:10.1093/eurheartj/ehaf305 · Cited by 5
Dirksen, A., Gießler, S., Erz, H., Johns, M., & Fiebig, T. (2024) · New Security Paradigms Workshop · doi:10.1145/3703465.3703475 · Cited by 7
“This ranges from directly related work, e.g., usability focused studies [26, 45], or studies in which social effects are studied [13, 78, 82], to work like censorship measurements [28, 36, 69] or mathematics [29].”
Let’s Unleash the Network Judgment: A Self-Supervised Approach for Cloud Image Analysis
Demattíes, D., Raut, B., Park, S., Jackson, R. C., Shahkarami, S., Kim, Y., Sankaran, R., Beckman, P., Collis, S., & Ferrier, N. (2023) · Artificial Intelligence for the Earth Systems · doi:10.1175/aies-d-22-0063.1 · Cited by 5
“We note that supervised learning could bias the algorithms, limiting the capacity of the networks to learn more subtle features hidden in the nuances of input data (Cabrera et al. 2014; Sun et al. 2020; Karimi et al. 2020).”
BackgroundMunnisunker, S. (2022) · GiLE Journal of Skills Development · doi:10.52398/gjsd.2022.v2.i2.pp27-35 · Cited by 4
“Bias is defined as a tendency (known or unknown) to have a preference for one thing over another, which lacks objectivity and influences an outcome (Sun et al., 2020).”
BackgroundRashidi, H. H., Pepper, J., Howard, T., et al. (2022) · medRxiv · doi:10.1101/2022.02.02.22270298 · Cited by 4
Braga, J., Regateiro, F. S., Stiubiener, I., & Braga, J. C. (2023) · OSF Preprints (OSF Preprints) · doi:10.31219/osf.io/wexjr · Cited by 5
Gender Fairness of Machine Learning Algorithms for Pain Detection
Green, D., Shang, Y., Cheong, J., Liu, Y. M., & Güneş, H. (2025) · International Conference on Automatic Face and Gesture Recognition · doi:10.1109/fg61629.2025.11099137 · Cited by 3
“Bias in ML systems can originate from dataset bias in the input data, or from algorithmic bias in the models themselves [57], [74], [4].”
Yoon, S. S., Ee, J. J., & Son, M. (2025) · Journal of Digital Learning in Teacher Education · doi:10.1080/21532974.2025.2548242 · Cited by 4
“Building on these concerns, scholars across disciplines are increasingly highlighting biases in Generative AI, particularly in large language models (LLMs) trained and evaluated by humans (Sun et al., 2020).”
Lee, K., Cho, W., Woo, H., & de Jong, S. B. (2025) · Journal of Management Studies · doi:10.1111/joms.70009 · Cited by 5
AI without borders: The rise of cross-disciplinary machine learning
Wibawa, A. P., Herdianto, R., Handayani, A. N., Utama, A. B. P., Aripriharta, Dwiyanto, F. A., & Dreżewski, R. (2026) · Telematics and Informatics Reports · doi:10.1016/j.teler.2026.100294 · Cited by 4
Yu, Z., & Qi, J. (2026) · Discover Food · doi:10.1007/s44187-026-00829-9 · Cited by 5
“This recursive process generates new biased code and scripts through what might be termed a “ratchet effect” - progressively inten-sifying machine-learned prejudices through iterative feedback loops [86].”
Heuristics and Biases in AI Decision-Making: Implications for Responsible AGI
Saeedi, P., Goodarzi, M., & Canbaz, M. A. (2025) · International Conference on Artificial Intelligence, Robotics and Control (AIRC) · doi:10.1109/airc64931.2025.11077505 · Cited by 4
“Keywords were extracted from prominent literature [4], [27], [31], [37], [39], [44] to determine whether the models recognized or referenced the biases in their reasoning.”
The Challenge of AI Governance for Public Organizations
Bullock, J. B., Huang, H., Kim, K.-C., & Young, M. (2022) · Oxford University Press eBooks · doi:10.1093/oxfordhb/9780197579329.013.26 · Cited by 3
Ardison, A. C. I., Hutagalung, M. J. R., Chernando, R., & Cenggoro, T. W. (2022) · CommIT (Communication and Information Technology) Journal · doi:10.21512/commit.v16i2.8144 · Cited by 5
Distance profile layer for binary classification and density estimation
Komorniczak, J., & Ksieniewicz, P. (2024) · Neurocomputing · doi:10.1016/j.neucom.2024.127436 · Cited by 3
Fernandes, J. A., Borja, Á., Anabitarte, A., Granado, I., Lekunberri, X., Sagarmínaga, Y., Canals, O., Lanzén, A., Azhar, M., Kotta, J., et al. (2026) · Fish and Fisheries · doi:10.1111/faf.70052 · Cited by 4
Zhao, Q., Hu, X. Y., Hu, N., Xu, C., & Yu, Z. (2025) · Digital Health · doi:10.1177/20552076251396984 · Cited by 3
“14 Sun et al.(2020) expressed skepticism regarding the accuracy and reliability of AI technology, noting that unchecked input data in AI algorithms might introduce bias, potentially resulting in skewed diagnostic and treatment decisions.”
Lubell, N., & Al-Khateeb, K. (2023) · doi:10.1093/oso/9780197668610.003.0011 · Cited by 2
Tommarello, N. D., & Deek, R. A. (2024) · Computer · doi:10.1109/mc.2023.3321188 · Cited by 2
Valle, V. C. L. L., Ruiz, M. G. F., & Silva, G. G. D. O. (2024) · RDAI | Revista de Direito Administrativo e Infraestrutura · doi:10.48143/rdai.29.valle · Cited by 2
Essunfeld, A., Comellas, J. M., Morris, R. A., Gasda, P. J., Delapp, D., Oyen, D., Bedford, C. C., Clark, B. C., Dehouck, E., Anderson, R. B., et al. (2025) · Icarus · doi:10.1016/j.icarus.2024.116451 · Cited by 2
Perception of Visual Content: Differences Between Humans and Foundation Models
Pratama, N., Fan, S., & Demartini, G. (2025) · Proceedings of the International AAAI Conference on Web and Social Media · doi:10.1609/icwsm.v19i1.35891 · Cited by 2
A Self-Supervised Learning Pipeline for Demographically Fair Facial Attribute Classification
Ramachandran, S., & Rattani, A. (2024) · IEEE International Joint Conference on Biometrics (IJCB) · doi:10.1109/ijcb62174.2024.10744477 · Cited by 4
“Further, there is a potential perpetuation of human biases from the data labeling process [42].”
BackgroundPuente, C., Sanchez-Perez, I., Kolomiyets-Ludwig, E., Palacios-Castrillo, C., Wang, P. S. P., & Palacios, R. (2025) · International Journal of Pattern Recognition and Artificial Intelligence · doi:10.1142/s021800142551005x · Cited by 1
Navigating Cognitive Landscapes: Harnessing Confirmation Bias in Design Applications
Anaokar, C. A., & Atalatti, S. (2025) · doi:10.1109/iccct63501.2025.11020159 · Cited by 1
AI and Human Resources: Ethical Concerns and Potential Spots of Biases
Jalan, S., & Jena, L. K. (2025) · Emerald Group Publishing Limited eBooks · doi:10.1108/978-1-83662-982-520251003 · Cited by 3
Awode, A. E., Adewumi, J. R., Obiora-Okeke, O. A., et al. (2025) · Water Practice & Technology · doi:10.2166/wpt.2025.134 · Cited by 1
Berns-Conner, M., Dieker, L., & Roberts, S. K. (2026) · Frontiers in Education · doi:10.3389/feduc.2026.1790777 · Cited by 1
Negotiating Consensus for Diverging Evidence
Andersen, F., Herikstad, Y., Sütterlin, S., & Dechsling, A. (2023) · Routledge eBooks · doi:10.4324/9781003273509-10 · Cited by 1
Role of Artificial Intelligence in Telemedicine
Patel, P. S. (2023) · International Journal for Research in Applied Science and Engineering Technology · doi:10.22214/ijraset.2023.55211 · Cited by 2
A call to develop opioid risk assessment programs for implementation in the pharmacy setting
Hodges, A., Skarphol, A., & Strand, M. A. (2023) · Journal of the American Pharmacists Association · doi:10.1016/j.japh.2023.10.018 · Cited by 1
Cluster Analysis reveals Socioeconomic Disparities among Elective Spine Surgery Patients
Orlenko, A., Freda, P. J., Ghosh, A., Choi, H., Matsumoto, N., Bright, T. J., Walker, C. T., Obafemi-Ajayi, T., & Moore, J. H. (2023) · Pacific Symposium on Biocomputing (PSB) · doi:10.1142/9789811286421_0028 · Cited by 1
“13,29,30 To combat this, we employ a robust automated multiple clustering approach to scrutinize our dataset for potential bias factors, prior to developing an ML model.”
MethodPrajapati, A. K., Singh, U. K., Singh, R., et al. (2024) · International Journal of Engineering & Technology · doi:10.14419/hn1n3h15 · Cited by 1
Unite or divide? Biased search queries and Google Search results in polarized politics
Tong, C. (2025) · ACM Web Science Conference (WebSci) · doi:10.1145/3717867.3717888 · Cited by 1
“In addition, potential algorithmic biases can interact with user input in an iterative manner, which further affects algorithms’ performance and subsequent output [34].”
A proposal to improve research in AI algorithm and data governancePreprint
Braga, J., Regateiro, F. S., Stiubiener, I., & Braga, J. C. (2022) · OSF Preprints (OSF Preprints) · doi:10.31219/osf.io/sr7kt · Cited by 1
A Sociotechnical View of Algorithmic Fairness
Dolata, M., Feuerriegel, S., & Schwabe, G. (2021) · Zurich Open Repository and Archive (University of Zurich) · doi:10.48550/arxiv.2110.09253 · Cited by 1
Raclin, T., Price, A. I., Stave, C. D., et al. (2022) · doi:10.2196/preprints.36395
Can the United States' Google Search Algorithm be Reflective of Implicit Racial Bias?
Aleandre, M., & Reyes, M. D. L. (2022) · Journal of Student Research · doi:10.47611/jsrhs.v10i4.2182
“These algorithms, specifically machine learning algorithms, are contingent on the programmer or creator for reliable labels to build efficacious predictions (Sun et al., 2020).”
BackgroundOCEANUI: INTERFACE PARA GERAÇÃO DE EXPLICAÇÕES CONTRAFACTUAIS
PEREIRA, M. H. (2022) · doi:10.17771/pucrio.acad.60289
Besculides, M., Mazumdar, M., Phlegar, S. E., et al. (2022) · doi:10.2196/preprints.42262
Uma proposta para impulsionar as pesquisas em governança de algoritmos de IA e dadosPreprint
Braga, J., Regateiro, F. S., Stiubiener, I., & Braga, J. C. (2022) · OSF Preprints (OSF Preprints) · doi:10.31219/osf.io/xcpsd
(2023) · Emerald Group Publishing Limited eBooks · doi:10.1108/978-1-80382-701-820231083
Алгоритамска пристрасност: Рефлексија постојеће друштене пристрасности и изазови
Стојановић, Љ., & Савић, С. (2024) · ZBORNIK RADOVA UNIVERZITETA SINERGIJA · doi:10.7251/zrsng2324048s
Peoples, C. E., Knudsen, P., & Fuentes, M. (2024) · Socius Sociological Research for a Dynamic World · doi:10.1177/23780231241259659 · Cited by 1
“These biases have proven difficult to remove (Chakraborty et al. 2021; Sun, Nasraoui, and Shafto 2020), leading to poor and unfair decision-making across multiple industries with particularly negative impacts on gender and racial minorities.”
Akash, A., Akash, Bajaj, P. K., et al. (2024) · AIP conference proceedings · doi:10.1063/5.0228212
Ethical Geospatial Analytics Balancing Business Interests and Social Responsibility
Joseph, S., Hasan, M. R., Ahmad, M., et al. (2024) · Advances in marketing, customer relationship management, and e-services book series · doi:10.4018/979-8-3693-3478-2.ch010
Alves, B., Alhussein, G., Riggare, S. S., et al. (2025) · doi:10.2196/preprints.73710
Žitko, B., Gašpar, A., Bročić, L., Vasić, D., & Grubišić, A. (2025) · Language Resources and Evaluation · doi:10.1007/s10579-025-09835-2
“Humans often struggle with sustained attention on repetitive and time-consuming annotation tasks, while machine learning algorithms depend on accurate labels from experts to generate predictions (Sun et al., 2020).”
Kerber, U., & Wittau, F. (2025) · Politische Bildungen · doi:10.1007/978-3-658-45949-9_10
Metadata
- Authors
- Sun, W., Nasraoui, O., & Shafto, P.
- Affiliations
- University of Louisville (US)
- Rutgers, The State University of New Jersey (US)
- Corresponding author
- Nasraoui, Olfa
- Venue
- PLOS ONE
- Publisher
- Public Library of Science (PLoS)
- Published
- 2020-08-13
- Volume
- 15
- Issue
- 8
- Pages
- e0235502
- ISSN
- 1932-6203 (ISSN-L)
- PMC
- PMC7425868
- OpenAlex
- W3048367007
- Semantic Scholar
- fba50a0f6e7f1bb47e80ffa8c523396aa747a6ae
- Cited by
- 116
- References
- 173
- Citations by year
- 2026: 15 · 2025: 29 · 2024: 16 · 2023: 21 · 2022: 26 · 2021: 8 · 2020: 1
- FWCI
- 19.26
- Type
- journal article
- Language
- en
- Open access
- gold
- doi.org
- Licence
- Locations
- PLoS ONE (publishedVersion, cc-by)
- PubMed Central (publishedVersion, cc-by)
- PubMed (publishedVersion)
- RePEc: Research Papers in Economics (submittedVersion)
- DOAJ (DOAJ: Directory of Open Access Journals) (submittedVersion, cc-by-sa)
- Funders
- Division of Information and Intelligent Systems (1549981)
- Topics
- Physical Sciences › Computer Science › Artificial Intelligence › Ethics and Social Impacts of AI
- Physical Sciences › Computer Science › Artificial Intelligence › Machine Learning and Algorithms
- Physical Sciences › Computer Science › Artificial Intelligence › Hate Speech and Cyberbullying Detection
- Keywords
- algorithmic bias, human-machine interaction, iterated learning, filter bubbles, personalization, active learning (machine learning), class imbalance, personalized interfaces, information filtering, relevance prediction
- MeSH terms
- Machine Learning, Humans, Learning, Bias
About these checks
Registry, retraction, Cites and statistics results are computed, not judged, with one exception: a printed reference that no index lists is read once by a model before it counts as a citation error. Claims are extracted by a model and kept only when their quote appears verbatim in the text; each cited source is then checked, with a model’s help, for whether it says what the claim relies on. Those verdicts can be wrong — read the claim’s quote and the cited source before relying on one.
A language model drew the claims from the paper on 2026-10-07, under version 3 of the claim definition (model deepseek-v4.1-flash, prompt extract-v3).
A second model labelled each claim on 2026-10-07 (model jev-1.13-20260917, definition revision gold-guideline-v0.2).
Statistics and arithmetic are recomputed, not judged.
Confidence bands are shown only for fields calibrated on our annotated test set. None is calibrated yet, so no band is shown.
What counts as a claim ›How we measure confidence ›How we check this ›
Are you an author, or do you see a problem with this page? Request a review
