

The DOI matches its Crossref record; 27 of the 27 references it cites were found in a registry or an index.
Lactate-induced histone lactylation by p300 promotes osteoblast differentiation
Open accessAbstract
Lactate, which is synthesized as an end product by lactate dehydrogenase A (LDHA) from pyruvate during anaerobic glycolysis, has attracted attention for its energy metabolism and oxidant effects. A novel histone modification-mediated gene regulation mechanism termed lactylation by lactate was recently discovered. The present study examined the involvement of histone lactylation in undifferentiated cells that underwent differentiation into osteoblasts. C2C12 cells cultured in medium with a high glucose content (4500 mg/L) showed increases in marker genes (Runx2, Sp7, Tnap) indicating BMP-2-induced osteoblast differentiation and ALP staining activity, as well as histone lactylation as compared to those cultured in medium with a low glucose content (900 mg/L). Furthermore, C2C12 cells stimulated with the LDH inhibitor oxamate had reduced levels of BMP-2-induced osteoblast differentiation and histone lactylation, while addition of lactate to C2C12 cells cultured in low glucose medium resulted in partial restoration of osteoblast differentiation and histone lactylation. These results indicate that lactate synthesized by LDHA during glucose metabolism is important for osteoblast differentiation of C2C12 cells induced by BMP-2. Additionally, silencing of p300, a possible modifier of histone lactylation, also inhibited osteoblast differentiation and reduced histone lactylation. Together, these findings suggest a role of histone lactylation in promotion of undifferentiated cells to undergo differentiation into osteoblasts.
Overview
The claims and statistics of this paper haven’t been checked yet.
Run the check — free, no account needed. It reads the open-access text and checks the sources it cites.
Integrity signals
Registry
Cites
Statistics
Figures
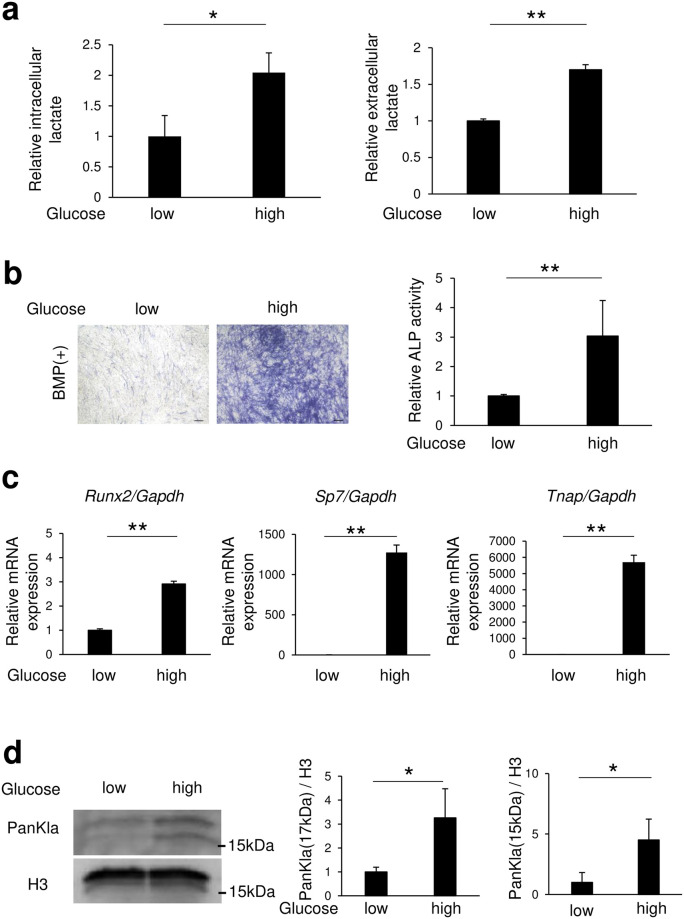
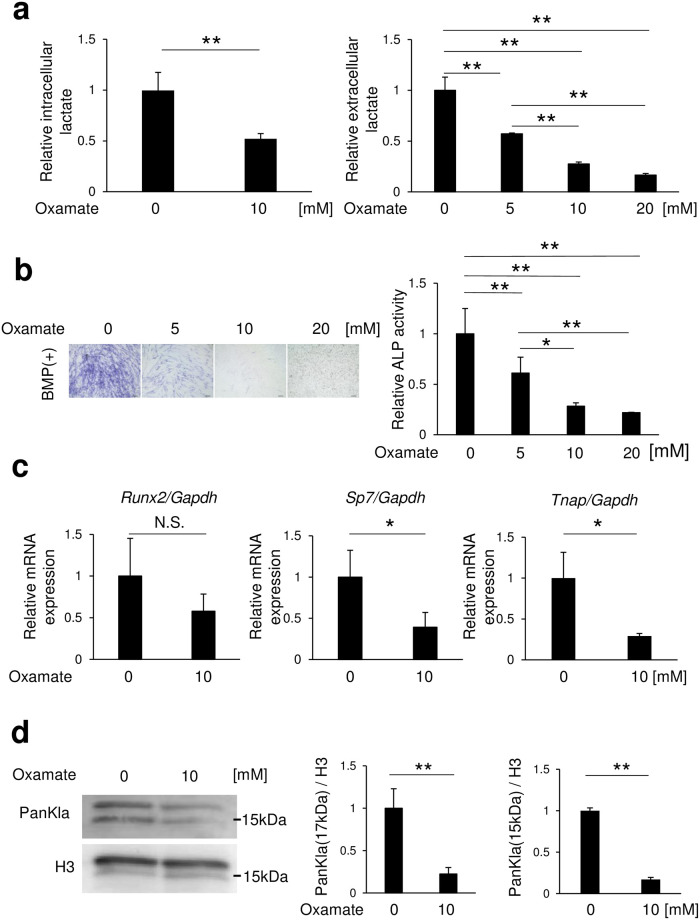
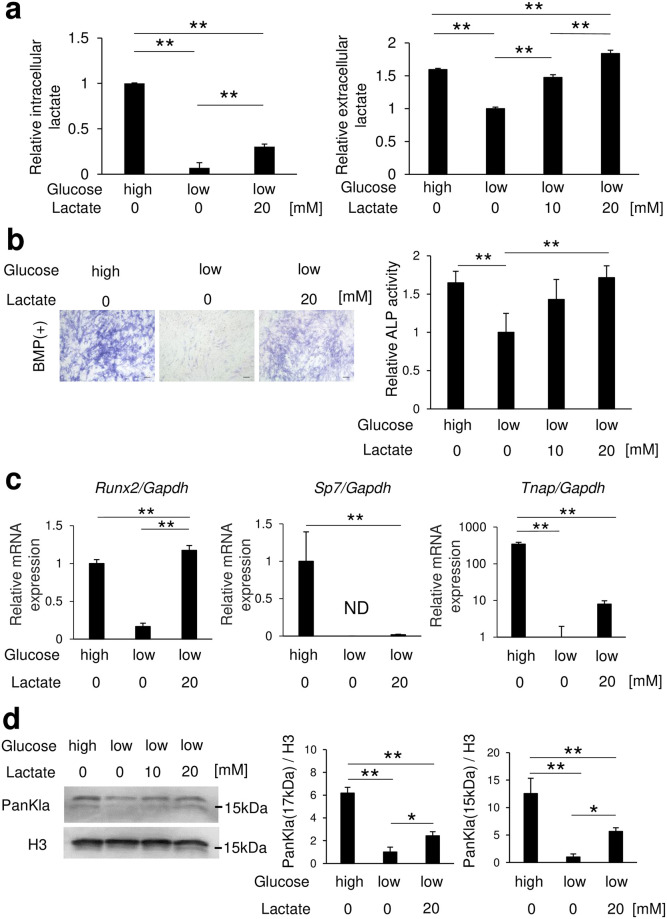
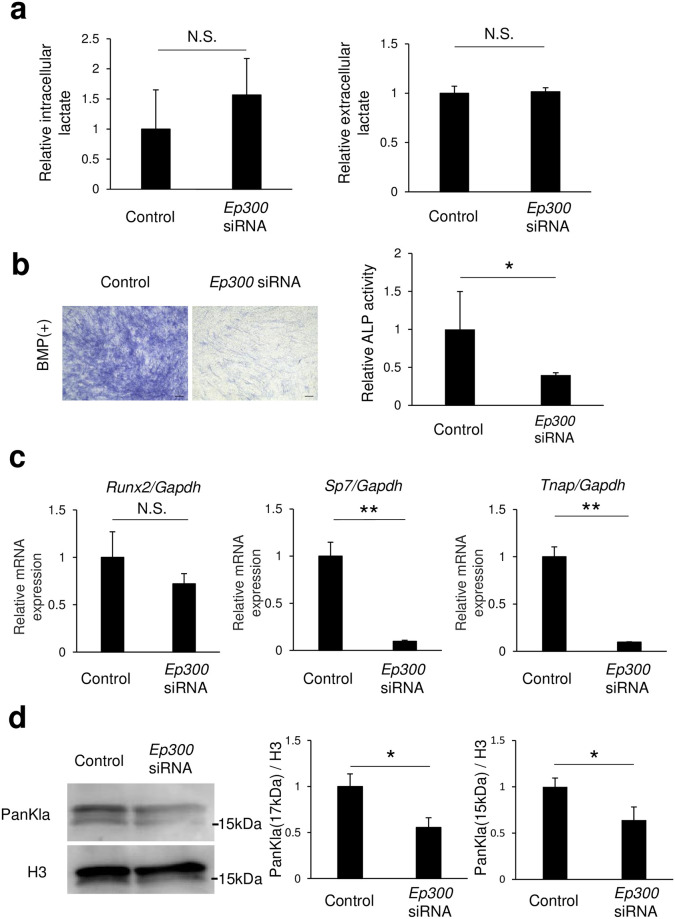
Verification
Claims the paper makes
The claims and statistics of this paper haven’t been checked yet.
Run the check — free, no account needed. It reads the open-access text and checks the sources it cites.
Claims other papers make about this one
Each is checked against this paper’s own text: does it say what the citing paper says it does?
The cited source says what the claim attributes to it.
In the citing paper
“Previous studies have demonstrated that lactate can improve the stability of the HIF-1α protein [9–11].”
From Lactylation modification of HIF-1α enhances its stability by blocking VHL recognition (2025) · cites this paper as [10]
The cited source says what the claim attributes to it.
In the citing paper
“In addition to its role in tumor tissues, lactate can trigger osteoblast differentiation and induce fibroblast metabolic reprogramming by stabilizing HIF-1α [10, 11].”
From Lactylation modification of HIF-1α enhances its stability by blocking VHL recognition (2025) · cites this paper as [10]
Self-check
Percentages, sums and reported differences re-computed from the paper’s own numbers.
The self-check needs the paper’s full text.
Citations
Cites
Chromatin modifications and their function
Kouzarides, T. (2007) · Cell · doi:10.1016/j.cell.2007.02.005 · Cited by 10,883
Jaenisch, R., & Bird, A. (2003) · Nature Genetics · doi:10.1038/ng1089 · Cited by 6,325
Metabolic regulation of gene expression by histone lactylation
Zhang, D., Tang, Z., Huang, H., Zhou, G., Cui, C., Weng, Y., Liu, W., Kim, S., Lee, S., Perez-Neut, M., et al. (2019) · Nature · doi:10.1038/s41586-019-1678-1 · Cited by 4,371
Nakashima, K., Zhou, X., Kunkel, G., Zhang, Z., Deng, J. M., Behringer, R. R., & de Crombrugghe, B. (2002) · Cell · doi:10.1016/s0092-8674(01)00622-5 · Cited by 3,608
DNA methylation landscapes: Provocative insights from epigenomics
Suzuki, M. M., & Bird, A. (2008) · Nature Reviews Genetics · doi:10.1038/nrg2341 · Cited by 3,039
ACETYLATION AND METHYLATION OF HISTONES AND THEIR POSSIBLE ROLE IN THE REGULATION OF RNA SYNTHESIS
Allfrey, V. G., Faulkner, R. D., & Mirsky, A. E. (1964) · Proceedings of the National Academy of Sciences · doi:10.1073/pnas.51.5.786 · Cited by 2,788
DNA Modification Mechanisms and Gene Activity During Development
Holliday, R., & Pugh, J. E. (1975) · Science · doi:10.1126/science.187.4173.226 · Cited by 1,973
Katagiri, T. (1994) · The Journal of Cell Biology · doi:10.1083/jcb.127.6.1755 · Cited by 1,452
Yu, J., Chai, P., Xie, M., Ge, S., Ruan, J., Fan, X., & Jia, R. (2021) · Genome biology · doi:10.1186/s13059-021-02308-z · Cited by 981
Cell–cell and intracellular lactate shuttles
Brooks, G. A. (2009) · The Journal of Physiology · doi:10.1113/jphysiol.2009.178350 · Cited by 833
Research works printed but not linked: 1
- T Katagiri, 1994, Bone morphogenetic protein-2 converts the differentiation pathway of C2C12 myoblasts into the osteoblast lineage, J Cell Biol, 127, 1755
Cited by
Sorted by citations
The role of protein lactylation: A kaleidoscopic post-translational modification in cancer
Iozzo, M., Pardella, E., Giannoni, E., & Chiarugi, P. (2025) · Molecular Cell · doi:10.1016/j.molcel.2025.02.011 · Cited by 126
Biochemistry and regulation of histone lysine l-lactylation
Sheng, X., Lin, H., Cole, P. A., & Zhao, Y. (2025) · Nature Reviews Molecular Cell Biology · doi:10.1038/s41580-025-00876-7 · Cited by 97
Metabolic reprogramming in skeletal cell differentiation
Bertels, J., He, G., & Long, F. (2024) · Bone Research · doi:10.1038/s41413-024-00374-0 · Cited by 78
Bone metabolism – an underappreciated player
Choi, I. A., Umemoto, A., Mizuno, M., & Park‐Min, K. (2024) · npj Metabolic Health and Disease · doi:10.1038/s44324-024-00010-9 · Cited by 75
Lactate-mediated lactylation in human health and diseases: Progress and remaining challenges
Hu, X., Wu, X., Xu, J., & Xu, X. M. (2024) · Journal of Advanced Research · doi:10.1016/j.jare.2024.11.010 · Cited by 51
Lactylation modification of HIF-1α enhances its stability by blocking VHL recognition
Li, C., Fu, C., Zhou, W., Li, H., Liu, Z., Wu, G., He, T., Shen, M., & Liu, H. (2025) · Cell Communication and Signaling · doi:10.1186/s12964-025-02366-x · Cited by 60
“In addition to its role in tumor tissues, lactate can trigger osteoblast differentiation and induce fibroblast metabolic reprogramming by stabilizing HIF-1α [10, 11].”
Lactate and lysine lactylation of histone regulate transcription in cancer
Yang, Y., Luo, N., Gong, Z., Zhou, W., Ku, Y., & Chen, Y. (2024) · Heliyon · doi:10.1016/j.heliyon.2024.e38426 · Cited by 37
Shi, L., Li, B., Tan, J., Zhu, L., Zhang, S., Zhang, Y., Xiang, M., Li, J., Chen, Y., Han, X., et al. (2025) · Journal of Nanobiotechnology · doi:10.1186/s12951-025-03198-0 · Cited by 35
Kim, E. Y., Abides, J., Keller, C. R., Martinez, S. R., & Li, W. (2025) · Molecules · doi:10.3390/molecules30081763 · Cited by 28
Lactylation’s role in bone health and disease: mechanistic insights and therapeutic potential
Ye, Z., Chen, X., Zou, J., Wu, W., Yang, J., Li, Y., Guo, L., & Luo, T. (2025) · PeerJ · doi:10.7717/peerj.19534 · Cited by 23
PKM2 controls cochlear development through lactate-dependent transcriptional regulation
Wu, M., Jia, G., Liu, Y., Lou, Y., Li, Y., Xia, M., Li, H., & Li, W. (2025) · Proceedings of the National Academy of Sciences · doi:10.1073/pnas.2410829122 · Cited by 22
The role of lactylation in tumor growth and cancer progression
Al-Malsi, K., Xie, S., Cai, Y., Mohammed, N., Xie, K., Lan, T., & Wu, H. (2025) · Frontiers in Oncology · doi:10.3389/fonc.2025.1516785 · Cited by 21
Lactylation in cancer: molecular mechanisms and advances in clinical study
Li, J., Miao, C., Guo, H., Lin, M., Chen, R., Peng, J., Wang, J., Tang, C., & Chen, Z. (2026) · Molecular Cancer · doi:10.1186/s12943-026-02573-1 · Cited by 21
Zhang, Y., Zhao, C., Zhou, Z., Li, C.-C., & Wang, Q. (2025) · Journal of Orthopaedic Surgery and Research · doi:10.1186/s13018-025-05894-x · Cited by 19
Zhu, Z., Huang, C., Chen, J., Wan, L., Zhang, C., & Wang, J. (2025) · Journal of Translational Medicine · doi:10.1186/s12967-025-07498-9 · Cited by 15
Lactate and lactylation in the kidneys: Current advances and prospects (Review)
Li, X., Hu, L., Hu, Q., & Jin, H. (2025) · International Journal of Molecular Medicine · doi:10.3892/ijmm.2025.5562 · Cited by 13
Jheng, Y.-L., de Cruys, S. V., Brabandere, L. D., Maertens, K., & Poels, K. (2025) · Scientific Reports · doi:10.1038/s41598-025-98709-2 · Cited by 11
Yan, H., Jian, Z., & Wu, T. (2025) · Oral Science and Homeostatic Medicine · doi:10.26599/oshm.2025.9610025 · Cited by 11
Yang, Y., Shi, J., Yu, J., Zhao, X., Zhu, K., Wang, S., Zhang, X., Zhang, X., Wei, G., & Cao, W. (2024) · Journal of Inflammation Research · doi:10.2147/jir.s497240 · Cited by 10
Shen, J., Pei, Y., Bai, S., Lei, S., Xia, S., Zhang, J., Li, X., Xu, H., Zheng, X., Shen, X., et al. (2025) · Life Sciences · doi:10.1016/j.lfs.2025.123639 · Cited by 10
Xie, Y., Umar, M., Luo, Y., Huang, K., Lu, K., Lei, Y., Liao, J., Chen, H., Huang, W., Zhu, Z., et al. (2025) · Pharmacological Research · doi:10.1016/j.phrs.2025.107976 · Cited by 9
Lactate induces oxidative phosphorylation in osteoblasts via Gpr81–Stat3 signaling
Hu, X., Shen, J., Wang, R., Han, C., Shi, X., Hu, J., Zhang, M., Wang, P., Zhang, X., & Wu, Y. (2025) · Cellular Signalling · doi:10.1016/j.cellsig.2025.111877 · Cited by 8
Lysine lactylation: Regulatory mechanisms, role in health and disease, and its therapeutic potential
Xu, Y., Zhang, G., Wei, H., Zhao, A., Zheng, Y., Shao, Y., Yang, L., & Jiang, X. (2025) · Drug Discovery Today · doi:10.1016/j.drudis.2025.104420 · Cited by 8
Lactylation and acetylation: parallel paths, divergent deeds, and research dilemmas
Jiang, W., Chen, Y., Lin, S., Liu, Y., & Liao, X. (2026) · Journal of Translational Medicine · doi:10.1186/s12967-026-07877-w · Cited by 8
Zhang, C., & Huang, X. (2025) · Immunological Investigations · doi:10.1080/08820139.2025.2465644 · Cited by 8
Lactate and lactylation in breast cancer: current understanding and therapeutic opportunities
Huang, L. J., Chen, X., Yan, M., Xiang, Z., & Wu, J. (2025) · Cancer Biology and Medicine · doi:10.20892/j.issn.2095-3941.2025.0173 · Cited by 6
Lactylation modifications in urological diseases: molecular mechanisms and biological implications
Yang, S., Ye, Z., Zhao, S., & Fan, C. (2025) · Clinical Epigenetics · doi:10.1186/s13148-025-01947-4 · Cited by 6
Histone modifications: Unveiling the epigenetic enigma of degenerative skeletal diseases
Zhang, Y., Wang, J., Hua, D., Fan, C., He, W., Deng, Y., Tang, M., Geng, D., Wu, X., & Mao, H. (2025) · Journal of Orthopaedic Translation · doi:10.1016/j.jot.2025.08.013 · Cited by 9
Chen, H., Hua, C., Chang, S., Qiu, Y., Lin, X., & Sun, B. (2025) · Stem Cell Research & Therapy · doi:10.1186/s13287-025-04651-5 · Cited by 6
Shao, Z., Deng, Q., Cheng, L., Wu, J., Sun, W., Liang, W., & Li, H. (2025) · Frontiers in Immunology · doi:10.3389/fimmu.2025.1680305 · Cited by 6
Lactylation: From Molecular Insights to Disease Relevance
Yao, X., Zhang, L., Shang, D., & Xiang, H. (2025) · Biomolecules · doi:10.3390/biom15060810 · Cited by 5
Xu, X., Xie, J., Li, E., Yang, D., Yu, H., Min, W., Wang, J., Xu, P., & Guo, J. (2026) · International Journal of Surgery · doi:10.1097/js9.0000000000004934 · Cited by 5
Lactylation in pulmonary fibrosis: current understanding and challenges
Li, B., Li, X.-H., Zhou, Y., Feng, D., Luo, Z.-Q., & Cheng, H. (2026) · Journal of Translational Medicine · doi:10.1186/s12967-026-07991-9 · Cited by 5
Nian, F., Guo, L., Fei, Z., Yang, M., Chen, L., Zhang, Y., Zhang, B., Qian, Y., & Zhang, Z. (2025) · Acta Histochemica · doi:10.1016/j.acthis.2025.152273 · Cited by 4
From lactate to lactylation: potential targets for the treatment of neurodegenerative diseases
Wang, B., Qian, S., Shi, C., Li, D., Zhai, T., Zhang, C., Shen, J., Yang, Y., & Zhao, L. (2025) · Reviews in the Neurosciences · doi:10.1515/revneuro-2025-0068 · Cited by 5
Lactylation Dynamics and Its Regulatory Roles in Orthopedic Pathologies: A Research Update
Xu, Z., Peng, C., Dong, C., Wei, G., Zheng, C., Yin, X., Hu, Q., Wu, X., & Ao, J. (2025) · Journal of Proteome Research · doi:10.1021/acs.jproteome.5c00714 · Cited by 4
Zhu, X., Hou, J., Lv, Z., Sun, M., Zhang, X., Zhang, L., & Wang, M. (2025) · The Kaohsiung Journal of Medical Sciences · doi:10.1002/kjm2.70123 · Cited by 4
Histone lactylation: A sensor of epigenetic reprogramming mediated by cellular metabolism
Wang, L., Song, S., Yao, S., Wang, Z., Li, Q., Ma, Z., Li, J., Li, Y., Yang, M., Zhang, K., et al. (2026) · Cellular Signalling · doi:10.1016/j.cellsig.2026.112483 · Cited by 4
Unlocking the potential of histone modification in regulating bone metabolism
Zhang, J., Liu, H., Liu, Y., Luo, E., & Liu, S. (2024) · Biochimie · doi:10.1016/j.biochi.2024.08.004 · Cited by 4
Novel epigenetic roles of lactylation in osteogenesis
Sasa, K., Kato, T., & Yamada, A. (2024) · Epigenomics · doi:10.1080/17501911.2024.2355861 · Cited by 4
Self-citationLactylation modification in lung cancer: A review of current research and future directions (Review)
Lv, Q., Xu, J., Hu, N., Zhao, Y., Wang, X., Wang, T., & Tian, L. (2025) · Oncology Reports · doi:10.3892/or.2025.8981 · Cited by 3
Glycolysis Plays a Critical and Dual Role in Periodontitis
Ming, H., Li, Y., Chen, T., Wu, X., & Xie, X. (2025) · Journal of Cellular Physiology · doi:10.1002/jcp.70098 · Cited by 3
Wu, G., Chen, M., Li, C., Wei, M., Pan, Y., He, T., Liu, Z., Li, H., Zhang, C., Zhang, J., et al. (2025) · Research · doi:10.34133/research.1045 · Cited by 3
Lactylation Modification: From Basic Biological Process to Clinical Cardiovascular Diseases
Geng, J., Fang, Z., Zhang, Z., Ge, J., & Li, H. (2026) · Research · doi:10.34133/research.1228 · Cited by 3
Lactate targeting: Regulatory networks and therapeutic potential in bone diseases
Zhang, X., Yan, X., Gao, W., Ma, J., Wu, Z., An, N., Qiu, L., & 郭佳杰 (2026) · International Immunopharmacology · doi:10.1016/j.intimp.2026.116376 · Cited by 2
Crosstalk between lactylation and other post-translational modifications in health and diseases
Qi, W., Su, J., He, X., Yang, F., Li, Q., & Li, B. (2026) · Molecular Biomedicine · doi:10.1186/s43556-026-00500-w · Cited by 3
Wang, T., Chen, S., & Hong, Z. (2025) · Journal of Advanced Research · doi:10.1016/j.jare.2025.09.058 · Cited by 1
Xie, Q., Weng, L., Hu, Y., Tao, Q., & Ma, R. (2025) · Cancer Biology & Therapy · doi:10.1080/15384047.2025.2603081 · Cited by 1
Kozlov, A. M., Leung, Z. C. L., Wilson, R. B., Bhangal, S., Nygard, K. L., Powell, A. M., Borradaile, N. M., Betts, D. H., & Cumming, R. C. (2025) · Biology Open · doi:10.1242/bio.062432 · Cited by 1
Harnessing energy metabolism for enhanced bone defect repair: Mechanisms and therapeutic strategies
Li, J. M., Liu, Y., Li, Y., Hua, Y., Jiang, X., & Zhou, M. (2026) · Open Research (University of Surrey) · doi:10.1002/viw.20250214 · Cited by 2
Lactylation: Unlocking the regulatory code of exercise-mediated anti-aging
Li, X., Fan, K.-C., Sun, G.-Y., & Wang, Z. (2026) · Ageing Research Reviews · doi:10.1016/j.arr.2026.103143 · Cited by 1
Yu, X., Zhu, M., Luo, X., Hu, J., Wang, S., Xu, Q., Liu, X., Zhang, B., Zhan, H., & Zhang, S. Y. (2026) · The FASEB Journal · doi:10.1096/fj.202502919rr · Cited by 1
Wang, M., Liang, J., Zhu, X., Xing, Y., Chang, S., Jia, D., & Zhao, W. (2026) · Phytotherapy Research · doi:10.1002/ptr.70386 · Cited by 1
Zong, B., Yu, F., Li, S., & Sun, P. (2026) · Journal of Orthopaedic Translation · doi:10.1016/j.jot.2026.101144 · Cited by 1
Epigenetics of bone formation and diseases: From mechanisms to therapies
Yang, Y., Zhang, C., Li, Y., Yu, L., & Wu, M. (2026) · Genes & Diseases · doi:10.1016/j.gendis.2026.102280 · Cited by 1
Lactylation: a metabolic–epigenetic driver in atherosclerosis pathogenesis and therapeutic targeting
Lv, W., Xie, L., Tao, J., Xu, Q., Hu, W., Xie, H., Lu, P., Xu, Y., & Huang, L. (2026) · Frontiers in Cardiovascular Medicine · doi:10.3389/fcvm.2026.1790479 · Cited by 1
Lactate in ruminant health: metabolic roles and the emerging significance of lactylation
Li, X., Jiang, M., Huang, Y., Wang, D., & Cheng, J. (2026) · Journal of Animal Science and Biotechnology/Journal of animal science and biotechnology · doi:10.1186/s40104-026-01442-7 · Cited by 1
Glucose-Fueled Histone Modifications Drive HIV-1 Latency Reversal at HypoxiaPreprint
Kayode, Y. I., Clemmer, D. C., Owolabi, A. A., AlShaheeb, A. A., McMahon, E. K., Tangiyan, A., Clark, L., Simmons, G. E., Bosque, A., McReynolds, M. R., et al. (2025) · bioRxiv (Cold Spring Harbor Laboratory) · doi:10.1101/2025.09.14.676169
Lactate and lactylation in osteoporosis: pathogenesis, regulation, and future perspectives
Sun, J., Ge, M., Gao, P., Zhang, N., Huang, T., & Liu, T. (2026) · Journal of Bone and Mineral Metabolism · doi:10.1007/s00774-026-01722-2
Wang, Z., Dong, S., Xu, K., Tang, X., Guo, S., Jiang, Y., Zhang, Y., & Li, T. (2026) · The FASEB Journal · doi:10.1096/fj.202504776r
Komatsu, T., & Inagaki, T. (2026) · bioRxiv (Cold Spring Harbor Laboratory) · doi:10.64898/2026.04.14.718598
Liu, Y.-S., Liu, N., Cui, X.-Z., Liu, L.-N., Zhang, M., & Wang, H. (2026) · Plants · doi:10.3390/plants15131955
Bai, J., Zhang, Y., Jin, M., Qiao, M., Li, L., An, J., Xinsai, L., Li, S., Yang, Y., Wang, A., et al. (2026) · Biochemical Pharmacology · doi:10.1016/j.bcp.2026.118190
The research of lactylation in the field of reproduction
Huang, Y., Liang, Y., & Chen, J. F. (2026) · Biology of Reproduction · doi:10.1093/biolre/ioag133
Zhang, Z.-W., Zhou, Y., Dong, H.-M., Kong, J., Chen, B.-A., Chen, H.-B., & Wang, R.-C. (2026) · Psycho-Oncologie · doi:10.18282/po5898
Tao, L., Guo, F., Liu, X., Zhao, X., Xue, Y., Bian, W., Chen, J., Zhang, S., & Li, B. (2026) · Oncogenesis · doi:10.1038/s41389-026-00641-1
Ma, X., Zhang, H., Wang, Y., Sun, H., Liang, J., Wang, Y., & Yang, W. (2026) · Archives of Biochemistry and Biophysics · doi:10.1016/j.abb.2026.110941
Zeng, Q., Duan, Z., Liu, Q., Yang, L., Zhao, S., Lv, Y., Huang, X., Zhang, J., Su, J., Lu, Z., et al. (2026) · bioRxiv (Cold Spring Harbor Laboratory) · doi:10.64898/2026.07.30.741507
Liu, T., He, G., Zhong, W., Lin, X., Liang, R., & Huang, X. (2026) · Discovery Medicine · doi:10.24976/discov.med.202638211.201
Wu, T., Ng, R. R., Lau, A. T. Y., & Xu, Y. (2026) · Fundamental Research · doi:10.1016/j.fmre.2026.09.003
Wang, C., Jin, Y., & Cai, W. (2026) · Journal of Molecular Neuroscience · doi:10.1007/s12031-026-02604-y
Song, J., Li, F., Zou, W., Zhang, Y., Cheng, Y., Yang, B., & Kuang, H. (2026) · Life Sciences · doi:10.1016/j.lfs.2026.124700
Weng, L., Yuan, Q., Mo, T., Yuan, T., Xiong, Z., & Ding, L. (2026) · Frontiers in Immunology · doi:10.3389/fimmu.2026.1953599
Wei, B., Yijing, L., Li, Y., Zhang, X., Ge, S., Wan, H., Wang, X., Tian, J., & Wang, S. (2026) · Journal of Molecular Histology · doi:10.1007/s10735-026-11002-y
The role of histone modification in epigenetic regulation of gene expression and cell specification
Liegro, C. M. D., Schiera, G., & Liegro, I. D. (2026) · Handbook of clinical neurology · doi:10.1016/b978-0-443-19043-8.00012-8
Bai, J. (2026) · Frontiers in Aging Neuroscience · doi:10.3389/fnagi.2026.1949312
Metadata
- Authors
- Minami, E., Sasa, K., Yamada, A., Kawai, R., Yoshida, H., Nakano, H., Maki, K., & Kamijo, R.
- Affiliations
- SHOWA Medical University (JP)
- Corresponding author
- Sasa, Kiyohito
- Venue
- PLOS ONE
- Publisher
- Public Library of Science (PLoS)
- Published
- 2023-12-05
- Volume
- 18
- Issue
- 12
- Pages
- e0293676
- ISSN
- 1932-6203 (ISSN-L)
- PMC
- PMC10697613
- OpenAlex
- W4389331757
- Cited by
- 73
- References
- 27
- Citations by year
- 2026: 31 · 2025: 35 · 2024: 7
- FWCI
- 6.50
- Type
- journal article
- Language
- en
- Open access
- gold
- doi.org
- Licence
- Locations
- PLoS ONE (publishedVersion, cc-by)
- PubMed Central (publishedVersion, cc-by)
- PubMed (publishedVersion)
- DOAJ (DOAJ: Directory of Open Access Journals) (submittedVersion, cc-by-sa)
- Funders
- Japan Society for the Promotion of Science (21K16936, 23K09128)
- Topics
- Life Sciences › Biochemistry, Genetics and Molecular Biology › Molecular Biology › Bone Metabolism and Diseases
- Life Sciences › Biochemistry, Genetics and Molecular Biology › Cancer Research › Cancer, Hypoxia, and Metabolism
- Life Sciences › Biochemistry, Genetics and Molecular Biology › Molecular Biology › Genomics and Chromatin Dynamics
- Keywords
- histone lactylation, lactate, P300, osteogenic differentiation, LDHA, BMP-2, high glucose, C2C12 myoblasts, Runx2, Osterix, tissue-nonspecific alkaline phosphatase, osteoblastogenesis, histone modifications, gene expression regulation
- MeSH terms
- Cell Differentiation, Glucose, Histones, Osteoblasts, Lactic Acid
About these checks
Registry, retraction, Cites and statistics results are computed, not judged, with one exception: a printed reference that no index lists is read once by a model before it counts as a citation error. Claims are extracted by a model and kept only when their quote appears verbatim in the text; each cited source is then checked, with a model’s help, for whether it says what the claim relies on. Those verdicts can be wrong — read the claim’s quote and the cited source before relying on one.
Statistics and arithmetic are recomputed, not judged.
Confidence bands are shown only for fields calibrated on our annotated test set. None is calibrated yet, so no band is shown.
What counts as a claim ›How we measure confidence ›How we check this ›
Are you an author, or do you see a problem with this page? Request a review
