

The DOI matches its Crossref record; 78 of the 78 references it cites were found in a registry or an index.
Post-transcriptional control drives Aurora kinase A expression in human cancers
Open accessPublished version of a preprint
Abstract
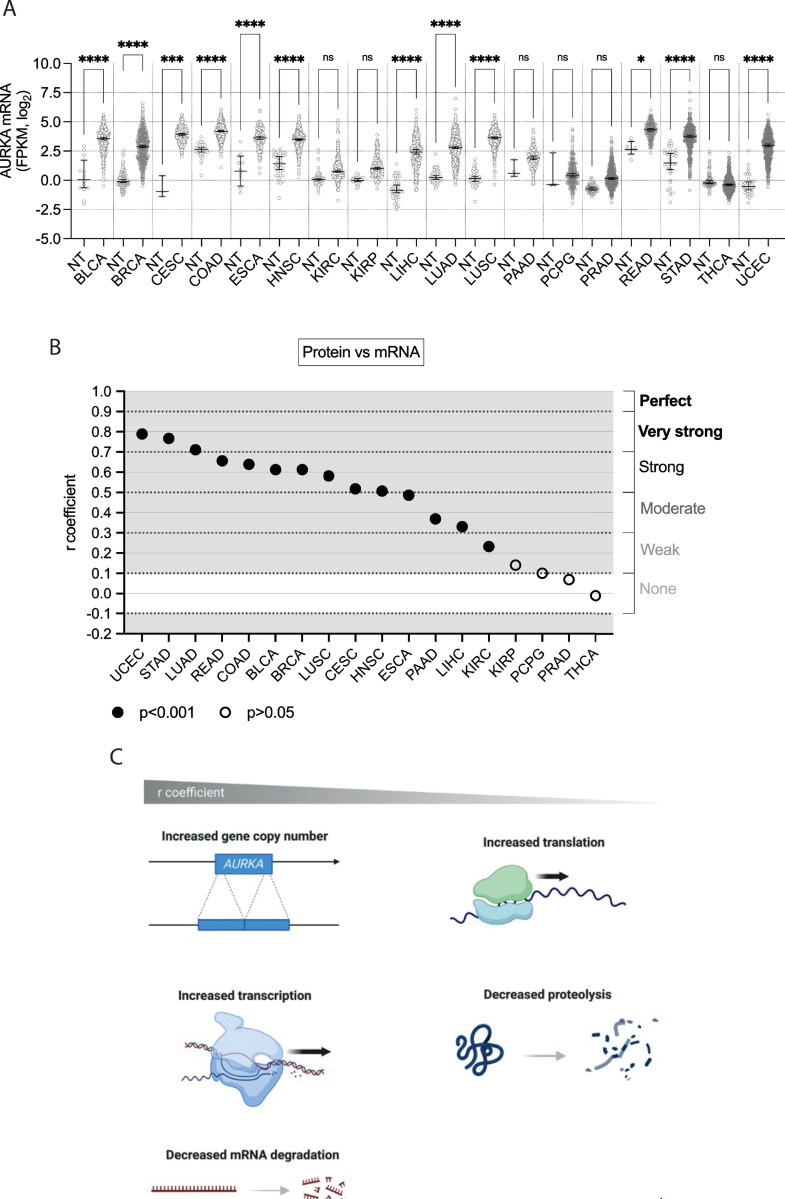
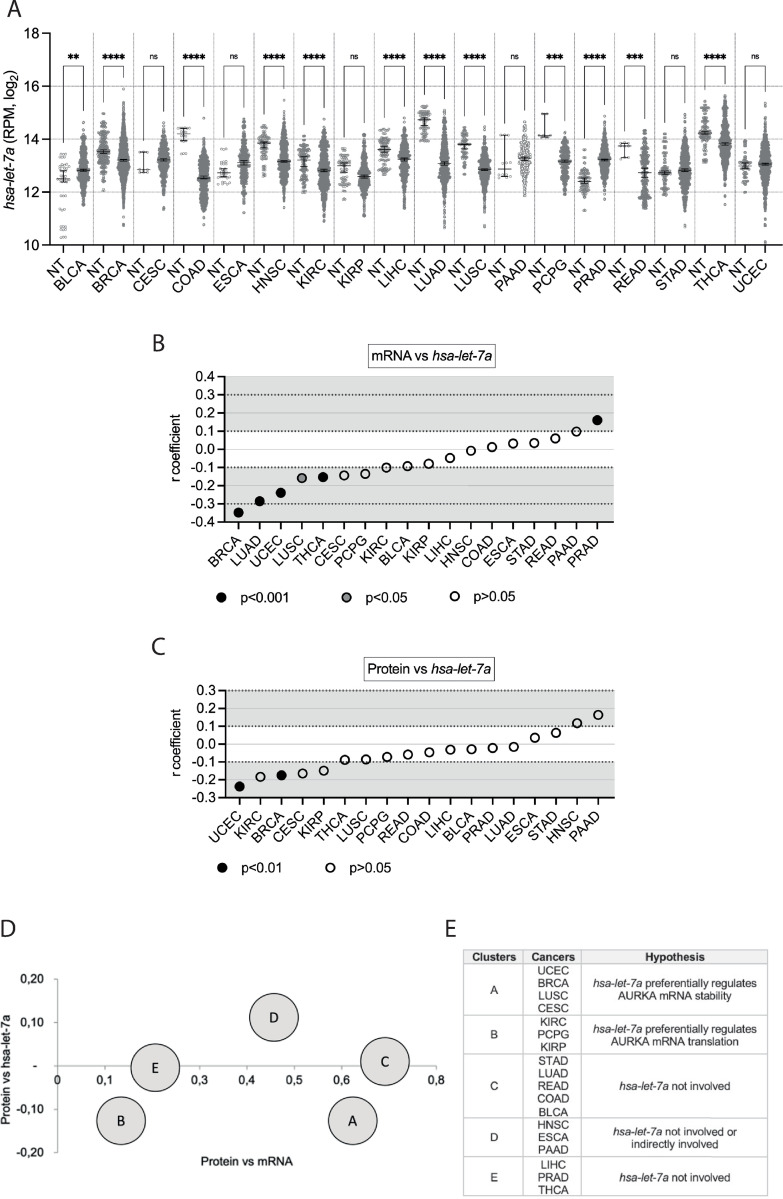
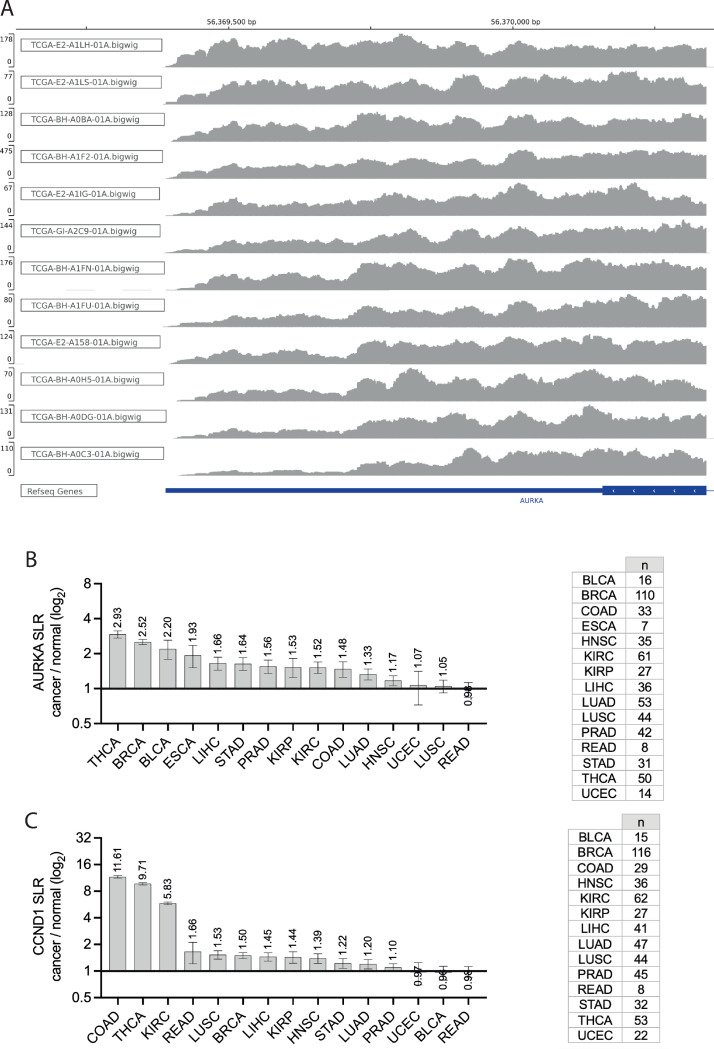
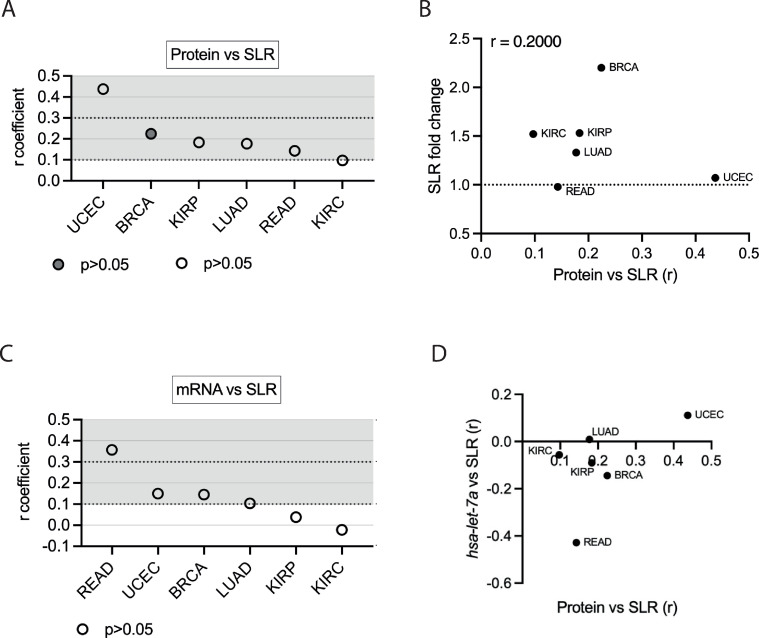
Aurora kinase A (AURKA) is a major regulator of the cell cycle. A prominent association exists between high expression of AURKA and cancer, and impairment of AURKA levels can trigger its oncogenic activity. In order to explore the contribution of post-transcriptional regulation to AURKA expression in different cancers, we carried out a meta-analysis of -omics data of 18 cancer types from The Cancer Genome Atlas (TCGA). Our study confirmed a general trend for increased AURKA mRNA in cancer compared to normal tissues and revealed that AURKA expression is highly dependent on post-transcriptional control in several cancers. Correlation and clustering analyses of AURKA mRNA and protein expression, and expression of AURKA-targeting hsa-let-7a miRNA, unveiled that hsa-let-7a is likely involved to varying extents in controlling AURKA expression in cancers. We then measured differences in the short/long ratio (SLR) of the two alternative cleavage and polyadenylation (APA) isoforms of AURKA mRNA across cancers compared to the respective healthy counterparts. We suggest that the interplay between APA and hsa-let-7a targeting of AURKA mRNA may influence AURKA expression in some cancers. hsa-let-7a and APA may also independently contribute to altered AURKA levels. Therefore, we argue that AURKA mRNA and protein expression are often discordant in cancer as a result of dynamic post-transcriptional regulation.
Overview
The claims and statistics of this paper haven’t been checked yet.
Run the check — free, no account needed. It reads the open-access text and checks the sources it cites.
Integrity signals
Registry
Cites
Statistics
Figures
Verification
Claims the paper makes
The claims and statistics of this paper haven’t been checked yet.
Run the check — free, no account needed. It reads the open-access text and checks the sources it cites.
Self-check
Percentages, sums and reported differences re-computed from the paper’s own numbers.
The self-check needs the paper’s full text.
Citations
Cites
Database resources of the National Center for Biotechnology Information: update
Wheeler, D. L. (2004) · Nucleic Acids Research · doi:10.1093/nar/gkh073 · Cited by 10,641
Global quantification of mammalian gene expression control
Schwanhäusser, B., Busse, D., Li, N., Dittmar, G., Schuchhardt, J., Wolf, J., Chen, W., & Selbach, M. (2011) · Nature · doi:10.1038/nature10098 · Cited by 6,566 · cited 1×
“…than those measured between hsa-let-7a and AURKA mRNA expression but might reflect a connection between hsa-let-7a and protein levels, underpinned by a role of hsa-let-7a in either AURKA mRNA abundance or translation rate, according to whether a link exists between hsa-let-7a and AURKA mRNA or not.”
BackgroundUALCAN: A Portal for Facilitating Tumor Subgroup Gene Expression and Survival Analyses
Chandrashekar, D. S., Bashel, B., Balasubramanya, S. A. H., Creighton, C. J., Ponce-Rodriguez, I., Chakravarthi, B. V. S. K., & Varambally, S. (2017) · Neoplasia · doi:10.1016/j.neo.2017.05.002 · Cited by 6,086
GEPIA2: an enhanced web server for large-scale expression profiling and interactive analysis
Tang, Z., Kang, B., Li, C., Chen, T., & Zhang, Z. (2019) · Nucleic Acids Research · doi:10.1093/nar/gkz430 · Cited by 5,318
miRBase: from microRNA sequences to function
Kozomara, A., Birgaoanu, M., & Griffiths-Jones, S. (2019) · Nucleic Acids Research · doi:10.1093/nar/gky1141 · Cited by 4,843
Review The Cancer Genome Atlas (TCGA): an immeasurable source of knowledge
Tomczak, K. J., Czerwińska, P., & Wiznerowicz, M. (2015) · Współczesna Onkologia · doi:10.5114/wo.2014.47136 · Cited by 3,880
Tumour heterogeneity and resistance to cancer therapies
Dagogo-Jack, I., & Shaw, A. T. (2018) · Nature Reviews Clinical Oncology · doi:10.1038/nrclinonc.2017.166 · Cited by 3,846
GENCODE reference annotation for the human and mouse genomes
Frankish, A., Diekhans, M., Ferreira, A.-M., Johnson, R., Jungreis, I., Loveland, J. E., Mudge, J. M., Sisu, C., Wright, J. C., Armstrong, J. C., et al. (2018) · Nucleic Acids Research · doi:10.1093/nar/gky955 · Cited by 3,018
Database resources of the national center for biotechnology information
Sayers, E. W., Bolton, E. E., Brister, J. R., Canese, K., Chan, J., Comeau, D. C., Connor, R., Funk, K., Kelly, C., Kim, S., et al. (2022) · Nucleic Acids Research · doi:10.1093/nar/gkab1112 · Cited by 2,812
Cunningham, F., Allen, J. E., Allen, J., Alvarez-Jarreta, J., Amode, M. R., Armean, I. M., Austine-Orimoloye, O., Azov, A. G., Barnes, I., Bennett, R., et al. (2022) · Nucleic Acids Research · doi:10.1093/nar/gkab1049 · Cited by 1,923
Metadata
- Authors
- Cacioppo, R., Rad, D., Pagani, G., Gandellini, P., & Lindon, C.
- Affiliations
- MRC Laboratory of Molecular Biology (GB)
- University of Cambridge (GB)
- University of Milan (IT)
- Corresponding author
- Cacioppo, Roberta
- Lindon, Catherine
- Venue
- PLOS ONE
- Publisher
- Public Library of Science (PLoS)
- Published
- 2024-11-11
- Volume
- 19
- Issue
- 11
- Pages
- e0310625
- ISSN
- 1932-6203 (ISSN-L)
- PMC
- PMC11554201
- OpenAlex
- W4404241562
- Cited by
- 3
- References
- 78
- Citations by year
- 2026: 2 · 2025: 1
- FWCI
- 0.12
- Type
- journal article
- Language
- en
- Open access
- gold
- doi.org
- Licence
- Locations
- PLoS ONE (publishedVersion, cc-by)
- bioRxiv (Cold Spring Harbor Laboratory) (acceptedVersion, cc-by)
- PubMed Central (publishedVersion, cc-by)
- PubMed (publishedVersion)
- Apollo (University of Cambridge) (submittedVersion, cc-by)
- Archivio Istituzionale della Ricerca (Universita Degli Studi Di Milano) (submittedVersion, cc-by)
- DOAJ (DOAJ: Directory of Open Access Journals) (submittedVersion, cc-by-sa)
- Funders
- Biotechnology and Biological Sciences Research Council (BB/R004137/1)
- Department of Pharmacology, University of Cambridge
- Topics
- Life Sciences › Biochemistry, Genetics and Molecular Biology › Molecular Biology › RNA Research and Splicing
- Life Sciences › Biochemistry, Genetics and Molecular Biology › Cancer Research › Cancer-related molecular mechanisms research
- Life Sciences › Biochemistry, Genetics and Molecular Biology › Cancer Research › MicroRNA in disease regulation
- Keywords
- AURKA, post-transcriptional regulation, alternative polyadenylation, microRNA, cancer, cell cycle regulation, mRNA isoforms
- MeSH terms
- Humans, Neoplasms, RNA Processing, Post-Transcriptional, RNA, Messenger, Gene Expression Regulation, Neoplastic, Polyadenylation, MicroRNAs, Aurora Kinase A
About these checks
Registry, retraction, Cites and statistics results are computed, not judged, with one exception: a printed reference that no index lists is read once by a model before it counts as a citation error. Claims are extracted by a model and kept only when their quote appears verbatim in the text; each cited source is then checked, with a model’s help, for whether it says what the claim relies on. Those verdicts can be wrong — read the claim’s quote and the cited source before relying on one.
Statistics and arithmetic are recomputed, not judged.
Confidence bands are shown only for fields calibrated on our annotated test set. None is calibrated yet, so no band is shown.
What counts as a claim ›How we measure confidence ›How we check this ›
Are you an author, or do you see a problem with this page? Request a review
How to cite
Cite CoChat for the checks on this page, and the paper for its own findings.
- This page
- CoChat. (2026). Citation check: Post-transcriptional control drives Aurora kinase A expression in human cancers. https://app.cochat.ai/papers/10.1371/journal.pone.0310625
- The paper
- Cacioppo, R., Rad, D., Pagani, G., Gandellini, P., & Lindon, C. (2024). Post-transcriptional control drives Aurora kinase A expression in human cancers. PLOS ONE. https://doi.org/10.1371/journal.pone.0310625
Data sources
Bibliographic data: Semantic Scholar, OpenAlex, Crossref.
Contains information from the Semantic Scholar Academic Graph Datasets, made available under the ODC Attribution License (ODC-BY 1.0).
Semantic Scholar’s data is described in: Kinney, R., et al. (2023). The Semantic Scholar Open Data Platform. arXiv:2301.10140.
