

The DOI matches its Crossref record; the references it cites are not checked yet.
Regional and temporal patterns of partisan polarization during the COVID-19 pandemic in the United States and Canada
Open accessAbstract
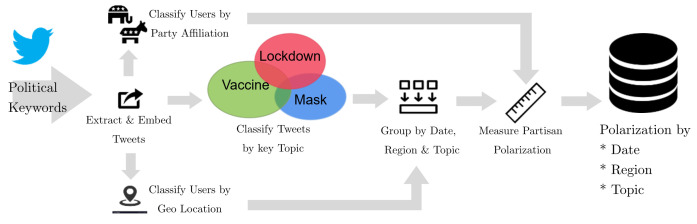
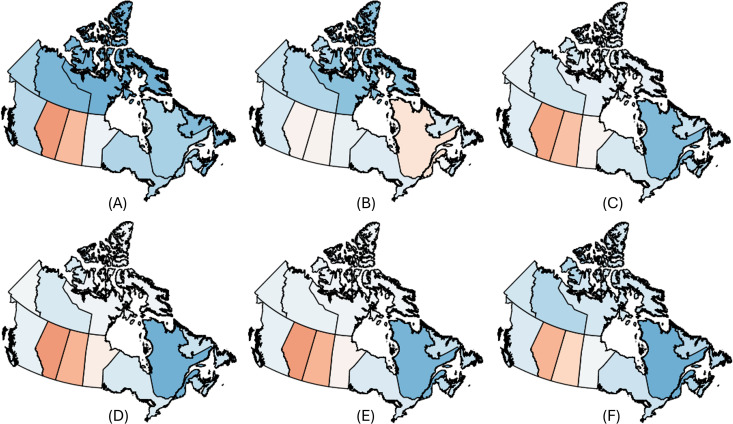
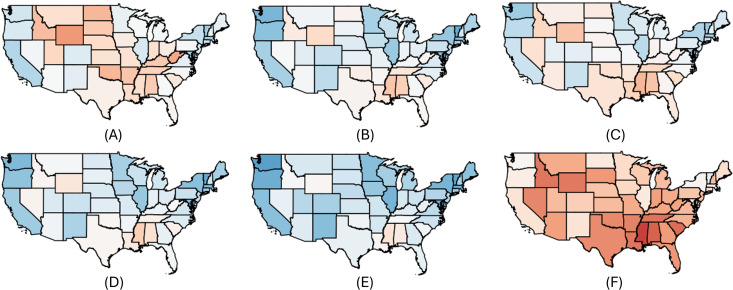
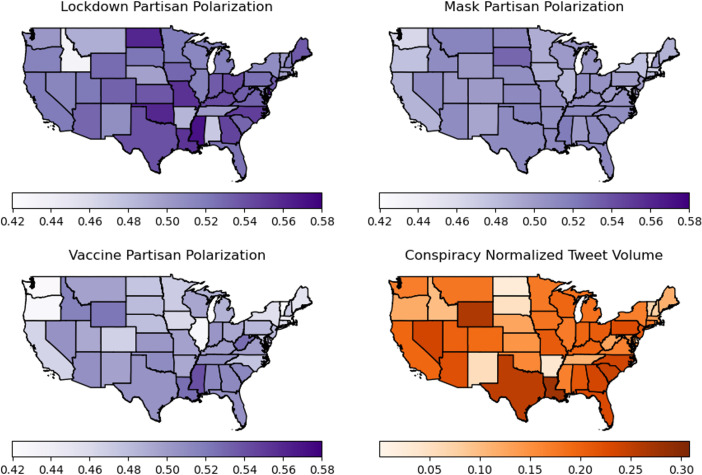
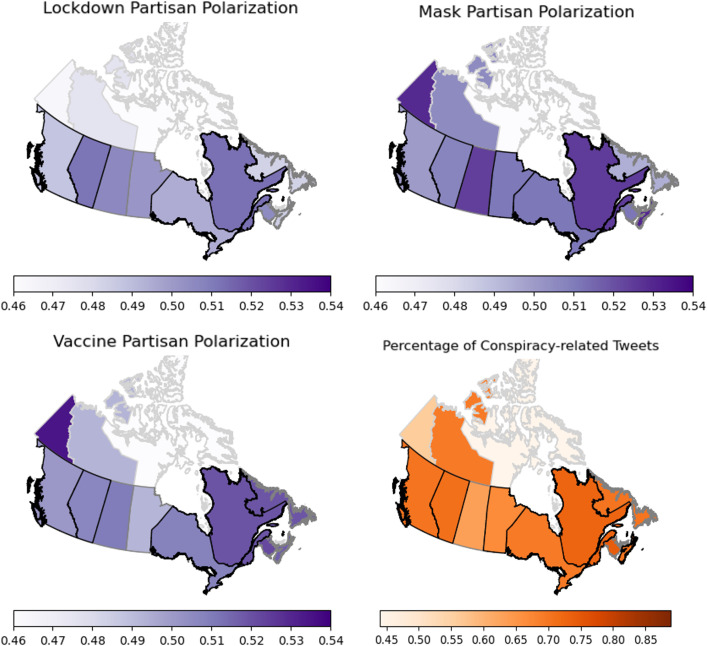
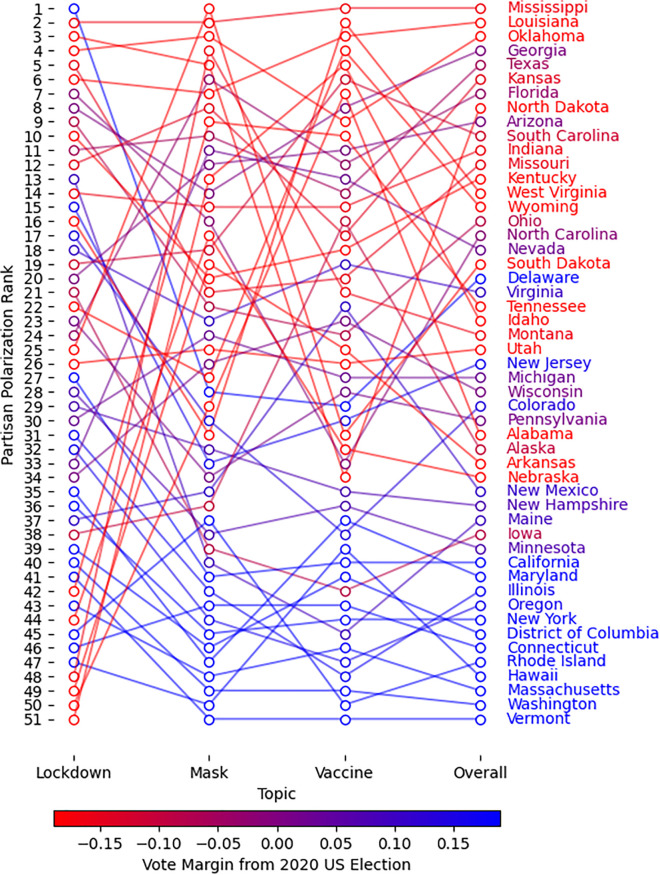
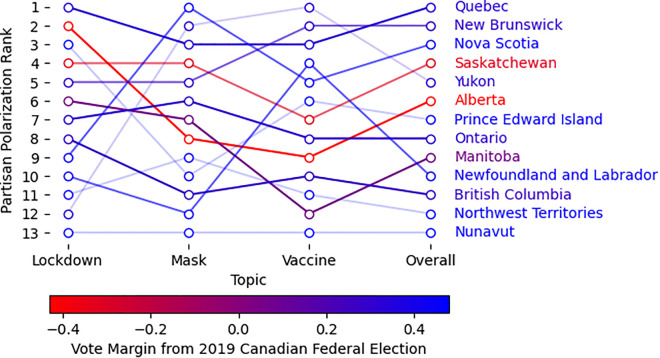
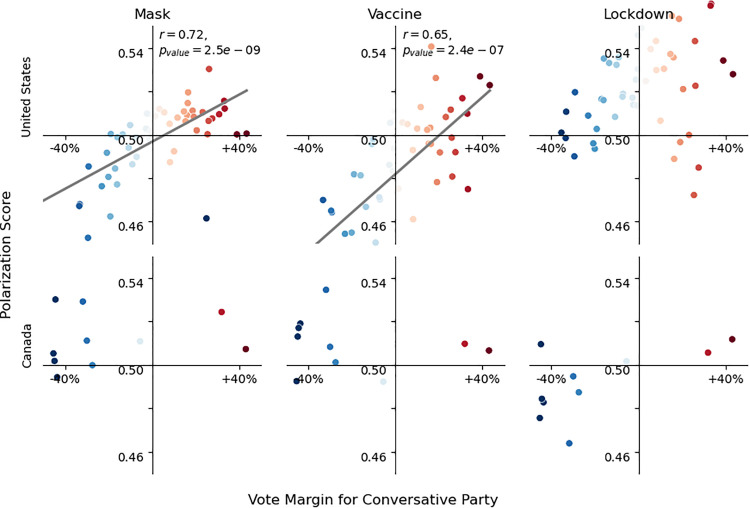
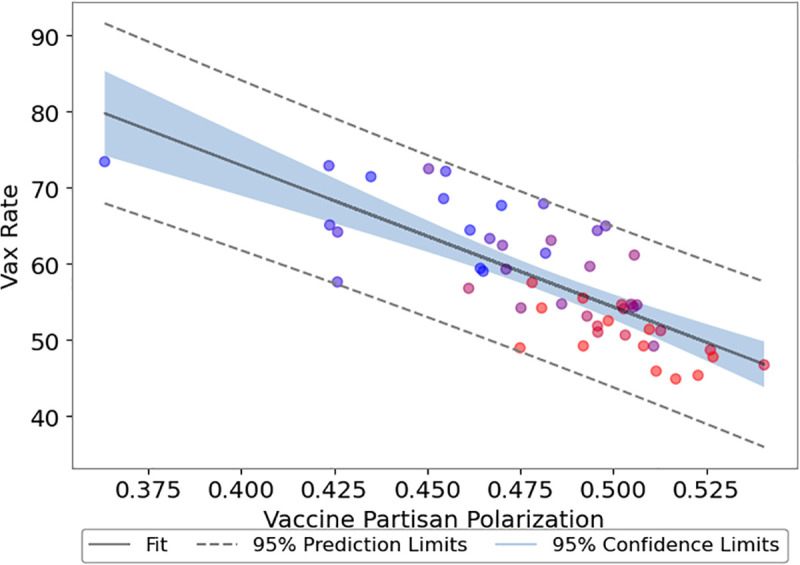
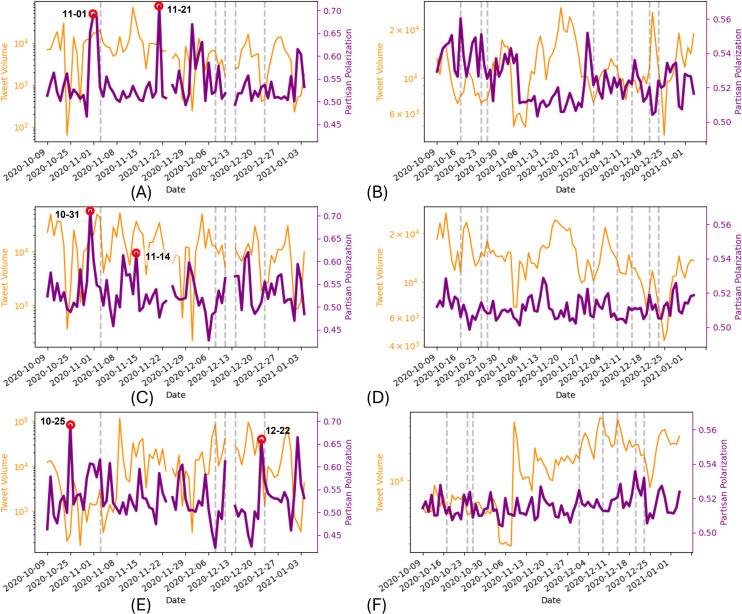
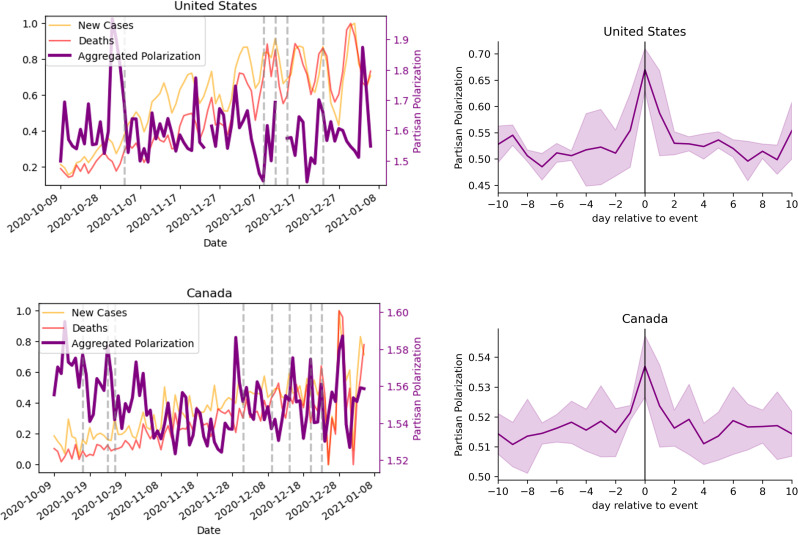
During the COVID-19 pandemic, public health measures emerged as highly polarizing topics in online discourse, with debates intensifying around specific policy implementations and events. This study introduces a novel computational approach to measure subnational and event-driven variation in partisan polarization and explores these dynamics across the United States and Canada. Analyzing over 50 million tweets from late 2020—a critical period of polarizing discourse during the pandemic’s early phase—we examine regional variations in discussions surrounding three key health interventions: lockdowns, masks, and vaccines. Our analysis reveals that politically conservative regions exhibited significantly higher levels of partisan polarization in both countries, with this effect particularly pronounced in the United States. We demonstrate a strong negative correlation between regional vaccination rates and the degree of polarization in vaccine-related discussions in the U.S., suggesting tangible public health implications of online partisan division. This relationship was notably weaker in Canada, pointing to important cross-national differences in how political polarization manifests and impacts health behaviors. By tracking the temporal evolution of polarization, we identify distinct spikes linked to specific political events and policy announcements. These polarization surges typically lasted only a few days, revealing the dynamic nature of online partisan discourse. The geographic heterogeneity in polarization patterns—with certain conservative states showing unexpectedly low polarization and some liberal states displaying high polarization—highlights the complex interplay between political ideology, policy implementation, and public response during health crises. While our polarization index reflects the discourse of politically engaged Twitter users, it nevertheless captures key dynamics of online debate that influence public narratives and align with observable regional outcomes. Our findings suggest that online discussions both reflect and potentially drive rapid changes in public opinion, with measurable consequences for regional public health outcomes. This computational framework for quantifying polarization provides a valuable tool for researchers and policymakers to understand, monitor, and potentially address partisan divisions during public health emergencies and beyond.
Overview
The claims and statistics of this paper haven’t been checked yet.
Run the check — free, no account needed. It reads the open-access text and checks the sources it cites.
Integrity signals
Registry
Cites
Statistics
Figures
Verification
Claims the paper makes
The claims and statistics of this paper haven’t been checked yet.
Run the check — free, no account needed. It reads the open-access text and checks the sources it cites.
Self-check
Percentages, sums and reported differences re-computed from the paper’s own numbers.
The self-check needs the paper’s full text.
Citations
The citation lists haven’t been fetched yet
Cited by 1
Research works printed but not linked: 75
- PS Hart, 2020, Politicization and polarization in COVID-19 news coverage, Science Communication, 42, 679, 10.1177/1075547020950735 · DOI
- S Iyengar, 2019, The Origins and Consequences of Affective Polarization in the United States, Annu Rev Polit Sci, 22, 129, 10.1146/annurev-polisci-051117-073034 · DOI · Paper page
- S Amlani, 2021, Partisanship & nationalization in American elections: Evidence from presidential, senatorial, & gubernatorial elections in the US counties, 1872–2020, Electoral Studies, 73, 102387, 10.1016/j.electstud.2021.102387 · DOI
- AJ Stewart, 2020, Polarization under rising inequality and economic decline, Sci Adv, 6, 10.1126/sciadv.abd4201 · DOI
- H Chu, 2021, Not My Pandemic: Solution Aversion and the Polarized Public Perception of COVID-19, Science Communication, 43, 508, 10.1177/10755470211022020 · DOI
- SK Gadarian, 2021, Partisanship, health behavior, and policy attitudes in the early stages of the COVID-19 pandemic, PLoS One, 16, 10.1371/journal.pone.0249596 · DOI · Paper page
- JD Wu, Partisan differences in social distancing may originate in norms and beliefs: results from novel data, Social Science Quarterly
- A Gollwitzer, 2020, Partisan differences in physical distancing are linked to health outcomes during the COVID-19 pandemic, Nat Hum Behav, 4, 1186, 10.1038/s41562-020-00977-7 · DOI · Paper page
- H Allcott, 2020, Polarization and public health: Partisan differences in social distancing during the coronavirus pandemic, J Public Econ, 191, 104254, 10.1016/j.jpubeco.2020.104254 · DOI · Paper page
- LH Kahane, 2021, Politicizing the Mask: Political, Economic and Demographic Factors Affecting Mask Wearing Behavior in the USA, East Econ J, 47, 163, 10.1057/s41302-020-00186-0 · DOI
- M Milosh, 2021, Unmasking partisanship: Polarization undermines public response to collective risk, Journal of Public Economics, 204, 104538, 10.1016/j.jpubeco.2021.104538 · DOI
- A Fridman, 2021, COVID-19 and vaccine hesitancy: A longitudinal study, PLoS One, 16, 10.1371/journal.pone.0250123 · DOI
- JN Druckman, 2021, Affective polarization, local contexts and public opinion in America, Nature Human Behaviour, 5, 28, 10.1038/s41562-020-01012-5 · DOI · Paper page
- I Ojea Quintana, 2022, Polarization and trust in the evolution of vaccine discourse on Twitter during COVID-19, PLoS One, 17, 10.1371/journal.pone.0277292 · DOI
- COCONEL Group, 2020, The French public’s attitudes to a future COVID-19 vaccine: The politicization of a public health issue, Soc Sci Med, 265, 113414, 10.1016/j.socscimed.2020.113414 · DOI
- J Jiang, 2021, Social Media Polarization and Echo Chambers in the Context of COVID-19: Case Study, JMIRx Med, 2
- M Medeiros, 2023, Pandemic Populism: Explaining Support for the People’s Party of Canada in the 2021 Federal Election, Can J Pol Sci, 56, 413, 10.1017/S000842392300015X · DOI
- Pammett JH, Dornan C. The Canadian Federal Election. 2022. · DOI
- G Blouin Genest, 2021, Translating COVID-19 emergency plans into policy: A comparative analysis of three Canadian provinces, Policy Design and Practice, 1, 10.1080/25741292.2020.1868123 · DOI
- C Adolph, 2021, Pandemic Politics: Timing State-Level Social Distancing Responses to COVID-19, J Health Polit Policy Law, 46, 211, 10.1215/03616878-8802162 · DOI
- A Ashokkumar, 2021, Social media conversations reveal large psychological shifts caused by COVID-19’s onset across U.S. cities, Sci Adv, 7, 10.1126/sciadv.abg7843 · DOI
- JD Wu, 2021, Partisan Differences in Social Distancing May Originate in Norms and Beliefs: Results from Novel Data, Social Science Quarterly, 102, 2251, 10.1111/ssqu.12947 · DOI
- A Bridgman, 2020, The causes and consequences of COVID-19 misperceptions: Understanding the role of news and social media, HKS Misinfo Review
- J Jiang, 2020, Political polarization drives online conversations about COVID-19 in the United States, Hum Behav Emerg Technol, 2, 200, 10.1002/hbe2.202 · DOI
- R Gallotti, 2020, Assessing the risks of “infodemics” in response to COVID-19 epidemics, Nat Hum Behav, 4, 1285, 10.1038/s41562-020-00994-6 · DOI · Paper page
- J Lang, 2021, #MaskOn! #MaskOff! Digital polarization of mask-wearing in the United States during COVID-19, PLoS One, 16, 10.1371/journal.pone.0250817 · DOI
- CG Rodriguez, 2022, Morbid Polarization: Exposure to COVID-19 and Partisan Disagreement about Pandemic Response, Polit Psychol
- J Clinton, 2021, Partisan pandemic: How partisanship and public health concerns affect individuals’ social mobility during COVID-19, Sci Adv, 7, 10.1126/sciadv.abd7204 · DOI
- J Grimmer, 2013, Text as Data: The Promise and Pitfalls of Automatic Content Analysis Methods for Political Texts, Polit anal, 21, 267, 10.1093/pan/mps028 · DOI · Paper page
- Demszky D, Garg N, Voigt R, Zou J, Shapiro J, Gentzkow M, et al. In: Proceedings of the 2019 Conference of the North American Chapter of the Association for Computational Linguistics (NAACL), Minneapolis, USA, 2019. 2970–3005. · DOI · Paper page
- A Törnberg, 2016, Muslims in social media discourse: Combining topic modeling and critical discourse analysis, Discourse, Context & Media, 13, 132, 10.1016/j.dcm.2016.04.003 · DOI
- M Medeiros, 2014, The regional divide in Canadian public opinion, Canadian Journal of Political Science, 47, 247
- M Cinelli, 2021, The echo chamber effect on social media, Proc Natl Acad Sci U S A, 118, 10.1073/pnas.2023301118 · DOI · Paper page
- Zhang H, Deng L, Tiwari M, Yang D, Peng N. In: Findings of the Association for Computational Linguistics: EMNLP 2021, Punta Cana, Dominican Republic, 2021. 2075–86.
- Darwish K, Magdy W, Zanouda T. Quantifying polarization on Twitter: The role of party rhetoric and user engagement. In: Proceedings of the 14th International AAAI Conference on Web and Social Media (ICWSM), Atlanta, USA, 2020. 212–21. · DOI
- P Barberá, 2015, Birds of the Same Feather Tweet Together: Bayesian Ideal Point Estimation Using Twitter Data, Polit anal, 23, 76, 10.1093/pan/mpu011 · DOI · Paper page
- M Conover, 2021, Political Polarization on Twitter, ICWSM, 5, 89, 10.1609/icwsm.v5i1.14126 · DOI · Paper page
- M Stella, 2018, Influence of augmented humans in online interactions during voting events, Nature Communications, 9, 5511
- D Diermeier, 2012, Language and Ideology in Congress, British Journal of Political Science, 42, 31, 10.1017/S0007123411000160 · DOI
- LJ Hubert, 1976, A general statistical framework for assessing categorical clustering in free recall, Psychological Bulletin, 83, 1072, 10.1037/0033-2909.83.6.1072 · DOI
- P Wicke, 2020, Framing COVID-19: How we conceptualize and discuss the pandemic on Twitter, PLOS ONE, 15, 1, 10.1371/journal.pone.0240010 · DOI
- R Kouzy, 2020, Coronavirus goes viral: quantifying the COVID-19 misinformation epidemic on Twitter, Cureus, 12
- M Al-Ramahi, 2021, Public Discourse Against Masks in the COVID-19 Era: Infodemiology Study of Twitter Data, JMIR Public Health Surveill, 7, 10.2196/26780 · DOI
- W Ahmed, 2020, COVID-19 and the “Film Your Hospital” Conspiracy Theory: Social Network Analysis of Twitter Data, J Med Internet Res, 22, 10.2196/22374 · DOI
- GF Reed, 2002, Use of coefficient of variation in assessing variability of quantitative assays, Clin Diagn Lab Immunol, 9, 1235
- D Albrecht, 2022, Vaccination, politics and COVID-19 impacts, BMC Public Health, 22, 96, 10.1186/s12889-021-12432-x · DOI
- Leskovec J, Backstrom L, Kleinberg J. Meme-tracking and the dynamics of the news cycle. In: Proceedings of the 15th ACM SIGKDD international conference on Knowledge discovery and data mining, 2009. 497–506. https://doi.org/10.1145/1557019.1557077 · DOI
- C Algara, 2022, Nail in the coffin or lifeline? Evaluating the electoral impact of COVID-19 on President Trump in the 2020 election, Political Behavior
- X Jiang, 2021, Polarization Over Vaccination: Ideological Differences in Twitter Expression About COVID-19 Vaccine Favorability and Specific Hesitancy Concerns, Social Media + Society, 7, 10.1177/20563051211048413 · DOI
- S Rathje, 2022, Social media behavior is associated with vaccine hesitancy, PNAS Nexus, 1, 10.1093/pnasnexus/pgac207 · DOI · Paper page
- TJ Bollyky, 2023, Assessing COVID-19 pandemic policies and behaviours and their economic and educational trade-offs across US states from Jan 1, 2020, to July 31, 2022: an observational analysis, The Lancet, 401, 1341, 10.1016/S0140-6736(23)00461-0 · DOI
- A Rao, 2020, Political partisanship and anti-science attitudes in online discussions about Covid-19. arXiv preprint
- DS Morris, 2021, Polarization, partisanship, and pandemic: The relationship between county-level support for Donald Trump and the spread of Covid-19 during the spring and summer of 2020, Soc Sci Q, 102, 2412, 10.1111/ssqu.13053 · DOI
- NJ Sehgal, 2022, The association between COVID-19 mortality and the county-level partisan divide in the United States: study examines the association between COVID-19 mortality and county-level political party affiliation, Health Affairs, 41, 853, 10.1377/hlthaff.2022.00085 · DOI
- J Kaashoek, 2022, The evolving roles of US political partisanship and social vulnerability in the COVID-19 pandemic from February 2020-February 2021, PLOS Glob Public Health, 2, 10.1371/journal.pgph.0000557 · DOI
- ND Goldstein, 2021, Application of state law in the public health emergency response to COVID-19: an example from Delaware in the United States, J Public Health Policy, 42, 167, 10.1057/s41271-020-00257-8 · DOI
- C Adolph, 2021, Governor Partisanship Explains the Adoption of Statewide Mask Mandates in Response to COVID-19, State Politics Policy Q, 22, 24, 10.1017/spq.2021.22 · DOI
- G Grossman, 2020, Political partisanship influences behavioral responses to governors’ recommendations for COVID-19 prevention in the United States, Proc Natl Acad Sci U S A, 117, 24144, 10.1073/pnas.2007835117 · DOI
- MK Gusmano, 2020, Partisanship in Initial State Responses to the COVID‐19 Pandemic, World Med & Health Policy, 12, 380, 10.1002/wmh3.372 · DOI
- KM Douglas, 2019, Understanding Conspiracy Theories, Political Psychology, 40, 3, 10.1111/pops.12568 · DOI · Paper page
- X Ye, 2023, Exploring the relationship between political partisanship and COVID-19 vaccination rate, J Public Health (Oxf), 45, 91, 10.1093/pubmed/fdab364 · DOI
- CA Latkin, 2021, Trust in a COVID-19 vaccine in the U.S.: A social-ecological perspective, Soc Sci Med, 270, 113684, 10.1016/j.socscimed.2021.113684 · DOI
- G Pennycook, 2022, Beliefs About COVID-19 in Canada, the United Kingdom, and the United States: A Novel Test of Political Polarization and Motivated Reasoning, Pers Soc Psychol Bull, 48, 750, 10.1177/01461672211023652 · DOI
- A Akanteva, 2023, Canadian Covid-19 pandemic public health mitigation measures at the province level, Sci Data, 10, 882, 10.1038/s41597-023-02759-y · DOI
- È Dubé, 2021, COVID-19 vaccination attitudes and intention among Quebecers during the first and second waves of the pandemic: findings from repeated cross-sectional surveys, Hum Vaccin Immunother, 17, 3922, 10.1080/21645515.2021.1947096 · DOI
- E Shim, 2021, Regional Variability in COVID-19 Case Fatality Rate in Canada, February-December 2020, Int J Environ Res Public Health, 18, 1839, 10.3390/ijerph18041839 · DOI
- Chaput M. Figures de l’identité anti-masque et rhétorique de l’organisationnalité. Communication & Organisation. 2021;:107–20. · DOI
- J-C Boucher, 2021, Analyzing Social Media to Explore the Attitudes and Behaviors Following the Announcement of Successful COVID-19 Vaccine Trials: Infodemiology Study, JMIR Infodemiology, 1
- KE Burns, 2024, Examining vaccine hesitancy among a diverse sample of Canadian adults, Vaccine, 42, 129, 10.1016/j.vaccine.2023.12.030 · DOI
- JJ Van Bavel, 2021, How social media shapes polarization, Trends Cogn Sci, 25, 913, 10.1016/j.tics.2021.07.013 · DOI · Paper page
- A Karaivanov, 2022, COVID-19 vaccination mandates and vaccine uptake, Nat Hum Behav, 6, 1615, 10.1038/s41562-022-01363-1 · DOI
- M Mansoor, 2021, Citizens’ trust in government as a function of good governance and government agency’s provision of quality information on social media during COVID-19, Gov Inf Q, 38, 101597, 10.1016/j.giq.2021.101597 · DOI
- Hetherington MJ, Rudolph TJ. Political trust and polarization. 2017. · DOI
- CA Makridis, 2021, How social capital helps communities weather the COVID-19 pandemic, PLoS One, 16, 10.1371/journal.pone.0245135 · DOI
- E Merkley, 2020, A rare moment of cross-partisan consensus: Elite and public response to the COVID-19 pandemic in Canada, Can J Polit Sci, 53, 311, 10.1017/S0008423920000311 · DOI
Metadata
- Authors
- Yang, Z., Imouza, A., Puelma Touzel, M., Amadoro, C., Desrosiers-Brisebois, G., Pelrine, K., Levy, S., Godbout, J.-F., & Rabbany, R.
- Affiliations
- Mila - Quebec Artificial Intelligence Institute (CA)
- McGill University (CA)
- Corresponding author
- Yang, Zachary
- Venue
- PLOS One
- Publisher
- Public Library of Science (PLoS)
- Published
- 2026-04-20
- Volume
- 21
- Issue
- 4
- Pages
- e0347327
- ISSN
- 1932-6203 (ISSN-L)
- PMC
- PMC13095112
- OpenAlex
- W4400375943
- Cited by
- 1
- References
- 0
- FWCI
- 0.00
- Type
- journal article
- Language
- en
- Open access
- gold
- doi.org
- Licence
- Locations
- PLoS ONE (publishedVersion, cc-by)
- PubMed (publishedVersion)
- PubMed Central (publishedVersion, cc-by)
- arXiv (Cornell University) (submittedVersion, cc-by-sa)
- DOAJ (DOAJ: Directory of Open Access Journals) (submittedVersion, cc-by-sa)
- DOAJ (DOAJ: Directory of Open Access Journals) (submittedVersion)
- arXiv (Cornell University)
- Funders
- CIFAR AI Catalyst Grant (Being politic smart in the age of misinformation)
- CIFAR AI Research Chair
- Topics
- Social Sciences › Communication › Social Media and Politics
- Social Sciences › Sociology and Political Science › Misinformation and Its Impacts
- Social Sciences › Communication › Communication and COVID-19 Impact
- Keywords
- partisan polarization, COVID-19 pandemic, Twitter discourse, public health policy debate, lockdown, face masks, COVID-19 vaccines, regional variation, vaccination coverage, cross-national comparison, United States, Canada, online political discourse
- MeSH terms
- COVID-19, SARS-CoV-2, Canada, Humans, Politics, Public Health, United States, Pandemics, Social Media
About these checks
Registry, retraction, Cites and statistics results are computed, not judged, with one exception: a printed reference that no index lists is read once by a model before it counts as a citation error. Claims are extracted by a model and kept only when their quote appears verbatim in the text; each cited source is then checked, with a model’s help, for whether it says what the claim relies on. Those verdicts can be wrong — read the claim’s quote and the cited source before relying on one.
Statistics and arithmetic are recomputed, not judged.
Confidence bands are shown only for fields calibrated on our annotated test set. None is calibrated yet, so no band is shown.
What counts as a claim ›How we measure confidence ›How we check this ›
Are you an author, or do you see a problem with this page? Request a review
How to cite
Cite CoChat for the checks on this page, and the paper for its own findings.
- This page
- CoChat. (2026). Citation check: Regional and temporal patterns of partisan polarization during the COVID-19 pandemic in the United States and Canada. https://app.cochat.ai/papers/10.1371/journal.pone.0347327
- The paper
- Yang, Z., Imouza, A., Puelma Touzel, M., Amadoro, C., Desrosiers-Brisebois, G., Pelrine, K., Levy, S., Godbout, J.-F., & Rabbany, R. (2026). Regional and temporal patterns of partisan polarization during the COVID-19 pandemic in the United States and Canada. PLOS One. https://doi.org/10.1371/journal.pone.0347327
