Cited by 207Influenza Virus Research StudiesProtease and Inhibitor MechanismsNeutrophil, Myeloperoxidase and Oxidative Mechanisms

The DOI matches its Crossref record; 45 of the 45 references it cites were found in a registry or an index.

Matrix Metalloprotease 9 Mediates Neutrophil Migration into the Airways in Response to Influenza Virus-Induced Toll-Like Receptor Signaling

Open access

Abstract

The early inflammatory response to influenza virus infection contributes to severe lung disease and continues to pose a serious threat to human health. The mechanisms by which neutrophils gain entry to the respiratory tract and their role during pathogenesis remain unclear. Here, we report that neutrophils significantly contributed to morbidity in a pathological mouse model of influenza virus infection. Using extensive immunohistochemistry, bone marrow transfers, and depletion studies, we identified neutrophils as the predominant pulmonary cellular source of the gelatinase matrix metalloprotease (MMP) 9, which is capable of digesting the extracellular matrix. Furthermore, infection of MMP9-deficient mice showed that MMP9 was functionally required for neutrophil migration and control of viral replication in the respiratory tract. Although MMP9 release was toll-like receptor (TLR) signaling-dependent, MyD88-mediated signals in non-hematopoietic cells, rather than neutrophil TLRs themselves, were important for neutrophil migration. These results were extended using multiplex analyses of inflammatory mediators to show that neutrophil chemotactic factor, CCL3, and TNFα were reduced in the Myd88⁻/⁻ airways. Furthermore, TNFα induced MMP9 secretion by neutrophils and blocking TNFα in vivo reduced neutrophil recruitment after infection. Innate recognition of influenza virus therefore provides the mechanisms to induce recruitment of neutrophils through chemokines and to enable their motility within the tissue via MMP9-mediated cleavage of the basement membrane. Our results demonstrate a previously unknown contribution of MMP9 to influenza virus pathogenesis by mediating excessive neutrophil migration into the respiratory tract in response to viral replication that could be exploited for therapeutic purposes.

Overview

The claims and statistics of this paper haven’t been checked yet.

Run the check — free, no account needed. It reads the open-access text and checks the sources it cites.

A few free checks a day · papers already verified open instantly · results are public

Integrity signals

Registry

Crossref · 10.1371/journal.ppat.1002641

Cites

45 of 45 references verified0 citation errors · 0 not checkable

Statistics

Figures

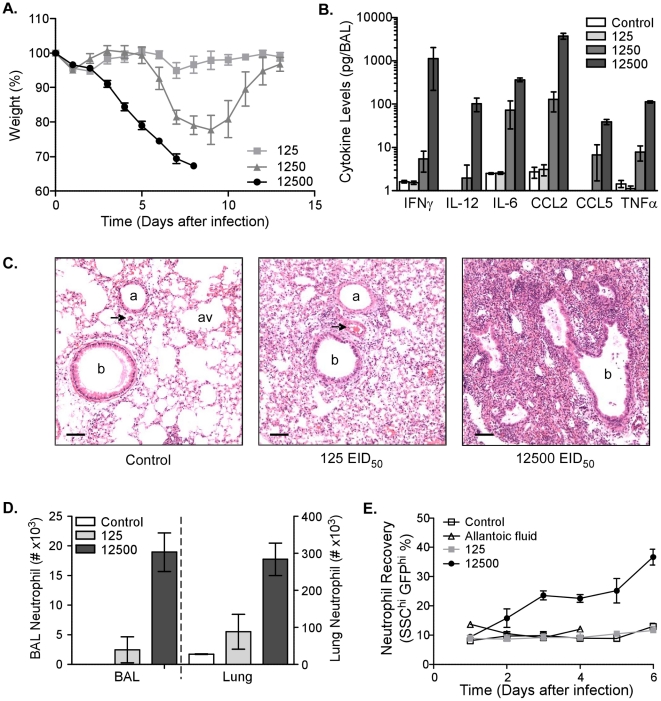
Figure 1 Morbidity, inflammation, and neutrophil number are increased after infection with high dose influenza virus. (A) Kinetics of weight loss as a percentage of starting weight in C57BL/6 mice infected i.n. with 125 (light-grey squares), 1250 (dark-grey triangles), or 12500 (black circles) EID50 PR8 virus. Mean ± SEM (n = 5, representative of four independent experiments). (B) Cytokine and chemokine levels in the BAL of uninfected mice (‘control’, clear bars) or mice infected 6 days earlier with 125 (light-grey bars), 1250 (grey bars), or 12500 (dark-grey bars) EID50 PR8 virus. Mean ± SEM (n = 3–4, representative of two independent experiments). (C) Histological examination of uninfected lungs (control, left) or lungs 6 days after infection with 125 (middle) or 12500 (right) EID50 PR8 virus. Perfused lungs were fixed in formalin and stained for hematoxylin and eosin (scalebar = 100 µm). Images are representative of multiple mice. b. bronchiole, a. arteriole, av. alveole, and arrowhead. venule. (D) Neutrophil numbers in the BAL and lung of uninfected mice (‘control’, clear bars) or mice infected 6 days earlier with 125 (light-grey bars) or 12500 (dark-grey bars) EID50 PR8 virus. Mean ± SEM (n = 3, representative of two independent experiments). (E) The percentage of blood neutrophils from LysM-GFP mice infected with 125 (light-grey squares) or 12500 (black circles) EID50 PR8 virus compared to control (PBS, open squares) or allantoic fluid at the same dilution as the highest viral dose (open triangles). Mean ± SEM (n = 4–5).
Figure 1 Morbidity, inflammation, and neutrophil number are increased after infection with high dose influenza virus. (A) Kinetics of weight loss as a percentage of starting weight in C57BL/6 mice infected i.n. with 125 (light-grey squares), 1250 (dark-grey triangles), or 12500 (black circles) EID50 PR8 virus. Mean ± SEM (n = 5, representative of four independent experiments). (B) Cytokine and chemokine levels in the BAL of uninfected mice (‘control’, clear bars) or mice infected 6 days earlier with 125 (light-grey bars), 1250 (grey bars), or 12500 (dark-grey bars) EID50 PR8 virus. Mean ± SEM (n = 3–4, representative of two independent experiments). (C) Histological examination of uninfected lungs (control, left) or lungs 6 days after infection with 125 (middle) or 12500 (right) EID50 PR8 virus. Perfused lungs were fixed in formalin and stained for hematoxylin and eosin (scalebar = 100 µm). Images are representative of multiple mice. b. bronchiole, a. arteriole, av. alveole, and arrowhead. venule. (D) Neutrophil numbers in the BAL and lung of uninfected mice (‘control’, clear bars) or mice infected 6 days earlier with 125 (light-grey bars) or 12500 (dark-grey bars) EID50 PR8 virus. Mean ± SEM (n = 3, representative of two independent experiments). (E) The percentage of blood neutrophils from LysM-GFP mice infected with 125 (light-grey squares) or 12500 (black circles) EID50 PR8 virus compared to control (PBS, open squares) or allantoic fluid at the same dilution as the highest viral dose (open triangles). Mean ± SEM (n = 4–5).CC BY · PubMed Central
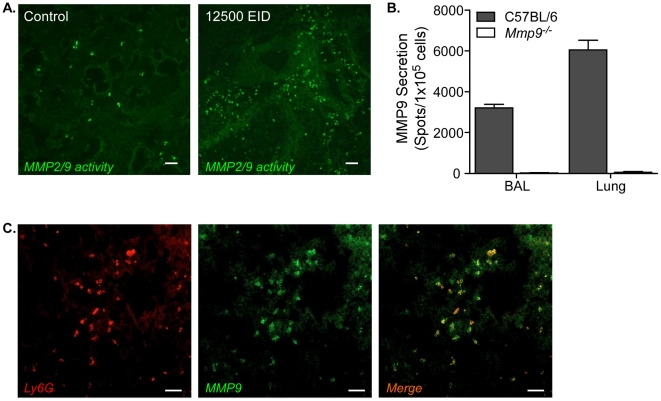
Figure 2 MMP9 is produced by neutrophils after infection. (A) MMP2/9 activity in lungs of uninfected control mice (left panel) or those 6 days after infection (right panel). Gelatinase activity was measured by in situ zymogram and visualized by green fluorescence after enzymatic cleavage to release fluorochrome from a quencher (scalebar = 50 µm). Images are representative of multiple mice. (B) MMP9 secretion by cells from BAL and lung from Ly5.1 recipient mice that received BM from either Mmp9 −/− (clear bars) or C57BL/6 (grey bars) donors was measured by ELISPOT. Mean ± SEM (n = 5–7, representative of two independent experiments). (C) Ly6G+ lung neutrophils (red) and MMP9+ cells (green), and their colocalization (merge, right panel) were visualized by immunofluorescence of infected lung 6 days after infection (scalebar = 50 µm). Images are representative of multiple mice.
Figure 2 MMP9 is produced by neutrophils after infection. (A) MMP2/9 activity in lungs of uninfected control mice (left panel) or those 6 days after infection (right panel). Gelatinase activity was measured by in situ zymogram and visualized by green fluorescence after enzymatic cleavage to release fluorochrome from a quencher (scalebar = 50 µm). Images are representative of multiple mice. (B) MMP9 secretion by cells from BAL and lung from Ly5.1 recipient mice that received BM from either Mmp9 −/− (clear bars) or C57BL/6 (grey bars) donors was measured by ELISPOT. Mean ± SEM (n = 5–7, representative of two independent experiments). (C) Ly6G+ lung neutrophils (red) and MMP9+ cells (green), and their colocalization (merge, right panel) were visualized by immunofluorescence of infected lung 6 days after infection (scalebar = 50 µm). Images are representative of multiple mice.CC BY · PubMed Central
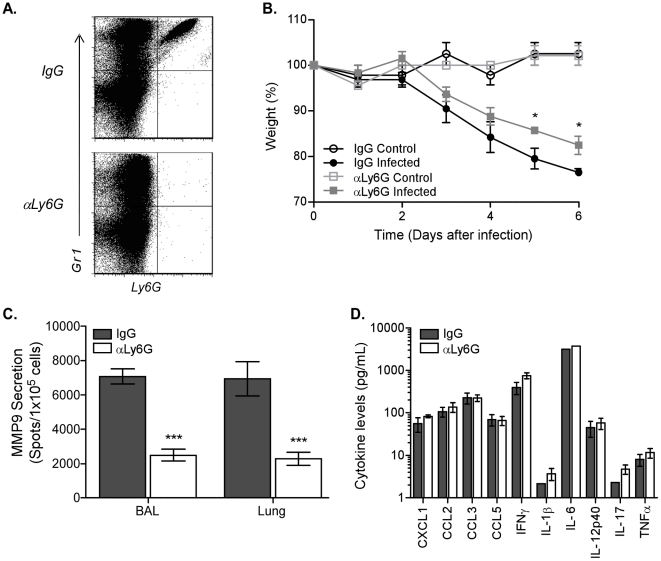
Figure 3 Depletion of neutrophils abrogates MMP9 secretion after influenza virus infection. Neutrophils were depleted by injecting C57BL/6 mice with 400 µg anti-Ly6G antibody (αLy6G) or isotype control (IgG) one day before infection and every other day thereafter. (A) Depletion of Ly6G+ cells in αLy6G-treated C57BL/6 mice (bottom panel) compared to IgG (top panel) was verified by flow cytometric analysis 6 days after infection. (B) Kinetics of weight loss as a percentage of starting weight in uninfected (control, open symbols) and infected (closed symbols) mice treated with the αLy6G (squares) or IgG isotype (circles). (C) MMP9 secretion by cells from BAL and lung from infected mice that were treated with αLy6G (clear bars) or IgG isotype (grey bars) was measured by ELISPOT. (D) Inflammatory cytokine release in airways after neutrophil depletion. BALs were collected 6 days after infection and supernatants assayed by bead array. (B–D) Mean ± SEM (n = 3, representative of two independent experiments). (B–C) Considered significant at *P<0.05, ***P<0.001.
Figure 3 Depletion of neutrophils abrogates MMP9 secretion after influenza virus infection. Neutrophils were depleted by injecting C57BL/6 mice with 400 µg anti-Ly6G antibody (αLy6G) or isotype control (IgG) one day before infection and every other day thereafter. (A) Depletion of Ly6G+ cells in αLy6G-treated C57BL/6 mice (bottom panel) compared to IgG (top panel) was verified by flow cytometric analysis 6 days after infection. (B) Kinetics of weight loss as a percentage of starting weight in uninfected (control, open symbols) and infected (closed symbols) mice treated with the αLy6G (squares) or IgG isotype (circles). (C) MMP9 secretion by cells from BAL and lung from infected mice that were treated with αLy6G (clear bars) or IgG isotype (grey bars) was measured by ELISPOT. (D) Inflammatory cytokine release in airways after neutrophil depletion. BALs were collected 6 days after infection and supernatants assayed by bead array. (B–D) Mean ± SEM (n = 3, representative of two independent experiments). (B–C) Considered significant at *P<0.05, ***P<0.001.CC BY · PubMed Central
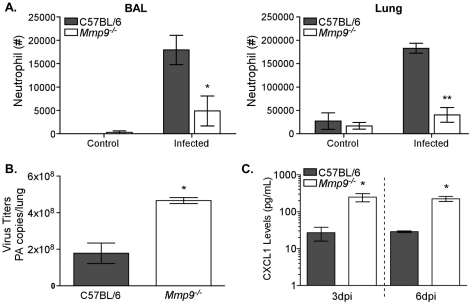
Figure 4 Neutrophils require MMP9 to migrate to the respiratory tract. (A) Neutrophil numbers in the BAL (left panel) and lung (right panel) were enumerated by flow cytometry 3 days after infection of C57BL/6 mice or Mmp9 −/− mice. Control mice were not infected. Mean recovery numbers per lung ± SEM (n = 3–4, representative of three independent experiments). (B) Viral load was enumerated in left lung lobe by quantitative RT-PCR for the influenza PA gene 3 days after infection. Mean PA copies/lung ± SEM (n = 4). (C) Chemokine levels in airways of Mmp9 −/− mice after infection. BALs were collected 3 and 6 days after infection and supernatants assayed for CXCL1 by bead array. Mean ± SEM (n = 4, representative of two independent experiments). (A–C) Considered significant at *P<0.05, **P<0.01.
Figure 4 Neutrophils require MMP9 to migrate to the respiratory tract. (A) Neutrophil numbers in the BAL (left panel) and lung (right panel) were enumerated by flow cytometry 3 days after infection of C57BL/6 mice or Mmp9 −/− mice. Control mice were not infected. Mean recovery numbers per lung ± SEM (n = 3–4, representative of three independent experiments). (B) Viral load was enumerated in left lung lobe by quantitative RT-PCR for the influenza PA gene 3 days after infection. Mean PA copies/lung ± SEM (n = 4). (C) Chemokine levels in airways of Mmp9 −/− mice after infection. BALs were collected 3 and 6 days after infection and supernatants assayed for CXCL1 by bead array. Mean ± SEM (n = 4, representative of two independent experiments). (A–C) Considered significant at *P<0.05, **P<0.01.CC BY · PubMed Central
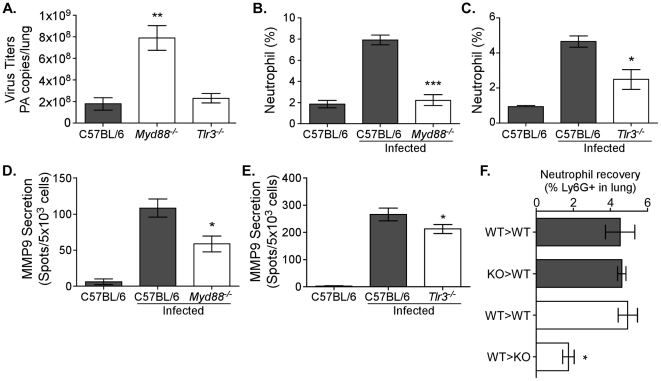
Figure 5 Neutrophil recruitment, MMP9 secretion, and viral load are TLR-dependent. Neutrophil numbers and MMP9 secretion are decreased in TLR-deficient mice. (A–E) C57BL/6 (grey bars), Myd88 −/−, and Tlr3 −/− (both clear bars) mice were infected with 12500 EID50 PR8. (A) The viral load was enumerated in left lung lobes of C57BL/6, Myd88 −/−, and Tlr3 −/− mice by quantitative RT-PCR for the influenza PA gene 3 days after infection. Mean PA copies/lung ± SEM (n = 4, representative of two independent experiments). (B, C) The percentage of neutrophils in lungs of Myd88 −/− and Tlr3 −/− mice, respectively, were enumerated by flow cytometry 6 days after infection. (D, E) The number of cells secreting MMP9 in the airways of mice deficient in TLR signaling. MMP9 ELISPOT analysis of BALs from (D) Myd88 −/− or (E) Tlr3 −/− mice. Mean ± SEM (n = 4–5, representative of two independent experiments). (F) Neutrophil recoveries in lung 3 days after infection of mice receiving bone marrow transfer. The percentage of neutrophils after transfer of C57BL/6 (WT>WT) or Myd88 −/− (KO>WT) bone marrow into Ly5.1 congenic mice (grey bars) or after transfer of Ly5.1 bone marrow cells into Ly5.2+ C57BL/6 (WT>WT) or Myd88 −/− (WT>KO) recipients (clear bars) is shown. (A–E) Mean ± SEM (n = 3, representative of two independent experiments). (A–F) Considered significant at *P<0.05, **P<0.01, ***P<0.001.
Figure 5 Neutrophil recruitment, MMP9 secretion, and viral load are TLR-dependent. Neutrophil numbers and MMP9 secretion are decreased in TLR-deficient mice. (A–E) C57BL/6 (grey bars), Myd88 −/−, and Tlr3 −/− (both clear bars) mice were infected with 12500 EID50 PR8. (A) The viral load was enumerated in left lung lobes of C57BL/6, Myd88 −/−, and Tlr3 −/− mice by quantitative RT-PCR for the influenza PA gene 3 days after infection. Mean PA copies/lung ± SEM (n = 4, representative of two independent experiments). (B, C) The percentage of neutrophils in lungs of Myd88 −/− and Tlr3 −/− mice, respectively, were enumerated by flow cytometry 6 days after infection. (D, E) The number of cells secreting MMP9 in the airways of mice deficient in TLR signaling. MMP9 ELISPOT analysis of BALs from (D) Myd88 −/− or (E) Tlr3 −/− mice. Mean ± SEM (n = 4–5, representative of two independent experiments). (F) Neutrophil recoveries in lung 3 days after infection of mice receiving bone marrow transfer. The percentage of neutrophils after transfer of C57BL/6 (WT>WT) or Myd88 −/− (KO>WT) bone marrow into Ly5.1 congenic mice (grey bars) or after transfer of Ly5.1 bone marrow cells into Ly5.2+ C57BL/6 (WT>WT) or Myd88 −/− (WT>KO) recipients (clear bars) is shown. (A–E) Mean ± SEM (n = 3, representative of two independent experiments). (A–F) Considered significant at *P<0.05, **P<0.01, ***P<0.001.CC BY · PubMed Central
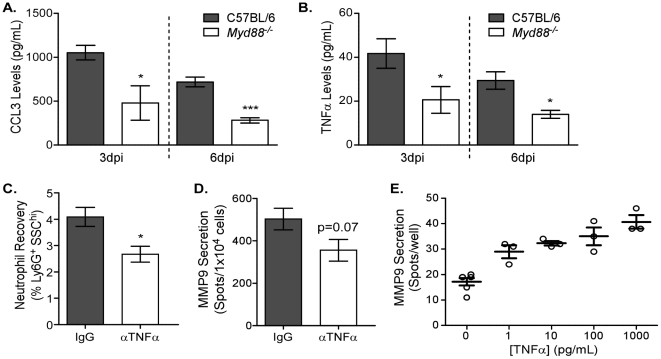
Figure 6 MyD88-dependent TNFα expression induces MMP9 in neutrophils. (A–B) BALs of C57BL/6 (grey bars) and Myd88 −/− (clear bars) mice infected 3 or 6 days earlier were analyzed by bead array. Airway levels of (A) CCL3 and (B) TNFα. Mean ± SEM (n = 3, representative of two independent experiments). (C–D) TNFα function was blocked by injecting C57BL/6 mice with 200 µg anti-TNFα (αTNFα, clear bars) or IgG isotype (IgG, grey bars) daily starting one day before infection. (C) The percentage of neutrophils in lungs of antibody-treated mice was enumerated using flow cytometry 3 days after infection. (D) The number of cells secreting MMP9 in the lungs was assessed by ELISPOT 3 days after infection. Mean ± SEM (n = 5, representative of two independent experiments). (E) Neutrophils were negatively enriched from the bone marrow of C57BL/6 mice and stimulated with different doses of recombinant TNFα for 6 hours. MMP9 expression during the 6 hour incubation was assessed by ELISPOT (n = 3, representative of two independent experiments). (A–C) Considered significant at *P<0.05, **P<0.01, ***P<0.001.
Figure 6 MyD88-dependent TNFα expression induces MMP9 in neutrophils. (A–B) BALs of C57BL/6 (grey bars) and Myd88 −/− (clear bars) mice infected 3 or 6 days earlier were analyzed by bead array. Airway levels of (A) CCL3 and (B) TNFα. Mean ± SEM (n = 3, representative of two independent experiments). (C–D) TNFα function was blocked by injecting C57BL/6 mice with 200 µg anti-TNFα (αTNFα, clear bars) or IgG isotype (IgG, grey bars) daily starting one day before infection. (C) The percentage of neutrophils in lungs of antibody-treated mice was enumerated using flow cytometry 3 days after infection. (D) The number of cells secreting MMP9 in the lungs was assessed by ELISPOT 3 days after infection. Mean ± SEM (n = 5, representative of two independent experiments). (E) Neutrophils were negatively enriched from the bone marrow of C57BL/6 mice and stimulated with different doses of recombinant TNFα for 6 hours. MMP9 expression during the 6 hour incubation was assessed by ELISPOT (n = 3, representative of two independent experiments). (A–C) Considered significant at *P<0.05, **P<0.01, ***P<0.001.CC BY · PubMed Central

Verification

Claims the paper makes

The claims and statistics of this paper haven’t been checked yet.

Run the check — free, no account needed. It reads the open-access text and checks the sources it cites.

A few free checks a day · papers already verified open instantly · results are public

Claims other papers make about this one

Each is checked against this paper’s own text: does it say what the citing paper says it does?

Self-check

Percentages, sums and reported differences re-computed from the paper’s own numbers.

The self-check needs the paper’s full text.

Citations

Cites

Show all 45 references

Cited by

Sorted by citations

See all 207

Metadata

Authors
Bradley, L. M., Douglass, M. F., Chatterjee, D., Akira, S., & Baaten, B. J. G.
Affiliations
  • Sanford Burnham Prebys Medical Discovery Institute (US)
  • Immunology Frontier Research Center, The University of Osaka (JP)
Corresponding author
Baaten, Bas J. G.
Venue
PLoS Pathogens
Published
2012-04-05
Volume
8
Issue
4
Pages
e1002641
ISSN
  • 1553-7366 (ISSN-L)
  • 1553-7374
OpenAlex
W2014693052
Cited by
207
References
45
Citations by year
2026: 6 · 2025: 13 · 2024: 17 · 2023: 17 · 2022: 14 · 2021: 18 · 2020: 23 · 2019: 12 · 2018: 8 · 2017: 12 · 2016: 17 · 2015: 18 · 2014: 16 · 2013: 15 · 2012: 1
FWCI
11.97
Type
journal article
Language
en
Open access
Locations
  • PLoS Pathogens (publishedVersion, cc-by)
  • PubMed Central (publishedVersion, cc-by)
  • PubMed (publishedVersion)
  • DOAJ (DOAJ: Directory of Open Access Journals) (submittedVersion, cc-by-sa)
  • Figshare (submittedVersion, cc-by)
Funders
  • National Institutes of Health
  • National Institute on Aging (R01AG040188, AG040188)
  • National Institute of Allergy and Infectious Diseases (P01AI046530, R21AI079584, AI079584)
Topics
  • Health Sciences › Medicine › Epidemiology › Influenza Virus Research Studies
  • Life Sciences › Biochemistry, Genetics and Molecular Biology › Cancer Research › Protease and Inhibitor Mechanisms
  • Life Sciences › Immunology and Microbiology › Immunology › Neutrophil, Myeloperoxidase and Oxidative Mechanisms
Keywords
MMP-9, neutrophil migration, influenza virus, Toll-like receptor signaling, MyD88, TNF-α, CCL3, basement membrane degradation, extracellular matrix, airway inflammation, viral replication, innate immunity, chemokines
MeSH terms
Animals, Cell Movement, Extracellular Matrix, Humans, Neutrophils, Orthomyxoviridae Infections, Respiratory System, Virus Replication, Signal Transduction, Mice, Knockout, Chemokines, Neutrophil Infiltration, Matrix Metalloproteinase 9, Toll-Like Receptors, Mice, Influenza A Virus, H1N1 Subtype, Myeloid Differentiation Factor 88

About these checks

Registry, retraction, Cites and statistics results are computed, not judged, with one exception: a printed reference that no index lists is read once by a model before it counts as a citation error. Claims are extracted by a model and kept only when their quote appears verbatim in the text; each cited source is then checked, with a model’s help, for whether it says what the claim relies on. Those verdicts can be wrong — read the claim’s quote and the cited source before relying on one.

Statistics and arithmetic are recomputed, not judged.

Confidence bands are shown only for fields calibrated on our annotated test set. None is calibrated yet, so no band is shown.

What counts as a claim ›How we measure confidence ›How we check this ›

Are you an author, or do you see a problem with this page? Request a review