

Two-Component System Cross-Regulation Integrates Bacillus anthracis Response to Heme and Cell Envelope Stress
Open accessThe DOI matches its Crossref record; 56 of the 57 references it cites were found in a registry or an index.
Abstract
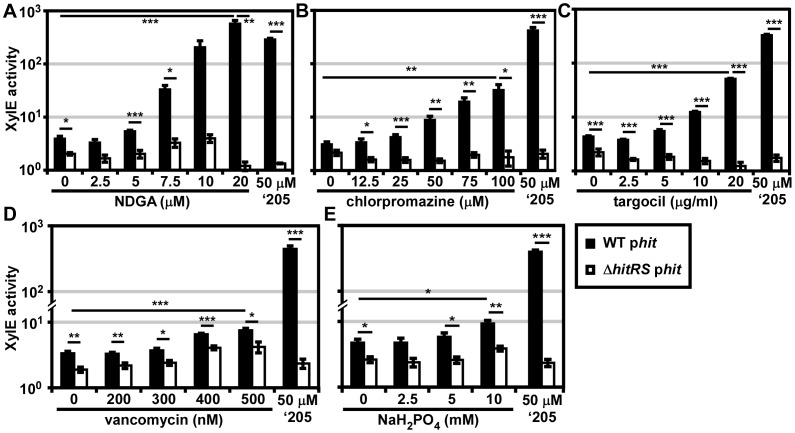
Two-component signaling systems (TCSs) are one of the mechanisms that bacteria employ to sense and adapt to changes in the environment. A prototypical TCS functions as a phosphorelay from a membrane-bound sensor histidine kinase (HK) to a cytoplasmic response regulator (RR) that controls target gene expression. Despite significant homology in the signaling domains of HKs and RRs, TCSs are thought to typically function as linear systems with little to no cross-talk between non-cognate HK-RR pairs. Here we have identified several cell envelope acting compounds that stimulate a previously uncharacterized Bacillus anthracis TCS. Furthermore, this TCS cross-signals with the heme sensing TCS HssRS; therefore, we have named it HssRS interfacing TCS (HitRS). HssRS reciprocates cross-talk to HitRS, suggesting a link between heme toxicity and cell envelope stress. The signaling between HssRS and HitRS occurs in the parental B. anthracis strain; therefore, we classify HssRS-HitRS interactions as cross-regulation. Cross-talk between HssRS and HitRS occurs at both HK-RR and post-RR signaling junctions. Finally, HitRS also regulates a previously unstudied ABC transporter implicating this transporter in the response to cell envelope stress. This chemical biology approach to probing TCS signaling provides a new model for understanding how bacterial signaling networks are integrated to enable adaptation to complex environments such as those encountered during colonization of the vertebrate host.
Overview
The claims and statistics of this paper haven’t been checked yet.
Free: it reads the open-access text and checks the first 5 claims that cite a source we can check. Create a free account to check every claim.
Integrity signals
Registry
Cites
Statistics
Figures



Verification
Claims the paper makes
The claims and statistics of this paper haven’t been checked yet.
Free: it reads the open-access text and checks the first 5 claims that cite a source we can check. Create a free account to check every claim.
Claims other papers make about this one
Each is checked against this paper’s own text: does it say what the citing paper says it does?
In the citing paper
“In B. anthracis, an HssRS orthologue controls the expression of HrtAB and cross-talks with a second TCS that responds to cellular envelope stresses”
From Heme Synthesis and Acquisition in Bacterial Pathogens (2016) · cites this paper as [238]
In the citing paper
“further implicating membrane damage as a component of heme stress [238].”
From Heme Synthesis and Acquisition in Bacterial Pathogens (2016) · cites this paper as [238]
Self-check
Percentages, sums and reported differences re-computed from the paper’s own numbers.
The self-check needs the paper’s full text.
Citations
Cites
Two-Component Signal Transduction
Stock, A. M., Robinson, V. L., & Goudreau, P. N. (2000) · Annual Review of Biochemistry · doi:10.1146/annurev.biochem.69.1.183 · Cited by 3,650
Gene Splicing by Overlap Extension: Tailor-Made Genes Using the Polymerase Chain Reaction
Horton, R. M., Cai, Z., Ho, S. N., & Pease, L. R. (2013) · BioTechniques · doi:10.2144/000114017 · Cited by 1,289 · cited 2×
“PCR-SOE DNA was digested with BamHI and EcoRI and ligated into pOS1.”
Specificity in Two-Component Signal Transduction Pathways
Laub, M. T., & Goulian, M. (2007) · Annual Review of Genetics · doi:10.1146/annurev.genet.41.042007.170548 · Cited by 748 · cited 7×
“This ‘cross-talk’ has been previously defined as the ‘‘communication between two pathways that, if eliminated, would leave intact two distinct, functioning pathways’’ [3].”
InfluentialSorting of protein a to the staphylococcal cell wall
Schneewind, O., Model, P., & Fischetti, V. A. (1992) · Cell · doi:10.1016/0092-8674(92)90101-h · Cited by 552
Rewiring the Specificity of Two-Component Signal Transduction Systems
Skerker, J. M., Perchuk, B. S., Siryaporn, A., Lubin, E. A., Ashenberg, O., Goulian, M., & Laub, M. T. (2008) · Cell · doi:10.1016/j.cell.2008.04.040 · Cited by 463
Iron-Source Preference of Staphylococcus aureus Infections
Skaar, E. P., Humayun, M., Bae, T., DeBord, K. L., & Schneewind, O. (2004) · Science · doi:10.1126/science.1099930 · Cited by 440 · cited 1×
“heme allows it to accumulate in membranes [42,43].”
Self-citationSkerker, J. M., Prasol, M. S., Perchuk, B. S., Biondi, E. G., & Laub, M. T. (2005) · PLoS Biology · doi:10.1371/journal.pbio.0030334 · Cited by 435
Gunn, J. S., & Miller, S. I. (1996) · Journal of Bacteriology · doi:10.1128/jb.178.23.6857-6864.1996 · Cited by 409 · cited 1×
“Alternatively, a protein product regulated by a RR may itself be a transcriptional regulator or phosphatase that impinges on the regulatory outputs of other TCSs [3,24,25,26].”
Multiple histidine kinases regulate entry into stationary phase and sporulation in Bacillus subtilis
Jiang, M., Shao, W., Perego, M., & Hoch, J. A. (2000) · Molecular Microbiology · doi:10.1046/j.1365-2958.2000.02148.x · Cited by 400
Goodman, A. L., Merighi, M., Hyodo, M., Ventre, I., Filloux, A., & Lory, S. (2009) · Genes & Development · doi:10.1101/gad.1739009 · Cited by 325 · cited 1×
“Even before an HK phosphorylates its cognate RR, interactions between HKs of individual TCSs can impact HK phosphorylation status and the downstream signaling cascade [18].”
Cited by
Heme Synthesis and Acquisition in Bacterial Pathogens
Choby, J. E., & Skaar, E. P. (2016) · Journal of Molecular Biology · doi:10.1016/j.jmb.2016.03.018 · Cited by 343
Self-citationMultikinase Networks: Two-Component Signaling Networks Integrating Multiple Stimuli
Francis, V. I., & Porter, S. L. (2019) · Annual Review of Microbiology · doi:10.1146/annurev-micro-020518-115846 · Cited by 73
Quorum Sensing and Toxin Production in Staphylococcus aureus Osteomyelitis: Pathogenesis and Paradox
Butrico, C. E., & Cassat, J. E. (2020) · Toxins · doi:10.3390/toxins12080516 · Cited by 65
“Interestingly, some activated response regulators can cross-regulate transcription of genes associated with other two-component systems [16,17].”
BackgroundFrancis, V. I., Waters, E. M., Finton-James, S. E., Gori, A., Kadioglu, A., Brown, A. R., & Porter, S. L. (2018) · Nature Communications · doi:10.1038/s41467-018-04640-8 · Cited by 61
The DNA glycosylase AlkD uses a non-base-flipping mechanism to excise bulky lesions
Mullins, E. A., Shi, R., Parsons, Z. D., Yuen, P. K., David, S. S., Igarashi, Y., & Eichman, B. F. (2015) · Nature · doi:10.1038/nature15728 · Cited by 67
“The 1-kb flanking regions surrounding alkD were inserted into the knockout-plasmid pLM4 using standard molecular biology techniques 41 .”
Metadata
- Authors
- Mike, L. A., Choby, J. E., Brinkman, P. R., Olive, L. Q., Dutter, B. F., Ivan, S. J., Gibbs, C. M., Sulikowski, G. A., Stauff, D. L., & Skaar, E. P.
- Affiliations
- Vanderbilt University (US)
- Grove City College (US)
- Vanderbilt University Medical Center (US)
- Corresponding author
- Skaar, Eric P.
- ORCID
- Venue
- PLoS Pathogens
- Publisher
- Public Library of Science (PLoS)
- Published
- 2014-03-27
- Volume
- 10
- Issue
- 3
- Pages
- e1004044
- ISSN
- 1553-7366 (ISSN-L)
- 1553-7374
- PMC
- PMC3968170
- OpenAlex
- W2047040799
- Cited by
- 49
- References
- 57
- Citations by year
- 2025: 6 · 2024: 6 · 2023: 5 · 2022: 6 · 2021: 2 · 2020: 5 · 2019: 5 · 2018: 3 · 2017: 2 · 2016: 4 · 2015: 4 · 2014: 1
- FWCI
- 2.41
- Type
- journal article
- Language
- en
- Open access
- gold
- doi.org
- Locations
- PLoS Pathogens (publishedVersion, cc-by)
- Europe PMC (PubMed Central) (publishedVersion, cc-by)
- PubMed Central (publishedVersion, cc-by)
- PubMed (publishedVersion)
- DOAJ (DOAJ: Directory of Open Access Journals) (submittedVersion, cc-by-sa)
- Figshare (submittedVersion, cc-by)
- Funders
- National Science Foundation (1156922)
- Vanderbilt University (T32 HL069765)
- Grove City College
- Searle Scholars Program
- National Institutes of Health (NIH T32, AI073843, HL069765, AI057157)
- National Heart, Lung, and Blood Institute (T32HL069765)
- National Institute of General Medical Sciences (T32GM065086)
- National Institute of Allergy and Infectious Diseases (AI 069233, AI073843, R01AI069233, U54AI057157, R01AI073843)
- Division of Chemistry
- Topics
- Life Sciences › Biochemistry, Genetics and Molecular Biology › Genetics › Bacterial Genetics and Biotechnology
- Life Sciences › Biochemistry, Genetics and Molecular Biology › Molecular Biology › Bacillus and Francisella bacterial research
- Life Sciences › Biochemistry, Genetics and Molecular Biology › Molecular Biology › Gene Regulatory Network Analysis
- Keywords
- two-component systems, cross-regulation, Bacillus anthracis, heme sensing, cell envelope stress, sensor histidine kinase, response regulator, phosphorelay, ABC transporters, chemical biology
- MeSH terms
- Bacillus anthracis, Bacterial Proteins, Cell Wall, Heme, Stress, Physiological, Signal Transduction, Gene Expression Regulation, Bacterial, Membrane Transport Proteins
About these checks
Registry, retraction, Cites and statistics results are computed, not judged, with one exception: a printed reference that no index lists is read once by a model before it counts as a citation error. Claims are extracted by a model and kept only when their quote appears verbatim in the text; each cited source is then checked, with a model’s help, for whether it says what the claim relies on. Those verdicts can be wrong — read the claim’s quote and the cited source before relying on one.
Statistics and arithmetic are recomputed, not judged.
Confidence bands are shown only for fields calibrated on our annotated test set. None is calibrated yet, so no band is shown.
What counts as a claim ›How we measure confidence ›How we check this ›
Are you an author, or do you see a problem with this page? Request a review
Data sources
Bibliographic data: Semantic Scholar, OpenAlex, Crossref.
Contains information from the Semantic Scholar Academic Graph Datasets, made available under the ODC Attribution License (ODC-BY 1.0).
Semantic Scholar’s data is described in: Kinney, R., et al. (2023). The Semantic Scholar Open Data Platform. arXiv:2301.10140.
