

The DOI matches its Crossref record; 48 of the 48 references it cites were found in a registry or an index.
Comparative analysis estimates the relative frequencies of co-divergence and cross-species transmission within viral families
Open accessAbstract
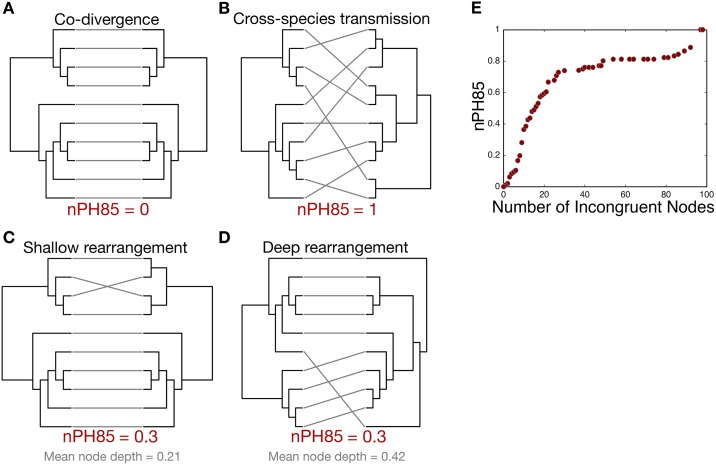
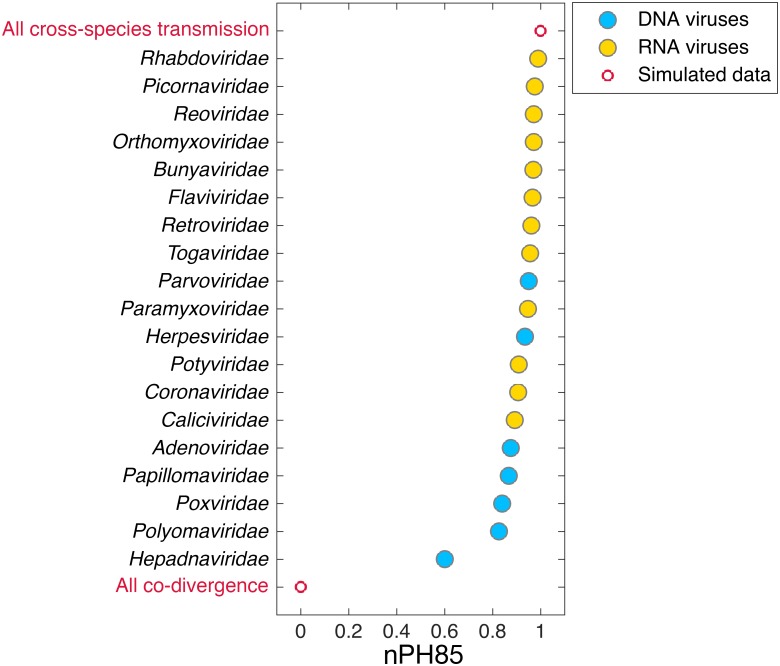
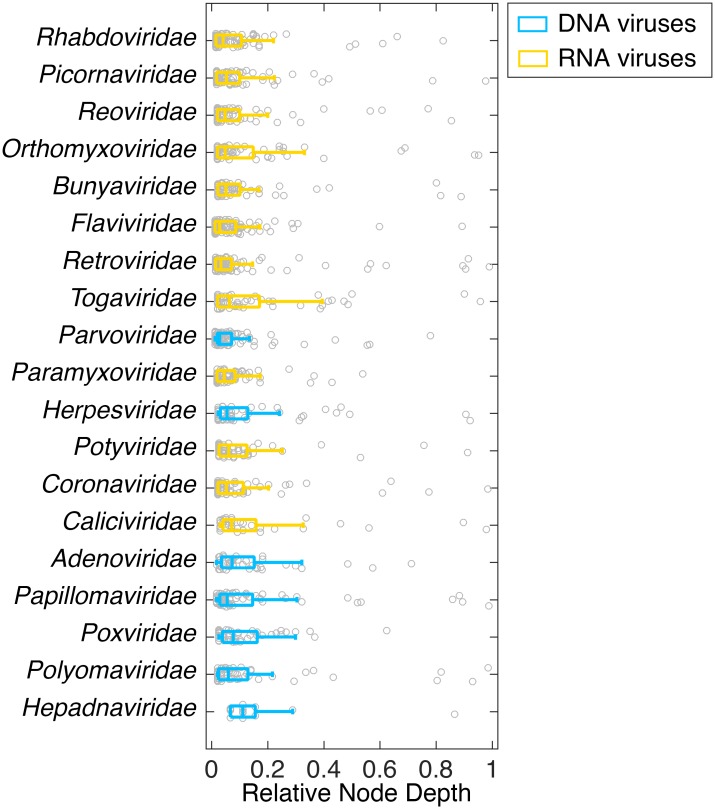
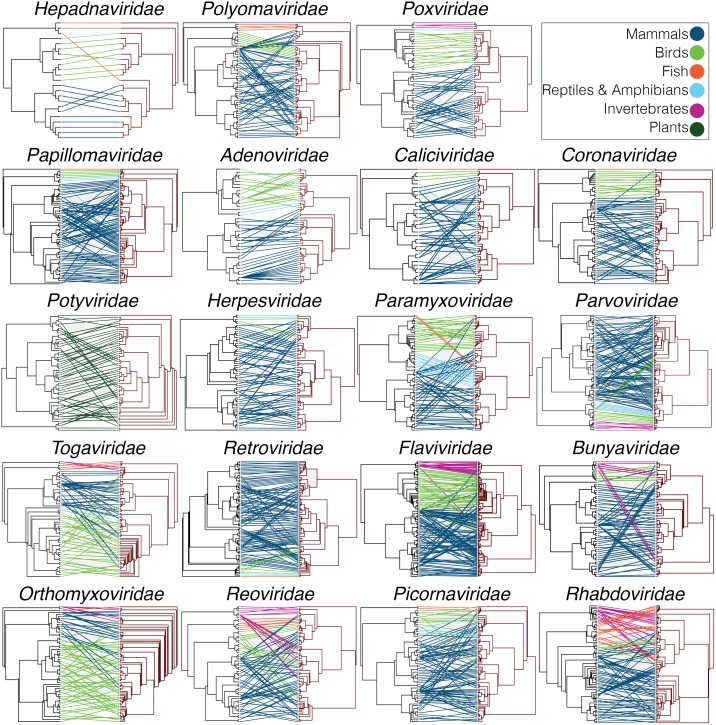
The cross-species transmission of viruses from one host species to another is responsible for the majority of emerging infections. However, it is unclear whether some virus families have a greater propensity to jump host species than others. If related viruses have an evolutionary history of co-divergence with their hosts there should be evidence of topological similarities between the virus and host phylogenetic trees, whereas host jumping generates incongruent tree topologies. By analyzing co-phylogenetic processes in 19 virus families and their eukaryotic hosts we provide a quantitative and comparative estimate of the relative frequency of virus-host co-divergence versus cross-species transmission among virus families. Notably, our analysis reveals that cross-species transmission is a near universal feature of the viruses analyzed here, with virus-host co-divergence occurring less frequently and always on a subset of viruses. Despite the overall high topological incongruence among virus and host phylogenies, the Hepadnaviridae, Polyomaviridae, Poxviridae, Papillomaviridae and Adenoviridae, all of which possess double-stranded DNA genomes, exhibited more frequent co-divergence than the other virus families studied here. At the other extreme, the virus and host trees for all the RNA viruses studied here, particularly the Rhabdoviridae and the Picornaviridae, displayed high levels of topological incongruence, indicative of frequent host switching. Overall, we show that cross-species transmission plays a major role in virus evolution, with all the virus families studied here having the potential to jump host species, and that increased sampling will likely reveal more instances of host jumping.
Overview
The claims and statistics of this paper haven’t been checked yet.
Run the check — free, no account needed. It reads the open-access text and checks the sources it cites.
Integrity signals
Registry
Cites
Statistics
Figures
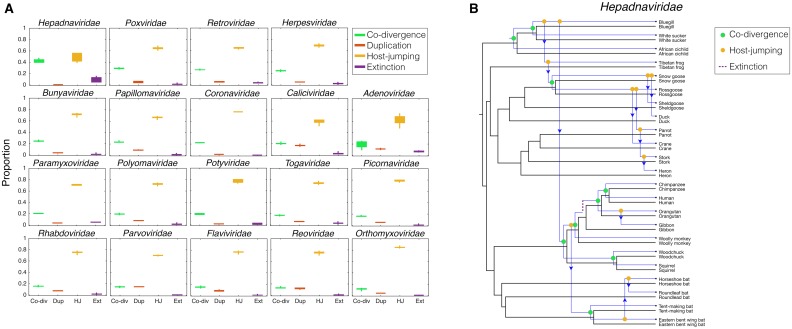
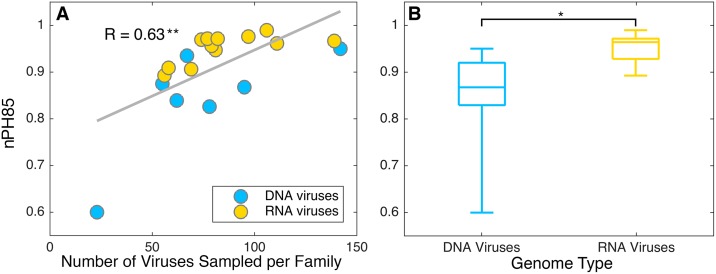
Verification
Claims the paper makes
The claims and statistics of this paper haven’t been checked yet.
Run the check — free, no account needed. It reads the open-access text and checks the sources it cites.
Claims other papers make about this one
Each is checked against this paper’s own text: does it say what the citing paper says it does?
The cited source says what the claim attributes to it.
In the citing paper
“Although this may in part be due to the reliance on transcript-based viral detection, RNA viruses are in general characterised by lower host specificity than DNA viruses, reflecting an increased occurrence of cross-species transmission (Geoghegan, Duchêne, and Holmes 2017; Wells et al. 2020).”
From Red fox viromes in urban and rural landscapes (2020) · cites this paper as Geoghegan, Duchêne, and Holmes 2017
Self-check
Percentages, sums and reported differences re-computed from the paper’s own numbers.
The self-check needs the paper’s full text.
Citations
Cites
MUSCLE: multiple sequence alignment with high accuracy and high throughput
Edgar, R. C. (2004) · Nucleic Acids Research · doi:10.1093/nar/gkh340 · Cited by 44,662
Guindon, S., Dufayard, J.-F., Lefort, V., Anisimova, M., Hordijk, W., & Gascuel, O. (2010) · Systematic Biology · doi:10.1093/sysbio/syq010 · Cited by 18,376
trimAl: a tool for automated alignment trimming in large-scale phylogenetic analyses
Capella-Gutiérrez, S., Silla-Martinez, J., & Gabaldón, T. (2009) · Bioinform. · doi:10.1093/bioinformatics/btp348 · Cited by 12,052
Approximate likelihood-ratio test for branches: A fast, accurate, and powerful alternative
Anisimova, M., & Gascuel, O. (2006) · Systematic Biology · doi:10.1080/10635150600755453 · Cited by 2,693
A comprehensive phylogeny of birds (Aves) using targeted next-generation DNA sequencing
Prum, R. O., Berv, J. S., Dornburg, A., Field, D. J., Townsend, J. P., Lemmon, E. M., & Lemmon, A. R. (2015) · Nature · doi:10.1038/nature15697 · Cited by 1,668
Redefining the invertebrate RNA virosphere
Shī, M., Lin, X., Tian, J.-H., Chen, L., Chen, X., Li, C., Qin, X.-C., Li, J., Cao, J., Eden, J., et al. (2016) · Nature · doi:10.1038/nature20167 · Cited by 1,649
Self-citationAnisimova, M. O., Gil, M., Dufayard, J.-F., Dessimoz, C., & Gascuel, O. (2011) · Systematic Biology · doi:10.1093/sysbio/syr041 · Cited by 1,323
Sanjuán, R., Nebot, M. R., Chirico, N., Mansky, L. M., & Belshaw, R. D. (2010) · Journal of Virology · doi:10.1128/jvi.00694-10 · Cited by 1,313
Keane, T., Creevey, C. J., Pentony, M. M., Naughton, T. J., & Mclnerney, J. O. (2006) · BMC Evolutionary Biology · doi:10.1186/1471-2148-6-29 · Cited by 1,070
A comprehensive phylogeny of birds (Aves) using targeted next-generation DNA sequencing
Prum, R. O., Berv, J. S., Dornburg, A., Field, D. J., Townsend, J. P., Lemmon, E. M., & Lemmon, A. R. (2016) · Nature · doi:10.1038/nature19417 · Cited by 928 · cited 1×
“In each case the host tree topologies used were the most up-to-date available in the literature [40] [41] [42] [43] [44] .”
Method
Cited by
Sorted by citations
The evolutionary history of vertebrate RNA viruses
Shī, M., Lin, X., Chen, X., Tian, J.-H., Chen, L., Li, K., Wang, W., Eden, J., Shen, J., Liu, L., et al. (2018) · Nature · doi:10.1038/s41586-018-0012-7 · Cited by 763
Self-citationUsing Metagenomics to Characterize an Expanding Virosphere
Zhāng, Y.-Z., Shī, M., & Holmes, E. C. (2018) · Cell · doi:10.1016/j.cell.2018.02.043 · Cited by 359
Self-citationLi, W., Hulswit, R. J. G., Kenney, S. P., Widjaja, I., Jung, K., Alhamo, M. A., van Dieren, B., van Kuppeveld, F. J. M., Saif, L. J., & Bosch, B. (2018) · Proceedings of the National Academy of Sciences · doi:10.1073/pnas.1802879115 · Cited by 308
Predicting virus emergence amid evolutionary noise
Geoghegan, J. L., & Holmes, E. C. (2017) · Open Biology · doi:10.1098/rsob.170189 · Cited by 209
Self-citationEvidence that RNA Viruses Drove Adaptive Introgression between Neanderthals and Modern Humans
Enard, D., & Petrov, D. A. (2018) · Cell · doi:10.1016/j.cell.2018.08.034 · Cited by 208
Metadata
- Authors
- Geoghegan, J. L., Duchêne, S., & Holmes, E. C.
- Affiliations
- The University of Sydney (AU)
- Corresponding author
- Holmes, Edward C.
- Venue
- PLOS Pathogens
- Publisher
- Public Library of Science (PLoS)
- Published
- 2017-02-08
- Volume
- 13
- Issue
- 2
- Pages
- e1006215
- ISSN
- 1553-7366 (ISSN-L)
- 1553-7374
- PMC
- PMC5319820
- OpenAlex
- W2587475720
- Cited by
- 275
- References
- 48
- Citations by year
- 2026: 15 · 2025: 15 · 2024: 31 · 2023: 43 · 2022: 19 · 2021: 33 · 2020: 28 · 2019: 30 · 2018: 39 · 2017: 22
- FWCI
- 30.56
- Type
- journal article
- Language
- en
- Update notices
- new_version (2017-02-21)
- Open access
- gold
- doi.org
- Licence
- Locations
- PLoS Pathogens (publishedVersion, cc-by)
- Europe PMC (PubMed Central) (publishedVersion, cc-by)
- PubMed Central (publishedVersion, cc-by)
- PubMed (publishedVersion)
- Minerva Access (University of Melbourne) (submittedVersion, cc-by)
- DOAJ (DOAJ: Directory of Open Access Journals) (submittedVersion, cc-by-sa)
- Figshare (submittedVersion, cc-by)
- Funders
- National Health and Medical Research Council (GNT1037231)
- Topics
- Health Sciences › Medicine › Public Health, Environmental and Occupational Health › Zoonotic diseases and public health
- Life Sciences › Biochemistry, Genetics and Molecular Biology › Genetics › Evolution and Genetic Dynamics
- Life Sciences › Biochemistry, Genetics and Molecular Biology › Molecular Biology › Genomics and Phylogenetic Studies
- Keywords
- interspecies transmission, host switching, cophylogeny, phylogenetic incongruence, viral families, emerging infectious diseases, RNA viruses, DNA viruses, Hepadnaviridae, Polyomaviridae, poxvirus, papillomavirus, Adenoviridae, Rhabdoviridae, picornavirus, host-virus coevolution
- MeSH terms
- Animals, Humans, Phylogeny, Viruses, Zoonoses, Genome, Viral, Evolution, Molecular, Host Specificity
About these checks
Registry, retraction, Cites and statistics results are computed, not judged, with one exception: a printed reference that no index lists is read once by a model before it counts as a citation error. Claims are extracted by a model and kept only when their quote appears verbatim in the text; each cited source is then checked, with a model’s help, for whether it says what the claim relies on. Those verdicts can be wrong — read the claim’s quote and the cited source before relying on one.
Statistics and arithmetic are recomputed, not judged.
Confidence bands are shown only for fields calibrated on our annotated test set. None is calibrated yet, so no band is shown.
What counts as a claim ›How we measure confidence ›How we check this ›
Are you an author, or do you see a problem with this page? Request a review
