

The DOI matches its Crossref record; 7 of the 7 references it cites were found in a registry or an index.
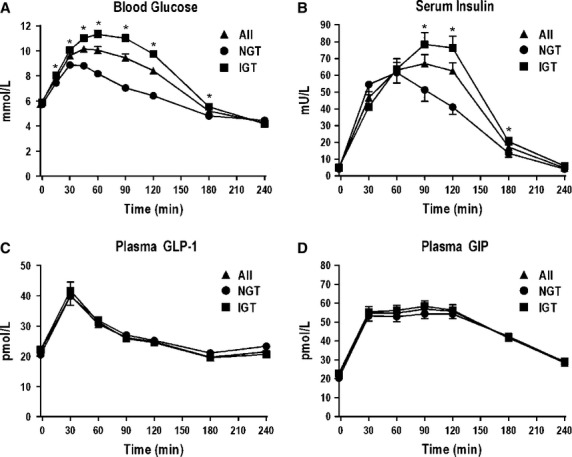
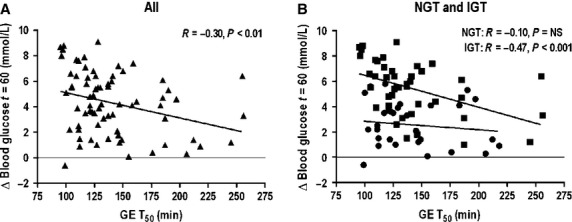
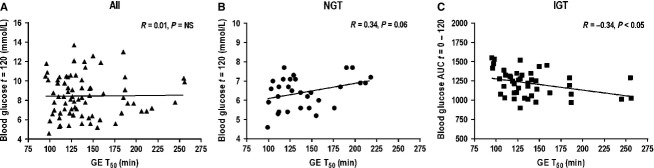
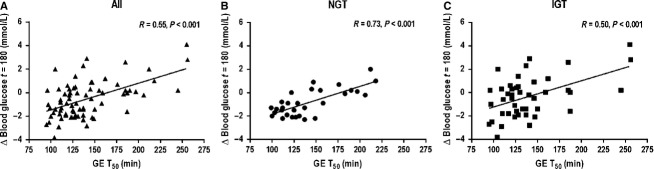
Impact of gastric emptying to the glycemic and insulinemic responses to a 75-g oral glucose load in older subjects with normal and impaired glucose tolerance
Overview
The claims and statistics of this paper haven’t been checked yet.
Run the check — free, no account needed. It reads the open-access text and checks the sources it cites.
Integrity signals
Registry
Cites
Statistics
Figures
Verification
Claims the paper makes
The claims and statistics of this paper haven’t been checked yet.
Run the check — free, no account needed. It reads the open-access text and checks the sources it cites.
Claims other papers make about this one
Each is checked against this paper’s own text: does it say what the citing paper says it does?
The cited source says what the claim attributes to it.
In the citing paper
“The GE rate is a major determinant of postprandial glycaemic excursions in both healthy participants and in participants with T2DM 7,8 and has been linked to suppression of food intake and weight loss.9”
Self-check
Percentages, sums and reported differences re-computed from the paper’s own numbers.
The self-check needs the paper’s full text.
Citations
Cites
Nauck, M. A., Heimesaat, M. M., Orskov, C., Holst, J. J., Ebert, R., & Creutzfeldt, W. (1993) · Journal of Clinical Investigation · doi:10.1172/jci116186 · Cited by 1,651
Reduced incretin effect in Type 2 (non-insulin dependent) diabetes
Nauck, M., Stöckmann, F., Ebert, R., & Creutzfeldt, W. (1986) · Diabetologia · doi:10.1007/bf02427280 · Cited by 1,307
Phillips, D. I. W., Clark, P. M., Hales, C. N., & Osmond, C. (1994) · Diabetic Medicine · doi:10.1111/j.1464-5491.1994.tb00273.x · Cited by 631
Relationship between oral glucose tolerance and gastric emptying in normal healthy subjects
Horowitz, M., Edelbroek, M. A. L., Wishart, J. M., & Straathof, J. W. (1993) · Diabetologia · doi:10.1007/bf00400362 · Cited by 469
Self-citationMooy, J. M., Grootenhuis, P. A., de Vries, H., Kostense, P. J., Popp-Snijders, C., Bouter, L. M., & Heine, R. J. (1996) · Diabetologia · doi:10.1007/bf00418345 · Cited by 344
Effect of exenatide on gastric emptying and relationship to postprandial glycemia in type 2 diabetes
Linnebjerg, H., Park, S., Kothare, P. A., Trautmann, M. E., Mace, K., Fineman, M., Wilding, I., Nauck, M., & Horowitz, M. (2008) · Regulatory Peptides · doi:10.1016/j.regpep.2008.07.003 · Cited by 261
Self-citationHorowitz, M., Cunningham, K. M., Wishart, J. M., Jones, K. L., & Read, N. W. (1996) · Diabetologia · doi:10.1007/bf00400681 · Cited by 102
Self-citation
Research works printed but not linked: 32
- Abdul-Ghani, 2008, One-hour plasma glucose concentration and the metabolic syndrome identify subjects at high risk for future type 2 diabetes, Diabetes Care, 31, 1650, 10.2337/dc08-0225 · DOI
- Abdul-Ghani, 2009, Fasting versus postload plasma glucose concentration and the risk for future type 2 diabetes: results from the Botnia Study, Diabetes Care, 32, 281, 10.2337/dc08-1264 · DOI
- Abdul-Ghani, 2010, The shape of plasma glucose concentration curve during OGTT predicts future risk of type 2 diabetes, Diabetes Metab. Res. Rev., 26, 280, 10.1002/dmrr.1084 · DOI · Paper page
- Alberti, 1998, Definition, diagnosis and classification of diabetes mellitus and its complications. Part 1: diagnosis and classification of diabetes mellitus provisional report of a WHO consultation, Diabet. Med., 15, 539, 10.1002/(SICI)1096-9136(199807)15:7<539::AID-DIA668>3.0.CO;2-S · DOI
- American Diabetes A, 2014, Standards of medical care in diabetes-2014, Diabetes Care, 37, S14, 10.2337/dc14-S014 · DOI · Paper page
- Bardini, 2010, Inflammation markers and metabolic characteristics of subjects with 1-h plasma glucose levels, Diabetes Care, 33, 411, 10.2337/dc09-1342 · DOI
- Brener, 1983, Regulation of the gastric emptying of glucose, Gastroenterology, 85, 76, 10.1016/S0016-5085(83)80232-7 · DOI
- Chang, 2006, Impaired beta-cell function in human aging: response to nicotinic acid-induced insulin resistance, J. Clin. Endocrinol. Metab., 91, 3303, 10.1210/jc.2006-0913 · DOI
- Collins, 1983, Gastric emptying in normal subjects-a reproducible technique using a single scintillation camera and computer system, Gut, 24, 1117, 10.1136/gut.24.12.1117 · DOI
- Corvilain, 1995, Effect of short-term starvation on gastric emptying in humans: relationship to oral glucose tolerance, Am. J. Physiol., 269, G512
- Fraser, 1990, Hyperglycaemia slows gastric emptying in type 1 (insulin-dependent) diabetes mellitus, Diabetologia, 33, 675, 10.1007/BF00400569 · DOI
- Ghoos, 1993, Measurement of gastric emptying rate of solids by means of a carbon-labeled octanoic acid breath test, Gastroenterology, 104, 1640, 10.1016/0016-5085(93)90640-X · DOI
- Horowitz, 1984, Changes in gastric emptying rates with age, Clin. Sci. (Lond.), 67, 213, 10.1042/cs0670213 · DOI
- Horowitz, 2001, Gastroparesis: prevalence, clinical significance and treatment, Can. J. Gastroenterol., 15, 805, 10.1155/2001/628102 · DOI
- Jones, 1995, Relationships between gastric emptying, intragastric meal distribution and blood glucose concentrations in diabetes mellitus, J. Nucl. Med., 36, 2220
- Kim, 2012, Glucose response curve and type 2 diabetes risk in Latino adolescents, Diabetes Care, 35, 1925, 10.2337/dc11-2476 · DOI
- Korosi, 2001, Effect of aging and diabetes on the enteroinsular axis, J. Gerontol. A Biol. Sci. Med. Sci., 56, M575, 10.1093/gerona/56.9.M575 · DOI
- Ma, 2012, Effects of variations in duodenal glucose load on glycaemic, insulin, and incretin responses in type 2 diabetes, Diabet. Med., 29, 604, 10.1111/j.1464-5491.2011.03496.x · DOI
- Matsuda, 1999, Insulin sensitivity indices obtained from oral glucose tolerance testing: comparison with the euglycemic insulin clamp, Diabetes Care, 22, 1462, 10.2337/diacare.22.9.1462 · DOI · Paper page
- Moore, 1983, Effect of age on gastric emptying of liquid-solid meals in man, Dig. Dis. Sci., 28, 340, 10.1007/BF01324951 · DOI
- Nauck, 2004, Gastric inhibitory polypeptide and glucagon-like peptide-1 in the pathogenesis of type 2 diabetes, Diabetes, 53, S190, 10.2337/diabetes.53.suppl_3.S190 · DOI · Paper page
- O'Donovan, 2005, Effect of aging on transpyloric flow, gastric emptying, and intragastric distribution in healthy humans-impact on glycemia, Dig. Dis. Sci., 50, 671, 10.1007/s10620-005-2555-3 · DOI
- Phillips, 1992, Rapid gastric emptying of an oral glucose solution in type 2 diabetic patients, J. Nucl. Med., 33, 1496
- Phillips, 1997, Accelerated gastric emptying in hypertensive subjects, J. Nucl. Med., 38, 207
- Pilichiewicz, 2007, Load-dependent effects of duodenal glucose on glycemia, gastrointestinal hormones, antropyloroduodenal motility, and energy intake in healthy men, Am. J. Physiol. Endocrinol. Metab., 293, E743, 10.1152/ajpendo.00159.2007 · DOI
- Reaven, 1993, Insulin resistance and insulin secretion are determinants of oral glucose tolerance in normal individuals, Diabetes, 42, 1324, 10.2337/diab.42.9.1324 · DOI
- Schwartz, 1995, Gastric emptying in Mexican Americans compared to non-Hispanic whites, Dig. Dis. Sci., 40, 624, 10.1007/BF02064382 · DOI
- Stevens, 2011, Measurement of gastric emptying of a high-nutrient liquid by 3D ultrasonography in diabetic gastroparesis, Neurogastroenterol. Motil., 23, 220, 10.1111/j.1365-2982.2010.01630.x · DOI
- Toft-Nielsen, 2001, Determinants of the effectiveness of glucagon-like peptide-1 in type 2 diabetes, J. Clin. Endocrinol. Metab., 86, 3853, 10.1210/jcem.86.8.7743 · DOI · Paper page
- Trahair, 2012, Comparative effects of variations in duodenal glucose load on glycemic, insulinemic, and incretin responses in healthy young and older subjects, J. Clin. Endocrinol. Metab., 97, 844, 10.1210/jc.2011-2583 · DOI
- Vilsboll, 2003, Both GLP-1 and GIP are insulinotropic at basal and postprandial glucose levels and contribute nearly equally to the incretin effect of a meal in healthy subjects, Regul. Pept., 114, 115, 10.1016/S0167-0115(03)00111-3 · DOI · Paper page
- Wishart, 1992, Radioimmunoassay of gastric inhibitory polypeptide in plasma, Clin. Chem., 38, 2156, 10.1093/clinchem/38.10.2156 · DOI
Cited by
Sorted by citations
Urva, S., Coskun, T., Loghin, C., Cui, X., Beebe, E., O'Farrell, L., Briere, D. A., Benson, C., Nauck, M. A., & Haupt, A. (2020) · Diabetes, Obesity and Metabolism · doi:10.1111/dom.14110 · Cited by 143
Aldawsari, M., Almadani, F. A., Almuhammadi, N., Algabsani, S., Alamro, Y., & Aldhwayan, M. (2023) · Diabetes, Metabolic Syndrome and Obesity · doi:10.2147/dmso.s387116 · Cited by 115
Metadata
- Authors
- Trahair, L. G., Horowitz, M., Marathe, C. S., Lange, K., Standfield, S., Rayner, C. K., & Jones, K. L.
- Affiliations
- Discipline of Medicine; The University of Adelaide; Adelaide South Australia Australia
- Venue
- Physiological Reports
- Publisher
- Wiley
- Published
- 2014-11
- Volume
- 2
- Issue
- 11
- Pages
- e12204
- ISSN
- 2051-817X
- PMC
- PMC4255811
- Cited by
- 22
- References
- 7
- Language
- en
- Funders
- National Health and Medical Research Council
About these checks
Registry, retraction, Cites and statistics results are computed, not judged, with one exception: a printed reference that no index lists is read once by a model before it counts as a citation error. Claims are extracted by a model and kept only when their quote appears verbatim in the text; each cited source is then checked, with a model’s help, for whether it says what the claim relies on. Those verdicts can be wrong — read the claim’s quote and the cited source before relying on one.
Statistics and arithmetic are recomputed, not judged.
Confidence bands are shown only for fields calibrated on our annotated test set. None is calibrated yet, so no band is shown.
What counts as a claim ›How we measure confidence ›How we check this ›
Are you an author, or do you see a problem with this page? Request a review
