

The DOI matches its Crossref record; 3 of the 3 references it cites were found in a registry or an index.
Head-direction cells recorded from the postsubiculum in freely moving rats. I. Description and quantitative analysis
Open accessAbstract
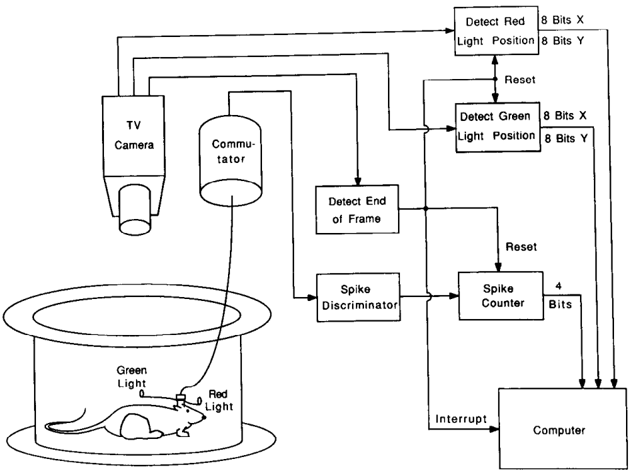
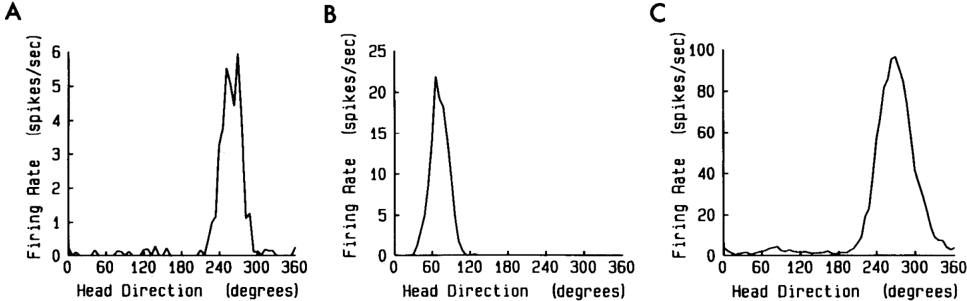
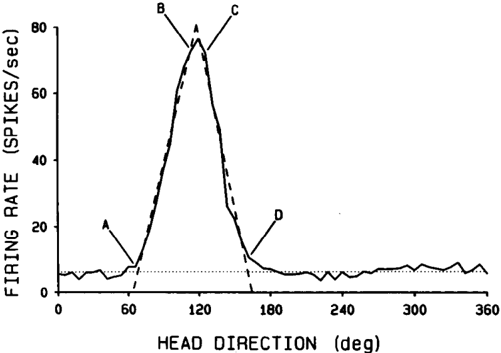
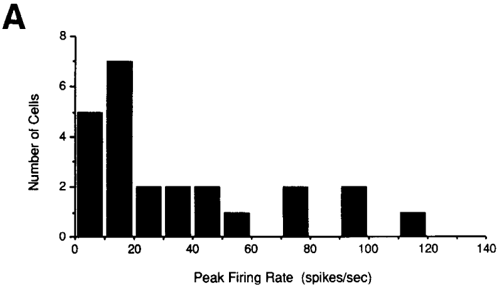
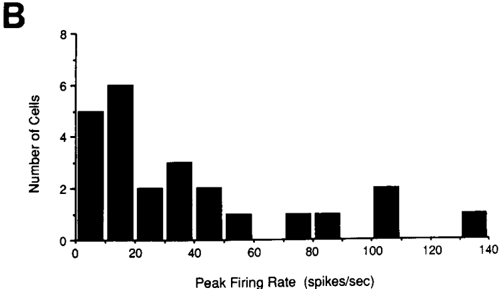
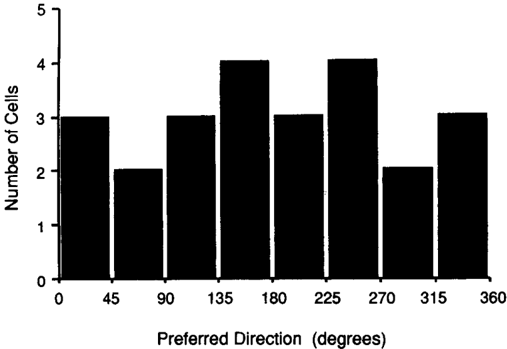
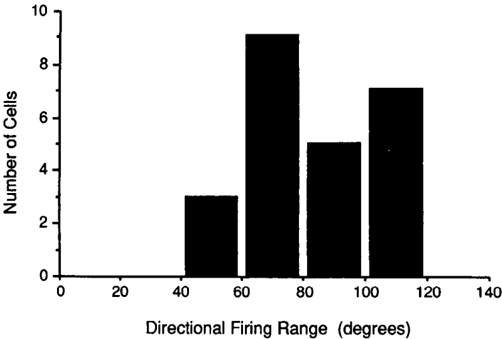
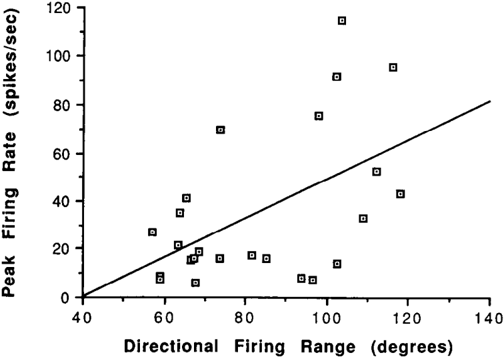
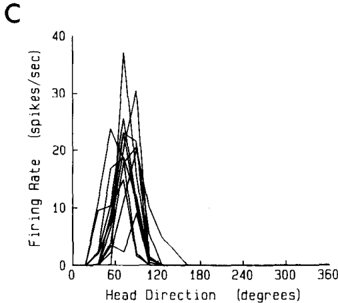
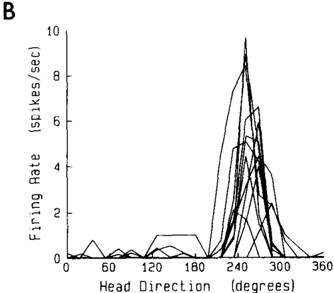
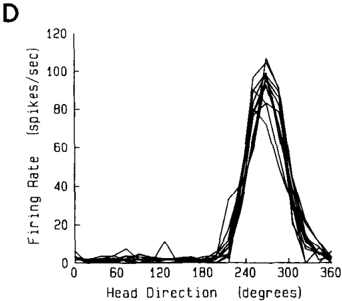
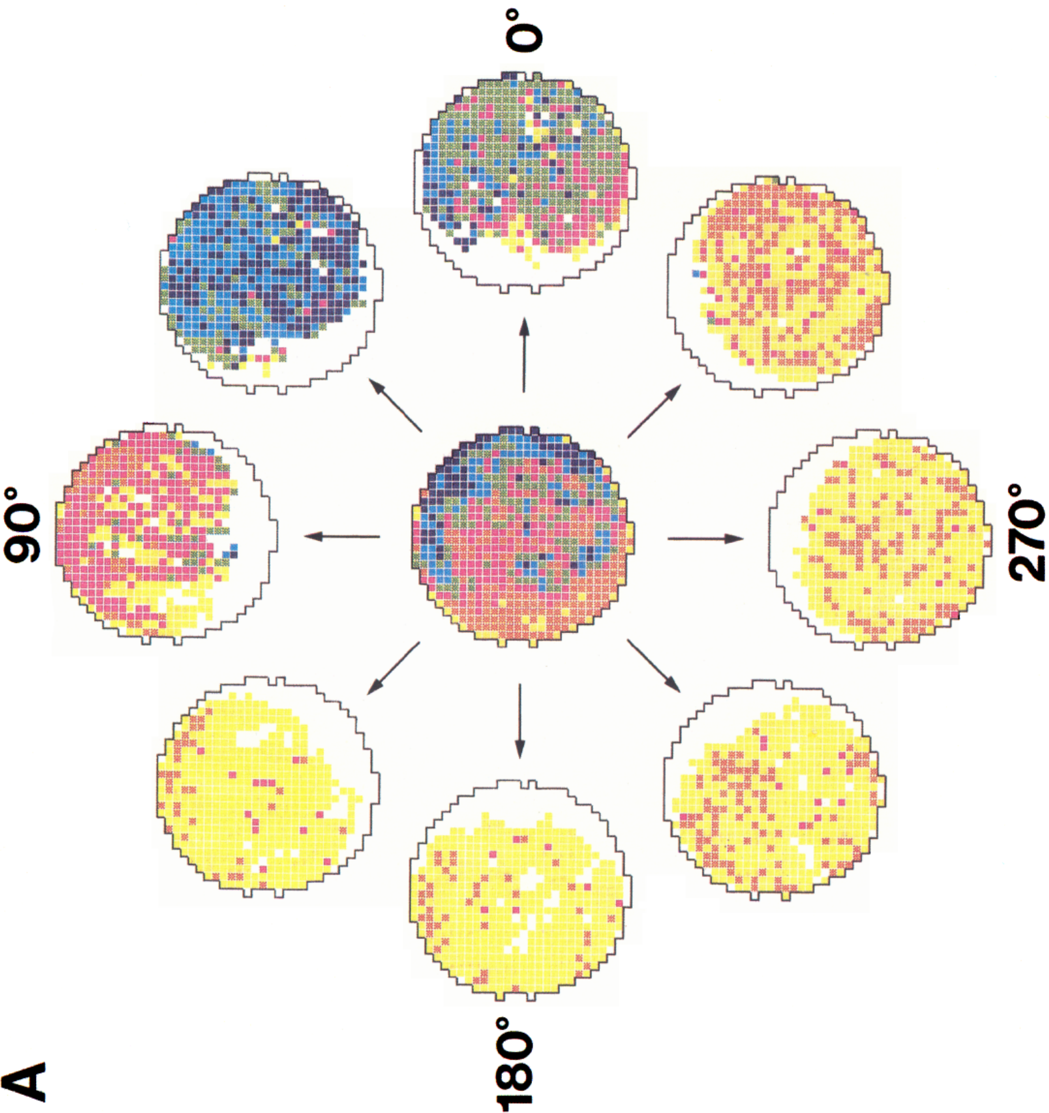
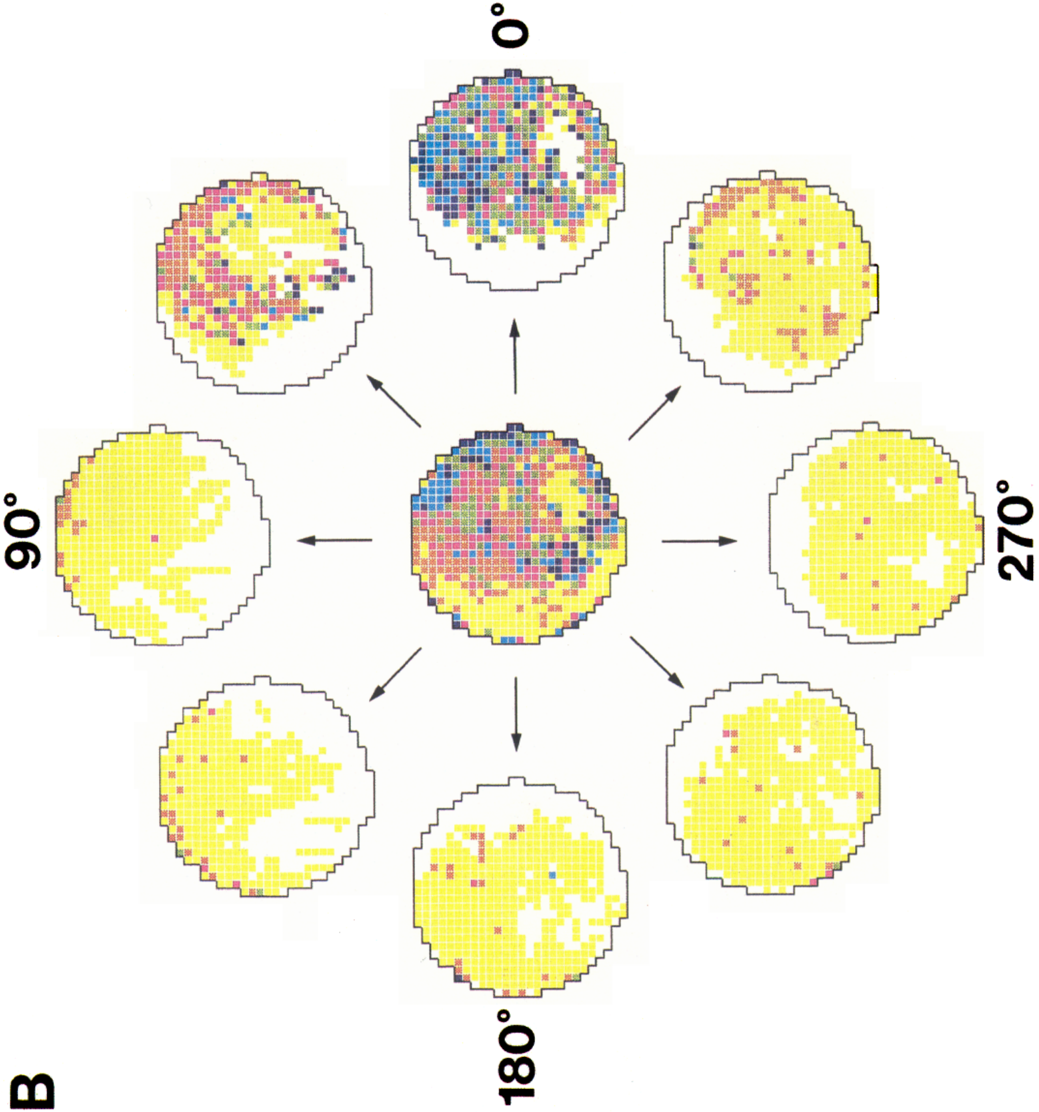
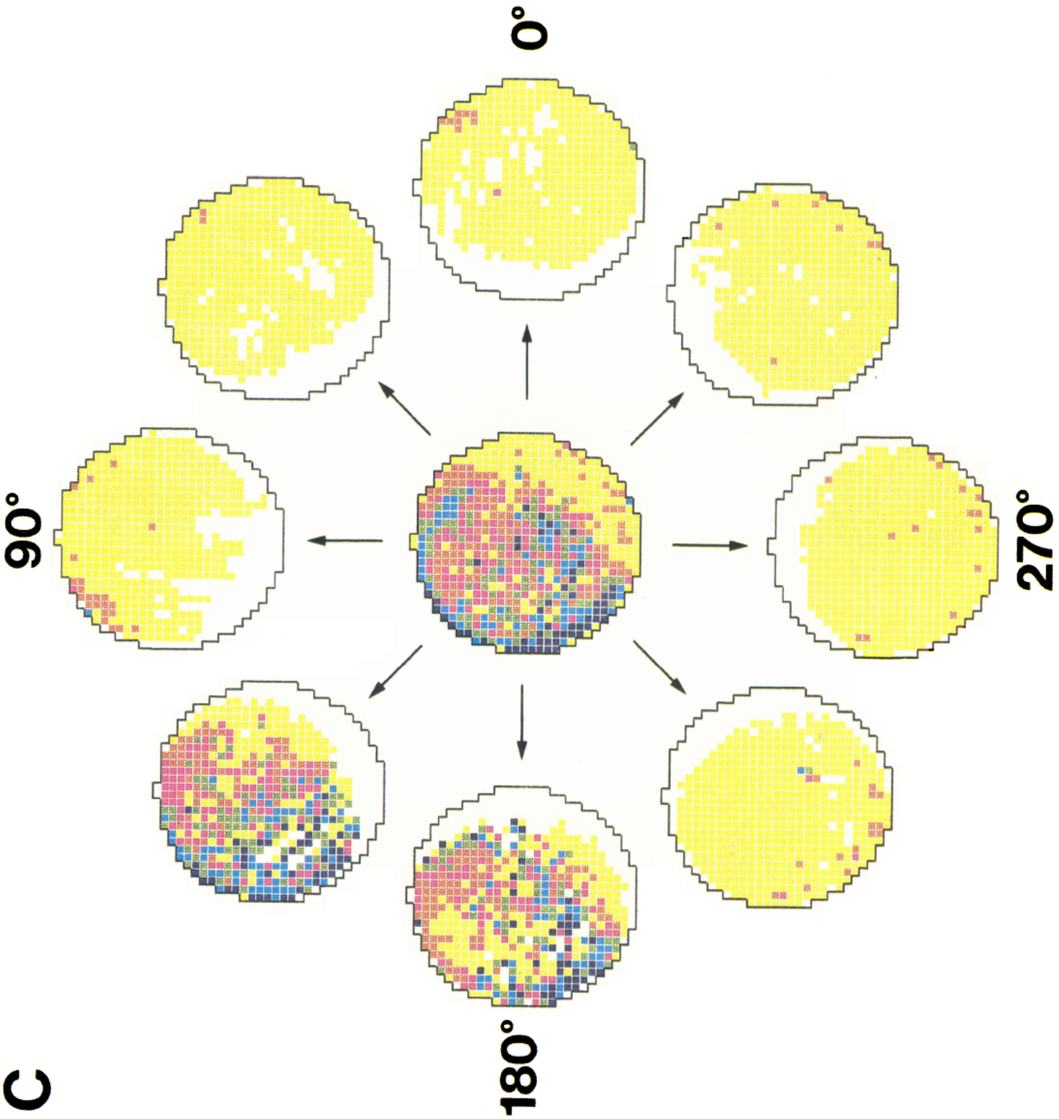
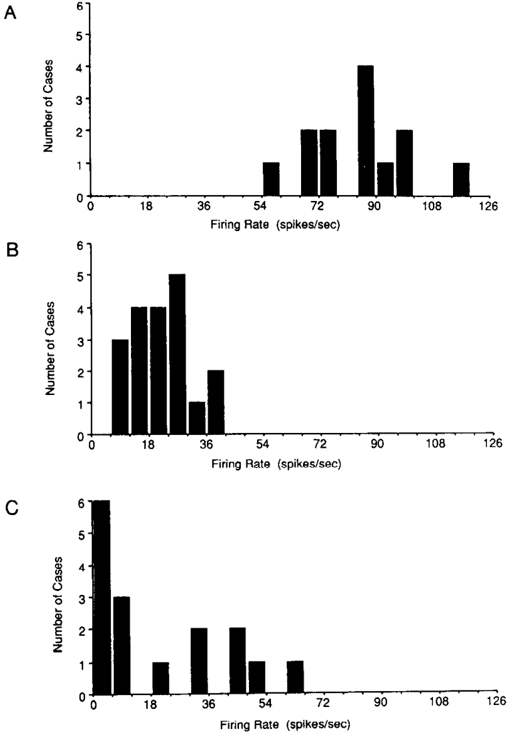
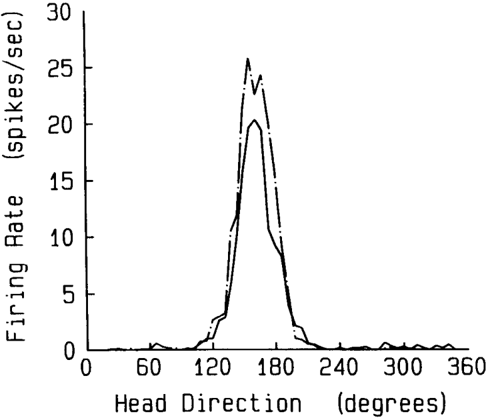
This paper is a study of the behavioral and spatial firing correlates of neurons in the rat postsubiculum. Recordings were made from postsubicular neurons as rats moved freely throughout a cylindrical chamber, where the major cue for orientation was a white card taped to the inside wall. An automatic video/computer system monitored cell discharge while simultaneously tracking the position of 2 colored light emitting diodes (LEDs) secured to the animal's head. The animal's location was calculated from the position of one of the LEDs and head direction in the horizontal plane calculated from the relative positions of the 2 LEDs. Approximately 26% of the cells were classified as head-direction cells because they discharged as a function of the animal's head direction in the horizontal plane, independent of the animal's behavior, location, or trunk position. For each head-direction cell, vectors drawn in the direction of maximal firing were parallel throughout the recording chamber and did not converge toward a single point. Plots of firing rate versus head direction showed that each firing-rate/head-direction function was adequately described by a triangular function. Each cell's maximum firing rate occurred at only one (the preferred) head direction; firing rates at head directions on either side of the preferred direction decreased linearly with angular deviation from the preferred direction. Results from 24 head-direction cells in 7 animals showed an equal distribution of preferred firing directions over a 360 degrees angle. The peak firing rate of head-direction cells varied from 5 to 115 spikes/sec (mean: 35). The range of head-direction angles over which discharge was elevated (directional firing range) was usually about 90 degrees, with little, if any, discharge at head directions outside this range. Quantitative analysis showed the location of the animal within the cylinder had minimal effect on directional cell firing. For each head-direction cell, the preferred direction, peak firing rate, and directional firing range remained stable for days. These results identify a new cell type that signals the animal's head direction in its environment.
Overview
The claims and statistics of this paper haven’t been checked yet.
Run the check — free, no account needed. It reads the open-access text and checks the sources it cites.
Integrity signals
Registry
Cites
Statistics
Figures
Verification
Claims the paper makes
The claims and statistics of this paper haven’t been checked yet.
Run the check — free, no account needed. It reads the open-access text and checks the sources it cites.
Claims other papers make about this one
Each is checked against this paper’s own text: does it say what the citing paper says it does?
In the citing paper
“Subsequent research identified other spatially tuned cells-such as grid cells, which encode grid-like patterns; head-direction cells, which signal the direction of gaze; and boundary cells, which respond to environmental edges [46-48].”
From From Text to Space: Mapping Abstract Spatial Models in LLMs during a Grid-World Navigation Task (2025) · cites this paper as [48]
In the citing paper
“Subsequent research identified other spatially tuned cells-such as grid cells, which encode grid-like patterns; head-direction cells, which signal the direction of gaze; and boundary cells, which respond to environmental edges [46-48].”
From From Text to Space: Mapping Abstract Spatial Models in LLMs during a Grid-World Navigation Task (2025) · cites this paper as [48]
In the citing paper
“Subsequent research identified other spatially tuned cells-such as grid cells, which encode grid-like patterns; head-direction cells, which signal the direction of gaze; and boundary cells, which respond to environmental edges [46-48].”
From From Text to Space: Mapping Abstract Spatial Models in LLMs during a Grid-World Navigation Task (2025) · cites this paper as [48]
In the citing paper
“Mammalian extra-hippocampal cortical areas contain a variety of functionally specialized neurons with presumably distinct roles in the representation of space, i.e., “head direction cells”, “border cells”, and “grid cells”, that likely encode relevant spatial information in egocentric coordinates [72,193,194,195,196].”
From Spatial Cognition in Teleost Fish: Strategies and Mechanisms (2021) · cites this paper as [196]
Self-check
Percentages, sums and reported differences re-computed from the paper’s own numbers.
The self-check needs the paper’s full text.
Citations
Cites
Place navigation impaired in rats with hippocampal lesions
Morris, R. G. M., Garrud, P., Rawlins, J. N. P., & O'Keefe, J. (1982) · Nature · doi:10.1038/297681a0 · Cited by 6,340
Hippocampus, space, and memory
Olton, D. S., Becker, J. T., & Handelmann, G. E. (1979) · Behavioral and Brain Sciences · doi:10.1017/s0140525x00062713 · Cited by 2,018
The effects of changes in the environment on the spatial firing of hippocampal complex-spike cells
Muller, R., & Kubie, J. (1987) · The Journal of Neuroscience · doi:10.1523/jneurosci.07-07-01951.1987 · Cited by 1,581
Self-citation
Research works printed but not linked: 2
- O'Keefe, J., and L. Nadel (1978) The Hippocampus as a Cognitive Map, Clarendon, Oxford, U.K.
- Ranck, J. B., Jr. (1975) Behavioral correlates and firing repertoires of neurons in dorsal hippocampal formation and septum of unrestrained rats. In The Hippocampus Vol. 2: Neurophysiology and Behavior, R. L. Isaacson and K. H. Pribram, eds., pp. 207-244, Plenum, New York.
Cited by
Sorted by citations
Items 101–114 of 114
Bett, D., Stevenson, C. H., Shires, K. L., Smith, M. T., Martin, S. J., Dudchenko, P. A., & Wood, E. R. (2013) · The Journal of Neuroscience · doi:10.1523/jneurosci.5476-12.2013 · Cited by 27
A theoretical account of cue averaging in the rodent head direction system
Page, H. J. I., Walters, D. M., Knight, R., Piette, C. E., Jeffery, K. J., & Stringer, S. M. (2014) · Philosophical Transactions of the Royal Society B: Biological Sciences · doi:10.1098/rstb.2013.0283 · Cited by 21
Nakayama, K., Moher, J., & Song, J.-H. (2023) · Annual Review of Psychology · doi:10.1146/annurev-psych-021422-043229 · Cited by 21
Maintaining a stable head direction representation in naturalistic visual environments
Haberkern, H., Chitnis, S. S., Hubbard, P. M., Goulet, T., Hermundstad, A. M., & Jayaraman, V. (2022) · doi:10.1101/2022.05.17.492284 · Cited by 21
The Representation of Three-Dimensional Space in Fish
Burt de Perera, T., Holbrook, R. I., & Davis, V. (2016) · Frontiers in Behavioral Neuroscience · doi:10.3389/fnbeh.2016.00040 · Cited by 20
Dunn, S. L. S., Town, S. M., Bizley, J. K., & Bendor, D. (2022) · Nature Communications · doi:10.1038/s41467-022-33507-2 · Cited by 17
Visual objects refine head direction coding
Siegenthaler, D., Denny, H., Carrasco, S. S., Mayer, J. L., Levenstein, D., Peyrache, A., Trenholm, S., & Macé, É. (2025) · Science · doi:10.1126/science.adu9828 · Cited by 16
Converting an allocentric goal into an egocentric steering signal
Pires, P. M., Abbott, L. F., & Maimon, G. (2022) · doi:10.1101/2022.11.10.516026 · Cited by 110
A structured scaffold underlies activity in the hippocampus
Mulders, D., Yim, M. Y., Lee, J. S., Lee, A. K., Taillefumier, T., & Fiete, I. R. (2021) · doi:10.1101/2021.11.20.469406 · Cited by 11
García-Pérez, M. A., Irani, M., Tiznado, V., Bustamante, T., Inostroza, M., Maldonado, P. E., & Valdés, J. L. (2022) · Frontiers in Neuroscience · doi:10.3389/fnins.2022.891523 · Cited by 10
Unfolding the Black Box of Recurrent Neural Networks for Path Integration
Chu, T., Wu, Y., Burgess, N., Ji, Z., & Wu, S. (2025) · Advances in Neural Information Processing Systems 38 · doi:10.52202/085713-3412 · Cited by 3
A neuro‐behavioural model of neophobia
Dorfman, A., Subach, A., & Scharf, I. (2026) · Biological Reviews · doi:10.1002/brv.70151
From Text to Space: Mapping Abstract Spatial Models in LLMs during a Grid-World Navigation Task
Martorell, N. (2025) · arXiv · doi:10.48550/arxiv.2502.16690
Schøyen (2022) · doi:10.1101/2022.08.18.504379 · Cited by 27
Metadata
- Authors
- Taube, J., Muller, R., & Ranck, J.
- Affiliations
- SUNY Downstate Health Sciences University (US)
- Venue
- The Journal of Neuroscience
- Publisher
- Society for Neuroscience
- Published
- 1990-02-01
- Volume
- 10
- Issue
- 2
- Pages
- 420-435
- ISSN
- 0270-6474 (ISSN-L)
- 1529-2401
- PMC
- PMC6570151
- OpenAlex
- W2167403166
- Cited by
- 1,809
- References
- 3
- Citations by year
- 2026: 64 · 2025: 99 · 2024: 120 · 2023: 85 · 2022: 95 · 2021: 83 · 2020: 89 · 2019: 84 · 2018: 97 · 2017: 77 · 2016: 56 · 2015: 78 · 2014: 75 · 2013: 52 · 2012: 45
- FWCI
- 6.48
- Type
- journal article
- Language
- en
- Open access
- hybrid
- doi.org
- Licence
- Locations
- Journal of Neuroscience (publishedVersion, cc-by-nc-sa)
- Europe PMC (PubMed Central) (publishedVersion)
- PubMed Central (publishedVersion)
- PubMed (publishedVersion)
- Funders
- National Institutes of Health (5t32ns007117-13, 5r01ns014497-16, 20686)
- National Institute of Neurological Disorders and Stroke (NS14497, NS07117, NS 20686, R01NS020686)
- Topics
- Life Sciences › Neuroscience › Cognitive Neuroscience › Memory and Neural Mechanisms
- Social Sciences › Psychology › Experimental and Cognitive Psychology › Spatial Cognition and Navigation
- Life Sciences › Neuroscience › Neurology › Vestibular and auditory disorders
- Keywords
- head direction cells, postsubiculum, spatial firing patterns, firing rate, freely moving rats, head tracking, hippocampal formation
- MeSH terms
- Animals, Electrophysiology, Female, Head, Hippocampus, Neurons, Orientation, Rats, Inbred Strains, Time Factors, Rats
About these checks
Registry, retraction, Cites and statistics results are computed, not judged, with one exception: a printed reference that no index lists is read once by a model before it counts as a citation error. Claims are extracted by a model and kept only when their quote appears verbatim in the text; each cited source is then checked, with a model’s help, for whether it says what the claim relies on. Those verdicts can be wrong — read the claim’s quote and the cited source before relying on one.
Statistics and arithmetic are recomputed, not judged.
Confidence bands are shown only for fields calibrated on our annotated test set. None is calibrated yet, so no band is shown.
What counts as a claim ›How we measure confidence ›How we check this ›
Are you an author, or do you see a problem with this page? Request a review
