

The DOI matches its Crossref record; 29 of the 29 references it cites were found in a registry or an index.
The phase of ongoing oscillations mediates the causal relation between brain excitation and visual perception.
Open accessAbstract
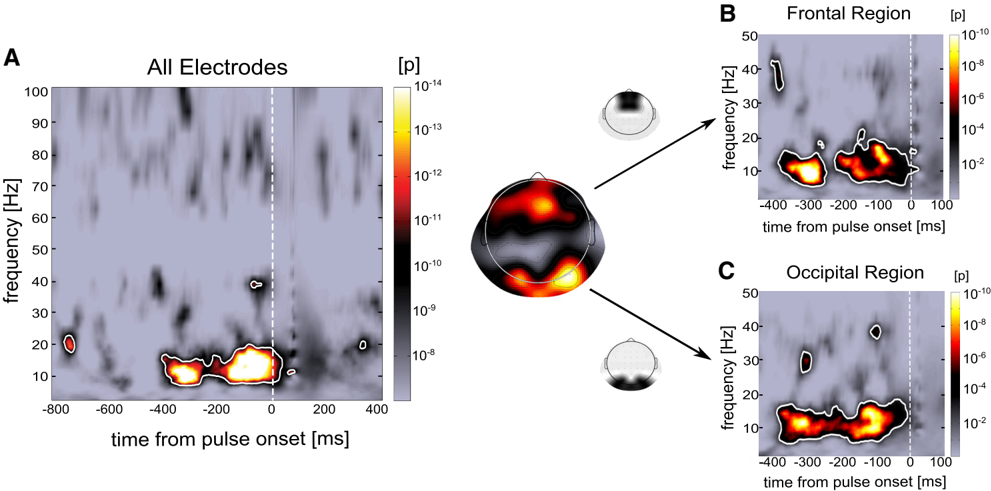
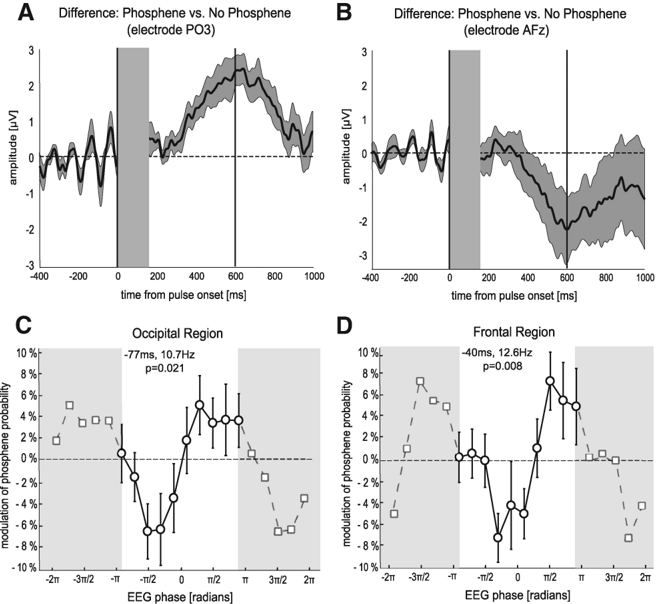
Why does neuronal activity in sensory brain areas sometimes give rise to perception, and sometimes not? Although neuronal noise is often invoked as the key factor, a portion of this variability could also be due to the history and current state of the brain affecting cortical excitability. Here we directly test this idea by examining whether the phase of prestimulus oscillatory activity is causally linked with modulations of cortical excitability and with visual perception. Transcranial magnetic stimulation (TMS) was applied over human visual cortex to induce illusory perceptions (phosphenes) while electroencephalograms (EEGs) were simultaneously recorded. Subjects reported the presence or absence of an induced phosphene following a single pulse of TMS at perceptual threshold. The phase of ongoing alpha (∼10 Hz) oscillations within 400 ms before the pulse significantly covaried with the perceptual outcome. This effect was observed in occipital regions around the site of TMS, as well as in a distant frontocentral region. In both regions, we found a systematic relationship between prepulse EEG phase and perceptual performance: phosphene probability changed by ∼15% between opposite phases. In summary, we provide direct evidence for a chain of causal relations between the phase of ongoing oscillations, neuronal excitability, and visual perception: ongoing oscillations create periodic "windows of excitability," with sensory perception being more likely to occur at specific phases.
Overview
The claims and statistics of this paper haven’t been checked yet.
Run the check — free, no account needed. It reads the open-access text and checks the sources it cites.
Integrity signals
Registry
Cites
Statistics
Figures
Verification
Claims the paper makes
The claims and statistics of this paper haven’t been checked yet.
Run the check — free, no account needed. It reads the open-access text and checks the sources it cites.
Claims other papers make about this one
Each is checked against this paper’s own text: does it say what the citing paper says it does?
In the citing paper
“Moreover, it has been shown in humans that there is a causal relationship between cortical excitation and phosphenes perception so that the phase of pre-stimulus oscillatory activity seems linked to visual perception (Dugue et al., 2011)”
From Toward a personalized closed-loop stimulation of the visual cortex: Advances and challenges (2022) · cites this paper as Dugue et al., 2011
In the citing paper
“This has been reported in experiments in rats (Allison-Walker et al., 2020) and using non-invasive transcranial magnetic stimulation (TMS) in sighted humans (Dugue et al., 2011), but the feasibility of LFP phase-locked stimulation with intracortical electrodes in humans still remains unexplored.”
From Toward a personalized closed-loop stimulation of the visual cortex: Advances and challenges (2022) · cites this paper as Dugue et al., 2011
In the citing paper
“it seems that the frequency of ongoing oscillations is around 10 Hz (Dugue et al., 2011)”
From Toward a personalized closed-loop stimulation of the visual cortex: Advances and challenges (2022) · cites this paper as Dugue et al., 2011
Self-check
Percentages, sums and reported differences re-computed from the paper’s own numbers.
The self-check needs the paper’s full text.
Citations
Cites
Neuronal Oscillations in Cortical Networks
Buzsáki, G., & Draguhn, A. (2004) · Science · doi:10.1126/science.1099745 · Cited by 6,576
Rossi, S., Hallett, M., Rossini, P. M., & Pascual-Leone, A. (2009) · Clinical Neurophysiology · doi:10.1016/j.clinph.2009.08.016 · Cited by 5,367
Wassermann, E. M. (1998) · Electroencephalography and Clinical Neurophysiology/Evoked Potentials Section · doi:10.1016/s0168-5597(97)00096-8 · Cited by 2,337
Lakatos, P., Shah, A. S., Knuth, K. H., Ulbert, I., Karmos, G., & Schroeder, C. E. (2005) · Journal of Neurophysiology · doi:10.1152/jn.00263.2005 · Cited by 1,281
The Phase of Ongoing EEG Oscillations Predicts Visual Perception
Busch, N. A., Dubois, J., & VanRullen, R. (2009) · Journal of Neuroscience · doi:10.1523/jneurosci.0113-09.2009 · Cited by 1,208
Fries, P., Nikolić, D., & Singer, W. (2007) · Trends in Neurosciences · doi:10.1016/j.tins.2007.05.005 · Cited by 1,044
Entrainment of Neocortical Neurons and Gamma Oscillations by the Hippocampal Theta Rhythm
Sirota, A., Montgomery, S., Fujisawa, S., Isomura, Y., Zugaro, M., & Buzsáki, G. (2008) · Neuron · doi:10.1016/j.neuron.2008.09.014 · Cited by 1,015
To See or Not to See: Prestimulus α Phase Predicts Visual Awareness
Mathewson, K. E., Gratton, G., Fabiani, M., Beck, D. M., & Ro, T. (2009) · Journal of Neuroscience · doi:10.1523/jneurosci.3963-08.2009 · Cited by 1,011
Prestimulus Oscillatory Activity in the Alpha Band Predicts Visual Discrimination Ability
van Dijk, H., Schoffelen, J., Oostenveld, R., & Jensen, O. B. (2008) · Journal of Neuroscience · doi:10.1523/jneurosci.1853-07.2008 · Cited by 831
Romei, V., Brodbeck, V., Michel, C. M., Amedi, A., Pascual‐Leone, Á., & Thut, G. (2007) · Cerebral Cortex · doi:10.1093/cercor/bhm229 · Cited by 717
Cited by
Sorted by citations
Items 201–300 of 366
Pre- and post-stimulus EEG patterns associated with the touch-induced illusory flash
van Erp, J. B. F., Philippi, T. G., de Winkel, K. N., & Werkhoven, P. J. (2014) · Neuroscience Letters · doi:10.1016/j.neulet.2014.01.010 · Cited by 16
Chang, C.-F., Liang, W., Lai, C., Hung, D. L., & Juan, C.-H. (2016) · Frontiers in Human Neuroscience · doi:10.3389/fnhum.2016.00264 · Cited by 16
No evidence for a single oscillator underlying discrete visual percepts
Morrow, A., & Samaha, J. (2021) · European Journal of Neuroscience · doi:10.1111/ejn.15362 · Cited by 15
“Moreover, the phase of ongoing alpha activity predicts perception of near-threshold visual stimuli (Alexander et al., 2020; Busch et al., 2009; Dugué et al., 2011; Mathewson et al., 2009; Samaha et al., 2015, 2017; Sherman et al., 2016).”
BackgroundRailo, H., Andersson, E., Kaasinen, V., Laine, T., & Koivisto, M. (2014) · Brain stimulation · doi:10.1016/j.brs.2014.01.060 · Cited by 15
The influence of spontaneous brain oscillations on apparent motion perception
Sanders, L. L. O., Auksztulewicz, R., Hohlefeld, F. U., Busch, N. A., & Sterzer, P. (2014) · NeuroImage · doi:10.1016/j.neuroimage.2014.07.065 · Cited by 15
“Notably, ongoing alpha oscillations have been causally linked with modulations of cortical excitability and forthcoming visual perception (Dugue et al., 2011; Romei et al., 2008, 2010).”
Ongoing brain rhythms shape I-wave properties in a computational model
Schaworonkow, N., & Triesch, J. (2018) · Brain stimulation · doi:10.1016/j.brs.2018.03.010 · Cited by 14
Precise Spiking Motifs in Neurobiological and Neuromorphic Data
Grimaldi, A., Gruel, A., Besnainou, C., Jérémie, J.-N., Martinet, J., & Perrinet, L. (2022) · Brain Sciences · doi:10.3390/brainsci13010068 · Cited by 16
“More generally, it can be shown that the phase of alpha oscillations (about 10 Hz) is causally linked with modulations of cortical excitability and with visual perception [82].”
BackgroundWilliams, J. G., Harrison, W. J., Beale, H. A., Mattingley, J. B., & Harris, A. M. (2024) · Current Biology · doi:10.1016/j.cub.2024.03.014 · Cited by 15
Emadi, N., Rajimehr, R., & Esteky, H. (2014) · Frontiers in Systems Neuroscience · doi:10.3389/fnsys.2014.00218 · Cited by 13
“The proportion of the distribution that exceeded the real value was determined as the P-value.”
BackgroundMethodInfluentialTabarelli, D., Brancaccio, A., Zrenner, C., & Belardinelli, P. (2022) · Brain Sciences · doi:10.3390/brainsci12030348 · Cited by 13
“Moreover, it has been shown that the conscious perception of a visual stimulus not only depends on alpha phase in the occipital cortex but also on that in fronto-central regions at the moment of stimulation [7,12] this would be in line with the idea of the frontal control network allowing access to a conscious percept…”
BackgroundWhat goes up must come down: EEG phase modulates auditory perception in both directions
Rufin Vanrullen, A., & McLelland, D. (2013) · Frontiers in Psychology · doi:10.3389/fpsyg.2013.00016 · Cited by 13
“…Hz) frequency ranges—is closely related to visual perception (Busch et al., 2009; Mathewson et al., 2009; Busch and VanRullen, 2010; Drewes and VanRullen, 2011; Dugue et al., 2011; VanRullen et al., 2011; Chakravarthi and VanRullen, 2012; Hamm et al., 2012; Romei et al., 2012; Schyns et al., 2012).”
BackgroundGlobal and local oscillatory entrainment of visual behavior across retinotopic space
Sokoliuk, R., & Rufin Vanrullen, A. (2016) · Scientific Reports · doi:10.1038/srep25132 · Cited by 13
Pre-stimulus brain state predicts auditory pattern identification accuracy
Hansen, N. E., Harel, A., Iyer, N., Simpson, B. D., & Wisniewski, M. G. (2019) · NeuroImage · doi:10.1016/j.neuroimage.2019.05.054 · Cited by 13
Zhang, M., & Frӧhlich, F. (2022) · Brain stimulation · doi:10.1016/j.brs.2022.02.014 · Cited by 13
“Additional experiments targeting pyramidal cells and interneurons in the sensory and 485 motor cortices will elucidate the role of alpha oscillations in those regions and provide more comparable 486 results to human TMS studies, where the visual [14, 15] and motor cortices [40-42, 44, 60, 70] were the 487 primary targ…”
BackgroundResultInfluentialTwo distinct neural mechanisms in early visual cortex determine subsequent visual processing
Jacobs, C., de Graaf, T. A., & Sack, A. T. (2014) · Cortex · doi:10.1016/j.cortex.2014.06.017 · Cited by 13
Electroencephalography During Transcranial Magnetic Stimulation: Current Modus Operandi
Vernet, M., & Thut, G. (2014) · Neuromethods · doi:10.1007/978-1-4939-0879-0_11 · Cited by 15
The direction and timing of theta and alpha traveling waves modulate human memory processingPreprint
Mohan, U. R., Zhang, H., & Jacobs, J. (2022) · bioRxiv (Cold Spring Harbor Laboratory) · doi:10.1101/2022.02.07.479466 · Cited by 13
Melcón, M., Stern, E., Kessel, D., Arana, L., Poch, C., Campo, P., & Capilla, A. (2024) · Psychophysiology · doi:10.1111/psyp.14525 · Cited by 18
Rhythmic fluctuations of saccadic reaction time arising from visual competition
Chota, S., Luo, C., Crouzet, S. M., Boyer, L. E., Kienitz, R., Schmid, M. C., & Rufin Vanrullen, A. (2018) · Scientific Reports · doi:10.1038/s41598-018-34252-7 · Cited by 12
Pre-stimulus alpha oscillations encode stimulus-specific visual predictionsPreprint
Hetenyi, D., Haarsma, J., & Kok, P. (2024) · bioRxiv (Cold Spring Harbor Laboratory) · doi:10.1101/2024.03.13.584593 · Cited by 12
Tseng, C., Chen, J., & Hsu, S. (2023) · eNeuro · doi:10.1523/eneuro.0128-23.2023 · Cited by 10
“Although supporting evidence has shown that hits (detected stimuli) or misses (undetected stimuli) are preferentially locked to distinct a phase angles during visual detection tasks (Busch et al., 2009; Mathewson et al., 2009; Dugué et al., 2011; Helfrich et al., 2014; Jaegle and Ro, 2014), contrasting evidence has al…”
BackgroundArousal States as a Key Source of Variability in Speech Perception and Learning
Schuerman, W. L., Chandrasekaran, B., & Leonard, M. K. (2022) · Languages · doi:10.3390/languages7010019 · Cited by 11
“With regards to visual perception, prestimulus alpha phase has been shown to predict whether or not phosphenes (visual sensations perceived in the absence of an evoking stimulus) will be induced by transcranial magnetic stimulation (Laura Dugue et al. 2011).”
BackgroundRamsay, I. S., Pokorny, V., Lynn, P. A., Klein, S. D., & Sponheim, S. R. (2023) · Biological Psychiatry Cognitive Neuroscience and Neuroimaging · doi:10.1016/j.bpsc.2023.02.001 · Cited by 11
Occipital TMS at phosphene detection threshold captures attention automatically
Rangelov, D., Müller, H. J., & Taylor, P. C. J. (2015) · NeuroImage · doi:10.1016/j.neuroimage.2015.01.035 · Cited by 11
“Further, pre-pulse brain excitability can predict whether or not a phosphene is seen (Dugué et al., 2011; Romei et al., 2008), with brain excitability indexed in terms of power of alpha (8–12 Hz) oscillations in visual areas (where higher alpha power indicates lower excitability; e.g., Hanslmayr et…”
BackgroundAlpha-band Brain Dynamics and Temporal Processing: An Introduction to the Special Focus
Samaha, J., & Romei, V. (2024) · Journal of Cognitive Neuroscience · doi:10.1162/jocn_a_02105 · Cited by 10
“…kind of inhibitory process (Dou, Morrow, Iemi, & Samaha, 2022; Iemi et al., 2019, 2022; Samaha, Iemi, Haegens, & Busch, 2020; Haegens et al., 2014; Dugué, Marque, & VanRullen, 2011; Foxe & Snyder, 2011; Klimesch, 2011; Mathewson et al., 2011; Jensen & Mazaheri, 2010; Romei et al., 2008; Klimesch,…”
Locally Induced Traveling Waves Generate Globally Observable Traveling Waves
Petras, K., Grabot, L., & Dugué, L. (2025) · Journal of Neuroscience · doi:10.1523/jneurosci.0089-25.2025 · Cited by 10
Schwenk, J. C. B., & Alamia, A. (2025) · PLoS Computational Biology · doi:10.1371/journal.pcbi.1013294 · Cited by 7
Just a phase? Causal probing reveals spurious phasic dependence of sustained attention
Vinao-Carl, M., Gal-Shohet, Y., Rhodes, E., Li, J. V., Hampshire, A., Sharp, D. J., & Grossman, N. (2023) · NeuroImage · doi:10.1016/j.neuroimage.2023.120477 · Cited by 12
“…perception fluctuates with the phase of pre-stimulus oscillations (Benedetto and Morrone, 2019; Busch et al., 2009; Busch and VanRullen, 2010; Dugue et al., 2011; Fellinger et al., 2011; Foster et al., 2017; Gould et al., 2011; Hanslmayr et al., 2007; Himmelstoss et al., 2015; Jansen and…”
Improving N1 classification by grouping EEG trials with phases of pre-stimulus EEG oscillations
Li, H., Zhang, L., Jiacai, Z., Changming, W., Yao, L., Wu, X., & Guo, X. (2014) · Cognitive Neurodynamics · doi:10.1007/s11571-014-9317-x · Cited by 10
Baumgarten, T. J., Schnitzler, A., & Lange, J. (2017) · Frontiers in Psychology · doi:10.3389/fpsyg.2017.00421 · Cited by 11
“Several studies have shown that the phase of neuronal oscillations is linked to perception and behavior (Busch et al., 2009; Dugué et al., 2011; Landau et al., 2015; Gundlach et al., 2016).”
BackgroundMensen, A., Marshall, W., Sasai, S., & Tononi, G. (2018) · Journal of Cognitive Neuroscience · doi:10.1162/jocn_a_01278 · Cited by 10
Postdiction: When Temporal Regularity Drives Space Perception through Prestimulus Alpha Oscillations
Grabot, L., Kayser, C., & van Wassenhove, V. (2021) · eNeuro · doi:10.1523/eneuro.0030-21.2021 · Cited by 15
“…phase of low-frequency oscillations has previously been reported to influence the perception of upcoming stimuli (Busch et al., 2009; Mathewson et al., 2009) and illusory perception more generally (Dugué et al., 2011; Chakravarthi and VanRullen, 2012; Lange et al., 2014; Samaha and Postle, 2015).”
BackgroundLin, S.-H. N., Lien, Y. R., Shibata, K., Sasaki, Y., Watanabe, T., Lin, C.-P., & Chang, L.-H. (2023) · Scientific Reports · doi:10.1038/s41598-023-32985-8 · Cited by 9
ten Oever, S., Titone, L., Rietmolen, N. T., & Martin, A. E. (2024) · Proceedings of the National Academy of Sciences · doi:10.1073/pnas.2320489121 · Cited by 9
“Most studies investigating the direct link between ongoing oscillatory phase and behavior have focused on assessing the role of oscillatory phase in modulating overall performance measures, such as accuracy (8, 35), detection (4, 5, 36), or reaction times (37).”
Cortical Sensitivity to Guitar Note Patterns: EEG Entrainment to Repetition and Key
Bridwell, D. A., Leslie, E., McCoy, D. Q., Plis, S., & Calhoun, V. D. (2017) · Frontiers in Human Neuroscience · doi:10.3389/fnhum.2017.00090 · Cited by 9
“Previous studies indicate that stimuli are better detected when their onset aligns with the phase of EEG oscillations (Mathewson et al., 2009; Dugue et al., 2011; Neuling et al., 2012; Song et al., 2014), when neurons tuned to stimulus features are at their most excitable state (Lakatos et al.,…”
BackgroundReward makes the rhythmic sampling of spatial attention emerge earlier
Su, Z., Wang, L., Kang, G., & Zhou, X. (2021) · Attention Perception & Psychophysics · doi:10.3758/s13414-020-02226-5 · Cited by 7
Fong, C. Y., Law, W. H. C., Fahrenfort, J. J., Braithwaite, J. J., & Mazaheri, A. (2022) · The Journal of Headache and Pain · doi:10.1186/s10194-022-01410-2 · Cited by 11
“phosphenes.[54] In these visual experiments, researchers found that the phase angle and 367”
BackgroundVisual cortex responds to sound onset and offset during passive listening
Brang, D., Plass, J., Sherman, A., Stacey, W. C., Wasade, V. S., Grabowecky, M., Ahn, E., Towle, V. L., Tao, J. X., Wu, S., et al. (2022) · Journal of Neurophysiology · doi:10.1152/jn.00164.2021 · Cited by 11
Alpha frequency shapes perceptual sensitivity by modulating optimal phase likelihood
Romei, V., & Tarasi, L. (2026) · Nature Communications · doi:10.1038/s41467-026-70124-9 · Cited by 9
“Speci fi cally, the hypothesis isbased on compelling evidence showing thattheaccuracy of decision-making relies on the precise phase of alpha waves during theperi-stimulusperiod 20 – 22 .”
Distinct alpha networks modulate different aspects of perceptual decision-making
Zhou, Y. J., van Es, M. W. J., & Haegens, S. (2025) · PLoS Biology · doi:10.1371/journal.pbio.3003461 · Cited by 8
Nazarova, M. A., Blagoveschenskiy, E. D., Nikulin, V. V., & Mitina, M. (2018) · Neuromuscular Diseases · doi:10.17650/2222-8721-2017-7-4-20-32 · Cited by 8
Spatially Specific Attention Mechanisms Are Sensitive to Competition during Visual Search
Yeh, L.-C., Yeh, Y., & Kuo, B.-C. (2019) · Journal of Cognitive Neuroscience · doi:10.1162/jocn_a_01418 · Cited by 8
Effect of temporal frequency on habituation in migraine
Sharp, A., Föcker, J., & O’Hare, L. (2023) · European Journal of Neuroscience · doi:10.1111/ejn.15949 · Cited by 8
“Specifically, there have been demonstrable effects of the importance of the phase of the ongoing alpha-band oscillations at the time of stimulus onset for perception (e.g., Dugué et al., 2011; Ergenoglu et al., 2004; Hanslmayr et al., 2005; Hanslmayr et al., 2007).”
BackgroundNoguchi, Y., Xia, Y. X., & Kakigi, R. (2019) · NeuroImage · doi:10.1016/j.neuroimage.2019.02.027 · Cited by 8
“It was previously shown that the phase of alpha rhythm in a pre-stimulus interval exerted a significant influence on perceptual outcome of that stimulus (Dugue et al., 2011).”
Bertrand, J. K., Wispinski, N. J., Mathewson, K. E., & Chapman, C. S. (2018) · Scientific Reports · doi:10.1038/s41598-018-24215-3 · Cited by 8
The rhythm of attentional stimulus selection during visual competitionPreprint
Crouzet, S. M., & Rufin Vanrullen, A. (2017) · bioRxiv (Cold Spring Harbor Laboratory) · doi:10.1101/105239 · Cited by 8
“, 2015) while more perceptual processes would rather operate at around 10 Hz (Dugué et al., 2011; Dugué & VanRullen, 2014; Macdonald et al., 2014).”
BackgroundA precision medicine approach to repetitive Transcranial Magnetic Stimulation (rTMS)
Leuchter, A. F., & Corlier, J. (2018) · Brain stimulation · doi:10.1016/j.brs.2018.02.003 · Cited by 8
Mentzelopoulos, G., Driscoll, N., Shankar, S., Kim, B., Rich, R., Fernandez-Nuñez, G., Stoll, H., Erickson, B. A., Medaglia, J. D., & Vitale, F. (2023) · Frontiers in Behavioral Neuroscience · doi:10.3389/fnbeh.2023.1176865 · Cited by 8
“Results from multiple independent electroencephalography (EEG) studies involving attention suggest that a relationship exists between attention performance and moment-to-moment neural activity in the θ and α frequency ranges (5–15 Hz) (Busch et al., 2009; Busch and VanRullen, 2010; Drewes and VanRullen, 2011; Dugue et…”
BackgroundMethodInfluentialİşcan, Z., Schurger, A., Vernet, M., Sitt, J. D., & Valero‐Cabré, A. (2018) · Experimental Brain Research · doi:10.1007/s00221-018-5359-3 · Cited by 8
Differential modulation of behavior by infraslow activities of different brain regions
Sihn, D., & Kim, S.-P. (2022) · PeerJ · doi:10.7717/peerj.12875 · Cited by 8
Linking Nonlinear Neural Dynamics to Single‐Trial Human Behavior
Cohen, M. X., & Voytek, B. (2013) · Wiley eBooks · doi:10.1002/9783527671632.ch09 · Cited by 7
“…specific BLOCKIN BLOCKIN neural BLOCKIN BLOCKIN configurations, BLOCKIN BLOCKIN such BLOCKIN BLOCKIN as BLOCKIN BLOCKIN specific BLOCKIN BLOCKIN oscillation BLOCKIN BLOCKIN phase BLOCKIN BLOCKIN values BLOCKIN BLOCKIN or specific patterns of cross-‐frequency interactions (Dugue et al., 2011).”
BackgroundSchuler, A., Tik, M., Kallioniemi, E., Marti, A. S., Cai, Z., & Pellegrino, G. (2025) · Neuroscience & Biobehavioral Reviews · doi:10.1016/j.neubiorev.2025.106338 · Cited by 6
Mackenzie, A. K., Baker, J., Daly, R. C., & Howard, C. J. (2024) · Brain and Behavior · doi:10.1002/brb3.3434 · Cited by 6
“…cycles hypothesis of brain function, at posterior sites where visual processing occurs, ithasbeenarguedthatalphaoscillationsreflectdiscretetemporalsam-pling in vision (Dugué et al., 2011; VanRullen, 2016) whereby periodic phases of visual inhibition are followed by periods of visual sampling.”
Backgroundvan der Plas, M., Roux, F., Chelvarajah, R., Sawlani, V., Staresina, B. P., Wimber, M., Rollings, D. T., & Hanslmayr, S. (2025) · Brain stimulation · doi:10.1016/j.brs.2025.09.010 · Cited by 6
Sadeh, B., Szczepanski, S. M., & Knight, R. T. (2014) · Elsevier eBooks · doi:10.1016/b978-0-12-398451-7.00021-x · Cited by 7
Combining NIBS with EEG: What Can It Tell Us About Normal Cognition?
Taylor, P. C. J. (2018) · Current Behavioral Neuroscience Reports · doi:10.1007/s40473-018-0153-x · Cited by 7
Stimulus probability affects the visual N700 component of the event-related potential
Althen, H., Banaschewski, T., Brandeis, D., & Bender, S. (2019) · Clinical Neurophysiology · doi:10.1016/j.clinph.2019.11.059 · Cited by 7
Expectance of low contrast retro-cues does not modulate anticipatory alpha power
Macedo-Pascual, J., Campo, P., Capilla, A., Hinojosa, J. A., & Poch, C. (2022) · Biological Psychology · doi:10.1016/j.biopsycho.2022.108400 · Cited by 6
Human Brain Oscillations: From Physiological Mechanisms to Analysis and Cognition
Jensen, O. B., Spaak, E., & Zumer, J. M. (2019) · Springer eBooks · doi:10.1007/978-3-319-62657-4_17-1 · Cited by 9
Pre-stimulus brain states predict and control variability in stimulation responses
Rabuffo, G., Angiolelli, M., Fukai, T., Deco, G., Sorrentino, P., & Momi, D. (2026) · Brain stimulation · doi:10.1016/j.brs.2026.103118 · Cited by 8
Bypassing input to V1 in visual awareness: A TMS-EROS investigation
Knight, R. S., Chen, T., Gratton, G., Fabiani, M., Savazzi, S., Mazzi, C., & Beck, D. M. (2024) · Neuropsychologia · doi:10.1016/j.neuropsychologia.2024.108864 · Cited by 6
Kawashima, T., Hayashi, M. J., & Amano, K. (2022) · bioRxiv (Cold Spring Harbor Laboratory) · doi:10.1101/2022.04.15.488436 · Cited by 4
“The reference time-point for each frequency band was defined by the time of observed minimum p-values (maximum significance) for the power (Dugué et al., 2011).”
BackgroundMethodThe Inattentional Rhythm in Audition
Lui, T. K., Boglietti, E., & Zoefel, B. (2025) · Journal of Neuroscience · doi:10.1523/jneurosci.1544-24.2025 · Cited by 4
Pushkin, A. A., Lysenko, L. V., Сухов, А. Г., Владленович, В. А., & Щербань, И. В. (2017) · Biomedical Engineering · doi:10.1007/s10527-017-9678-7 · Cited by 4
Phosphene Attributes Depend on Frequency and Intensity of Retinal tACS
Kvašňák, E., Orendáčová, M., & Vránová, J. (2022) · Physiological Research · doi:10.33549/physiolres.934887 · Cited by 4
“There are several studies that have found a link between phosphenes perception and EEG amplitude [10], phase [31], and frequency [10, 32].”
Prestimulus Alpha Phase Modulates Visual Temporal Integration
Johannknecht, M., Schnitzler, A., & Lange, J. (2024) · eNeuro · doi:10.1523/eneuro.0471-23.2024 · Cited by 4
“The reported performance effects (decreasing when deviating from the preferred phase) are smaller compared with other studies ( ∼ 7% difference between highest and lowest bin compared with ∼ 13%; Busch et al., 2009; Dugue et al., 2011; Baumgarten et al., 2015; Fakche et al., 2022).”
Rutiku, R., Einberg, A., Imanaka, K., & Bachmann, T. (2013) · European Journal of Neuroscience · doi:10.1111/ejn.12374 · Cited by 4
“This view is strengthened by results showing that phosphenes are more likely to be perceived if TMS is applied at a time when alpha power is low (Romei et al., 2008) or when its phase is optimal (Dugu e et al., 2011).”
BackgroundInfluentialTranscranial brain stimulation and EEG/MEG
Bergmann, T. O., Tomasevic, L., & Siebner, H. R. (2021) · Oxford University Press eBooks · doi:10.1093/oxfordhb/9780198832256.013.26 · Cited by 3
Individual alpha frequency appears unrelated to the latency of early visual responses
Morrow, A., Dou, W., & Samaha, J. (2023) · Frontiers in Neuroscience · doi:10.3389/fnins.2023.1118910 · Cited by 4
“This account would be consistent with a growing body of literature demonstrating that alpha-band phase modulates perceptual detection (Busch et al., 2009; Mathewson et al., 2009; Dugué et al., 2011; Ai and Ro, 2014; Samaha et al., 2015, 2017; Alexander et al., 2020) and neuronal responses (Haegens et al.”
ResultThe role of neural oscillations in visuo-motor communication at the time of saccades
Burr, D. C., & Morrone, M. C. (2023) · Neuropsychologia · doi:10.1016/j.neuropsychologia.2023.108682 · Cited by 4
Advances and Challenges in Transcranial Magnetic Stimulation (TMS) Research on Motor Systems
Chen, M., Cline, C. C., Frost, K. L., Kimberley, T. J., Nemanich, S. T., Gillick, B. T., Albott, C. S., Prudente, C. N., Lim, K. O., & He, B. (2018) · Elsevier eBooks · doi:10.1016/b978-0-12-813068-1.00011-7 · Cited by 4
Neuronal synchrony and the relation between the BOLD response and the local field potentialPreprint
Winawer, J. A., Nguyen, M., & Hermes, D. (2016) · bioRxiv (Cold Spring Harbor Laboratory) · doi:10.17605/osf.io/v22bm · Cited by 4
Lin, Y.-J., Shukla, L., Dugué, L., Valero‐Cabré, A., & Carrasco, M. (2021) · Research Square · doi:10.21203/rs.3.rs-574152/v1 · Cited by 4
“In the visual cortex, the parieto-occipital alpha-band phase correlates with baseline cortical 71 excitability (phosphene threshold) [12], gamma-band (40-100 Hz) power [13], and spiking 72”
BackgroundContents of Visual Predictions Oscillate at Alpha Frequencies
Hetenyi, D., Haarsma, J., & Kok, P. (2025) · Journal of Neuroscience · doi:10.1523/jneurosci.0474-25.2025 · Cited by 4
“…fl uence performance in visual tasks (Ergenoglu et al., 2004; van Dijk et al., 2008; Busch et al., 2009; Mathewson et al., 2009; Romei et al., 2010; Dugué et al., 2011; VanRullen et al., 2011; Hanslmayr et al., 2013; Iemi et al., 2019) and have been found to vary with experimental manipulations…”
Temporal basis function models for closed-loop neural stimulation
Bryan, M. J., Schwock, F., Yazdan-Shahmorad, A., & Rao, R. P. N. (2025) · Journal of Neural Engineering · doi:10.1088/1741-2552/ae036a · Cited by 7
“As above, the controller assumes the stimulation will be applied after a delay of 20ms and must decide whether to apply stimulation or not at the current time point based on how close a predicted trajectory will be to the reference trajectory.”
Yang, F., Yuan, P., Shen, L., Zhou, K., He, S., & Jiang, Y. (2025) · Nature Communications · doi:10.1038/s41467-025-64987-7 · Cited by 3
Redding, Z. V., Ding, Y., & Fiebelkorn, I. C. (2026) · PLoS Biology · doi:10.1371/journal.pbio.3003664 · Cited by 4
Temporal Integration of Motion Streaks in Migraine
O’Hare, L. (2018) · Vision · doi:10.3390/vision2030027 · Cited by 3
“The alpha band oscillations provide a "‘window of excitability" [52]; if 209 alpha power is high at stimulus onset, then it is unlikely to be perceived, conversely, if occipital alpha 210 power is low at stimulus onset then it is more likely to be perceived [53] [54] [55].”
BackgroundPerceptual Illusions Caused by Discrete Sampling
Sokoliuk, R., & Rufin Vanrullen, A. (2019) · Springer eBooks · doi:10.1007/978-3-030-22048-8_17 · Cited by 3
Evidence for a theta‐band behavioural oscillation in rapid face detection
Liu, X., Balestrieri, E., & Melcher, D. (2022) · European Journal of Neuroscience · doi:10.1111/ejn.15790 · Cited by 3
Vossen, A. Y. (2017) · Enlighten: Theses (The University of Glasgow) · Cited by 4
Attention enhances LFP phase coherence in macaque visual cortex, improving sensory processingPreprint
Zareian, B., Daliri, M. R., Maboudi, K., Moghaddam, H. A., Treue, S., & Esghaei, M. (2018) · bioRxiv (Cold Spring Harbor Laboratory) · doi:10.1101/499756 · Cited by 3
“Interestingly, it has been shown that pre-stimulus brain activity causally determines visual perception (Dugué et al., 2011).”
BackgroundHebron, H., Lugli, B., Dimitrova, R., Jaramillo, V., Rhodes, E., Grossman, N., Dijk, D., & Violante, I. R. (2022) · bioRxiv (Cold Spring Harbor Laboratory) · doi:10.1101/2022.11.15.512722 · Cited by 3
“In this scenario, pre-trough locked sounds arrived at a more suitable phase at which to perturb the brain and in consequence the sleep process, in a similar vein to the cyclic excitability put forward in the visual neuroscience literature [5,6,8,14,15,52,53,59].”
BackgroundHarris, A. M., & Beale, H. A. (2024) · bioRxiv (Cold Spring Harbor Laboratory) · doi:10.1101/2024.08.22.609278 · Cited by 3
“…grew out of findings that the phase of rhythmic brain activity (i.e., whether brain waves are at a peak or trough) influenced neural processing and perception (Busch et al., 2009; Dugué et al., 2011; Haegens et al., 2011; Harris et al., 2018; Mathewson et al., 2009; Williams et al., 2024).”
BackgroundChatroudi, A. H., & Yotsumoto, Y. (2023) · European Journal of Neuroscience · doi:10.1111/ejn.16071 · Cited by 2
“In recent years, in addition to studies that have reported positive findings (e.g., Busch et al., 2009; de Graaf et al., 2013; Dugué et al., 2011; Fakche et al., 2022; Mathewson et al., 2009; Ronconi et al., 2018), there has been a trend in reporting null results regarding the role of inhibitory…”
BackgroundResultMathematical Psychiatry: On Cortical Spreading Depression—A Review
Nsugbe, E. (2023) · Brain Sciences · doi:10.3390/brainsci13091241 · Cited by 2
Reavis, E. A., Wynn, J. K., & Green, M. F. (2024) · Schizophrenia Research · doi:10.1016/j.schres.2024.08.016 · Cited by 2
Grani, F., Soto‐Sánchez, C., Doblado, A. R., Grima, M. D., Farfán, F. D., Calvo, M. V., Soo, L., Wacławczyk, D., Ferrandez, J., González, P., et al. (2022) · Lecture notes in computer science · doi:10.1007/978-3-031-06242-1_51 · Cited by 2
Recognizing an Object from the Sum of Its Parts: An Intracranial Study on Alpha Rhythms
Bertrand, J., Tremblay, J., Lassonde, M. C., Vannasing, P., Nguyen, D. K., Robert, M., Bouthillier, A., & Leporé, F. (2014) · Journal of Cognitive Neuroscience · doi:10.1162/jocn_a_00582 · Cited by 2
“This is speculative but relates to the resonance concept proposed by Grossberg (1995) and to Bar et al.”
The neurodynamic bases of imitating learning and episodic memory
Давидович, Ц. В. (2016) · BIOPHYSICS · doi:10.1134/s0006350916020226 · Cited by 2
Oscillations and Synchrony in Attention
Keitel, C., Thut, G., & Groß, J. (2020) · Springer eBooks · doi:10.1007/978-1-0716-0653-7_3 · Cited by 2
Callaghan, E., Holland, C., & Kessler, K. (2018) · Lancaster EPrints (Lancaster University) · Cited by 2
Visual Entrainment at 10 Hz causes periodic modulation of the Flash Lag IllusionPreprint
Chota, S., & Rufin Vanrullen, A. (2019) · bioRxiv (Cold Spring Harbor Laboratory) · doi:10.1101/515114 · Cited by 2
Neuronal synchrony and the relation between the BOLD response and the local field potentialPreprint
Hermes, D., Nguyen, M., & Winawer, J. A. (2016) · bioRxiv (Cold Spring Harbor Laboratory) · doi:10.1101/083840 · Cited by 2
“This is consistent with the observations that the threshold for eliciting a phosphene with TMS changes with alpha phase [72,73] and that the alpha phase at the time of stimulus presentation influences the size of the BOLD response in visual cortex [74].”
ResultTranscranial magnetic stimulation to frontal but not occipital cortex disrupts endogenous attentionPreprint
Fernández, A., Hanning, N. M., & Carrasco, M. (2022) · bioRxiv (Cold Spring Harbor Laboratory) · doi:10.1101/2022.11.01.514715 · Cited by 2
Brickwedde, M., Limachya, R., Markiewicz, R., Sutton, E., Postzich, C., Shapiro, K. L., Jensen, O. B., & Mazaheri, A. (2022) · bioRxiv (Cold Spring Harbor Laboratory) · doi:10.1101/2022.04.19.488727 · Cited by 2
“Alpha inhibition is believed to be transmitted in a phasic manner, as phosphene perception as well as high-frequency and spiking activity vary in line with the alpha cycle (Dugué et al., 2011; Haegens et al., 2011; Spaak et al., 2012).”
BackgroundBrickwedde, M., Limachya, R., Markiewicz, R., Sutton, E., Postzich, C., Shapiro, K. L., Jensen, O. B., & Mazaheri, A. (2025) · eLife · doi:10.7554/elife.106050.1 · Cited by 2
Brickwedde, M., Limachya, R., Markiewicz, R., Sutton, E., Postzich, C., Shapiro, K. L., Jensen, O. B., & Mazaheri, A. (2025) · eLife · doi:10.7554/elife.106050.3 · Cited by 2
Phase-Dependent EEG Decoding of Continuous Visual StimuliPreprint
Deodato, M., & Melcher, D. (2025) · bioRxiv (Cold Spring Harbor Laboratory) · doi:10.1101/2025.11.10.687532 · Cited by 2
Neural oscillatory dynamics of spoken word recognition
Strauß, A. (2015) · Cited by 2
Metadata
- Authors
- Dugué, L., Marque, P., & VanRullen, R.
- Affiliations
- Centre National de la Recherche Scientifique (FR)
- ORCID
- Dugué, Laura
- Venue
- The Journal of Neuroscience
- Publisher
- Society for Neuroscience
- Published
- 2011-08-17
- Volume
- 31
- Issue
- 33
- Pages
- 11889-11893
- ISSN
- 0270-6474 (ISSN-L)
- 1529-2401
- PMC
- PMC6623205
- OpenAlex
- W2003309602
- Cited by
- 364
- References
- 29
- Citations by year
- 2026: 20 · 2025: 25 · 2024: 19 · 2023: 17 · 2022: 26 · 2021: 21 · 2020: 19 · 2019: 27 · 2018: 36 · 2017: 40 · 2016: 28 · 2015: 21 · 2014: 23 · 2013: 21 · 2012: 18
- FWCI
- 10.40
- Type
- journal article
- Language
- en
- Open access
- hybrid
- doi.org
- Licence
- Locations
- Journal of Neuroscience (publishedVersion, cc-by-nc-sa)
- Europe PMC (PubMed Central) (publishedVersion)
- PubMed Central (publishedVersion)
- PubMed (publishedVersion)
- HAL (submittedVersion)
- Topics
- Life Sciences › Neuroscience › Cognitive Neuroscience › Neural dynamics and brain function
- Life Sciences › Neuroscience › Neurology › Transcranial Magnetic Stimulation Studies
- Life Sciences › Neuroscience › Cognitive Neuroscience › Visual perception and processing mechanisms
- Keywords
- EEG phase, alpha oscillations, cortical excitability, visual perception, phosphenes, transcranial magnetic stimulation, illusory perception, neural noise, perceptual thresholds, visual cortex
- MeSH terms
- Adult, Alpha Rhythm, Electroencephalography, Female, Humans, Male, Phosphenes, Photic Stimulation, Visual Cortex, Visual Perception, Transcranial Magnetic Stimulation, Young Adult
About these checks
Registry, retraction, Cites and statistics results are computed, not judged, with one exception: a printed reference that no index lists is read once by a model before it counts as a citation error. Claims are extracted by a model and kept only when their quote appears verbatim in the text; each cited source is then checked, with a model’s help, for whether it says what the claim relies on. Those verdicts can be wrong — read the claim’s quote and the cited source before relying on one.
Statistics and arithmetic are recomputed, not judged.
Confidence bands are shown only for fields calibrated on our annotated test set. None is calibrated yet, so no band is shown.
What counts as a claim ›How we measure confidence ›How we check this ›
Are you an author, or do you see a problem with this page? Request a review
