Cited by 219

The DOI matches its Crossref record; 2 of the 2 references it cites were found in a registry or an index.

Development of local circuits in human visual cortex

Burkhalter, A, Bernardo, KL, Charles, V·1993·The Journal of Neuroscience

Abstract

How we see the world largely depends on the organization of neuronal circuits in visual cortex. Physiological recordings in mammals indicate that circuits develop over a period that extends well into early postnatal ages (LeVay et al., 1980; Albus and Wolf, 1984). Our understanding of how these circuits are assembled during development is still fragmentary (Katz and Callaway, 1992). Here we describe the development of local connections within visual cortex, using the fluorescent dye 1,1′-dioctadecyl-3,3,3′,3′-tetramethylindocarbocyanine perchlorate to trace axonal projections in post-mortem human brains. Vertical (intracolumnar) connections between layers 2/3 and 5, which link neurons representing the same point in the visual field, develop prenatally at 26–29 weeks gestation. In contrast, horizontal (intercolumnar) connections between different points in the visual field develop later. They first emerge prenatally at approximately 37 weeks gestation within layers 4B and 5. After birth (> 40 weeks gestation) the fiber density increases rapidly, showing a uniform plexus of connections at 7 weeks postnatal. The more adult-like patchiness of the projection, however, emerges after 8 weeks postnatal. Long-range horizontal connections within layer 2/3 develop after the connections within layers 4B, 5, and 6. These connections emerge after 16 weeks postnatal, long after cytochrome oxidase blobs have developed, and reach mature from sometime before 15 months of age. Unlike the patchy horizontal projections within layers 4B and 5, which seem to develop through a process of collateral elimination, long-range projections within layer 2/3 are patchy from the outset and seem to develop with greater topographical precision. The finding that intracolumnar connections develop before intercolumnar projections suggests that circuits that process local features of a visual scene develop before circuits necessary to integrate these features into a continuous and coherent neural representation of an image. In addition, the sequential development of horizontal connections within layer 4B before those within layer 2/3 suggests that circuits that may be related to the processing channel for visual motion develop in advance of those that may be more intimately related to the processing of form, color, and precise stereoscopic depth.

Overview

The claims and statistics of this paper haven’t been checked yet.

Run the check — free, no account needed. It reads the open-access text and checks the sources it cites.

A few free checks a day · papers already verified open instantly · results are public

Integrity signals

Registry

Crossref · 10.1523/jneurosci.13-05-01916.1993

Cites

2 of 2 references verified0 citation errors · 0 not checkable

Statistics

Figures

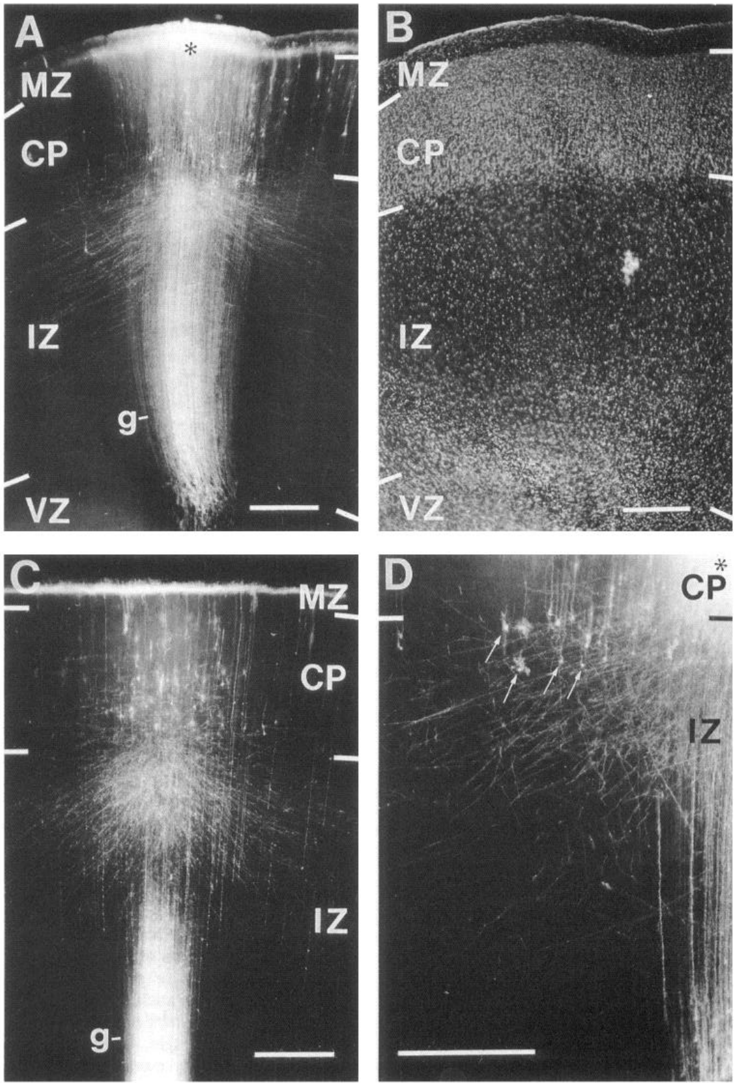
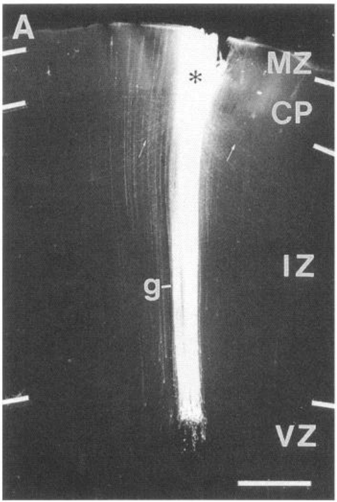
Figure 1 Development of interlaminar connections in human primary visual cortex. A, DiI injection (center is marked with asterisk) into superficial half of CP in 24-week-old fetus: fluorescence photomicrograph of coronal section showing band of radial glial fibers (g) extending from VZ to MZ. Cortical input and output axons traverse IZ obliquely. In CP most fibers and cell bodies are immediately below the injection site and horizontal fibers are extremely rare. Labeling in inner half of MZ on both sides of the injection site represents horizontal fibers. B, Section shown in A: fluorescent counterstain with bisbenzimide. CP is not yet differentiated into different layers. C, DiIlabeled cell bodies in CP of 24-weekold fetus after superficial CP injection. Section was taken 0.1 mm from margin of injection site. Descending fibers enter IZ obliquely. D, DiI-labeled subplate cells (arrows) in 24-week-old fetus. Center of injection is marked with asterisk. Scale bars, 0.5 mm.
Figure 1 Development of interlaminar connections in human primary visual cortex. A, DiI injection (center is marked with asterisk) into superficial half of CP in 24-week-old fetus: fluorescence photomicrograph of coronal section showing band of radial glial fibers (g) extending from VZ to MZ. Cortical input and output axons traverse IZ obliquely. In CP most fibers and cell bodies are immediately below the injection site and horizontal fibers are extremely rare. Labeling in inner half of MZ on both sides of the injection site represents horizontal fibers. B, Section shown in A: fluorescent counterstain with bisbenzimide. CP is not yet differentiated into different layers. C, DiIlabeled cell bodies in CP of 24-weekold fetus after superficial CP injection. Section was taken 0.1 mm from margin of injection site. Descending fibers enter IZ obliquely. D, DiI-labeled subplate cells (arrows) in 24-week-old fetus. Center of injection is marked with asterisk. Scale bars, 0.5 mm.CC-BY-NC-SA · From the PDF
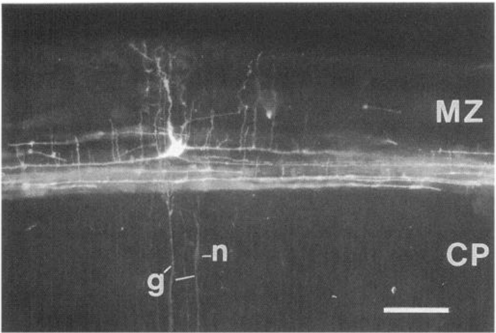
Figure 2 DiI-labeled Cajal-Retzius neuron in inner half of MZ of primary visual cortex of 24-week-old human fetus. Radial glial fibers (g) ascend through the CP and terminate in the inner half of the MZ. Dye transfer from radial glial fibers (g) occasionally gave rise to labeling of migrating neurons (n). Notice that radial glial fiber runs across the weakly labeled neuron. Scale bar, 0.1 mm.
Figure 2 DiI-labeled Cajal-Retzius neuron in inner half of MZ of primary visual cortex of 24-week-old human fetus. Radial glial fibers (g) ascend through the CP and terminate in the inner half of the MZ. Dye transfer from radial glial fibers (g) occasionally gave rise to labeling of migrating neurons (n). Notice that radial glial fiber runs across the weakly labeled neuron. Scale bar, 0.1 mm.CC-BY-NC-SA · From the PDF
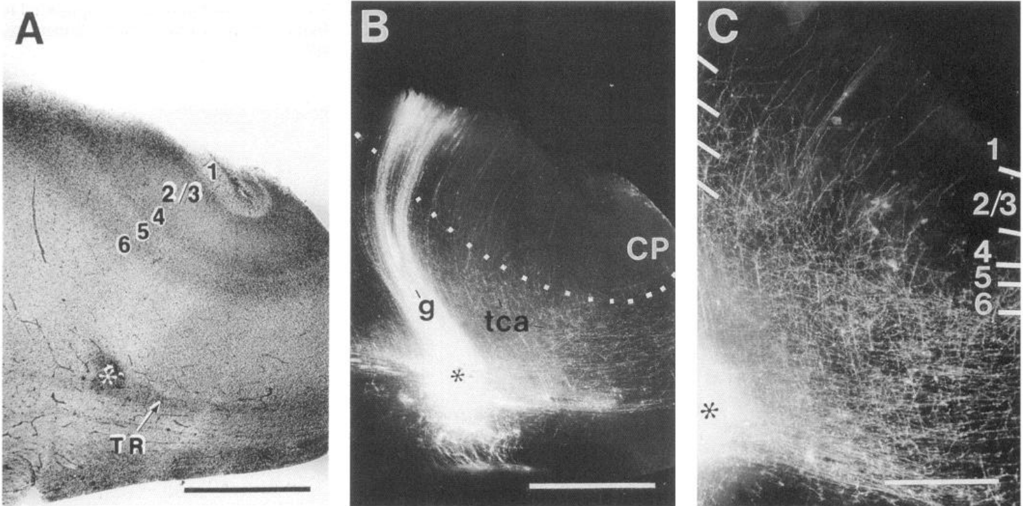
Figure 3 Dil injection into thalamic radiation (TR) below primary visual cortex of 26-week-old human fetus. A, Bright-field photomicrograph of unstained coronal section through calcarine sulcus showing injection site (asterisk) and emerging layers of CP. B, Section shown in A viewed under fluorescence illumination. DiI labeled radial glial fibers (g) spanning between VZ and layer 1. Radially and obliquely oriented putative thalamocortical afferents (tca) enter CP. Center of injection in thalamic radiation is marked with asterisk. C, High-power fluorescence photomicrograph of section shown in B. Presumed thalamocortical afferents enter all layers of CP. Scale bars: A and B, 1 mm; C, 0.5 mm.
Figure 3 Dil injection into thalamic radiation (TR) below primary visual cortex of 26-week-old human fetus. A, Bright-field photomicrograph of unstained coronal section through calcarine sulcus showing injection site (asterisk) and emerging layers of CP. B, Section shown in A viewed under fluorescence illumination. DiI labeled radial glial fibers (g) spanning between VZ and layer 1. Radially and obliquely oriented putative thalamocortical afferents (tca) enter CP. Center of injection in thalamic radiation is marked with asterisk. C, High-power fluorescence photomicrograph of section shown in B. Presumed thalamocortical afferents enter all layers of CP. Scale bars: A and B, 1 mm; C, 0.5 mm.CC-BY-NC-SA · From the PDF
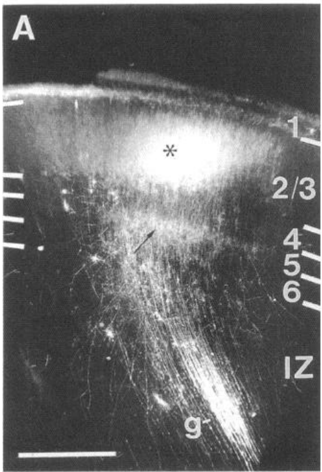
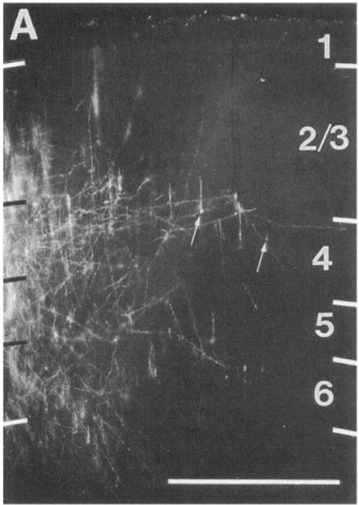
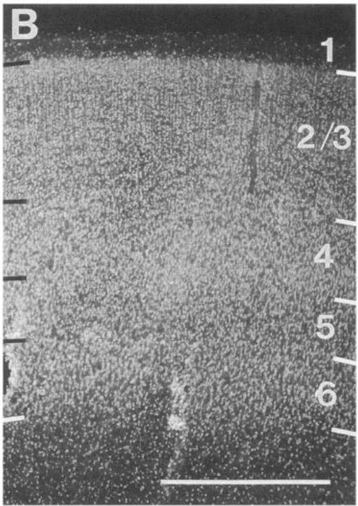
Figure 4 A, DiI injection (asterisk) into layer 2/3 of primary visual cortex of 29-week-old human fetus. Labeling to the left of bright spot, representing injection site, is due to DiI diffusion from the injection site after section was cut. Unbranched fibers traverse layer 4. The small-caliber fibers are descending axons of neurons in superficial layers. The larger-caliber fibers represent radial glial processes. Descending axons issue short collaterals in layer 5, forming a dense plexus of terminal arborization (arrow). Bundle of radial glial fibers (g) traverses IZ. B, Section in A counterstained with bisbenzimide, showing emerging cortical layers. Scale bars, 0.5 mm. Figure 4. A, DiI injection (asterisk) into layer 2/3 of primary visual cortex of 29-week-old human fetus. Labeling to the left of bright spot, representing injection site, is due to DiI diffusion from the injection site after section was cut. Unbranched fibers traverse layer 4. The small-caliber fibers are descending axons of neurons in superficial layers. The larger-caliber fibers represent radial glial processes. Descending axons issue short collaterals in layer 5, forming a dense plexus of terminal arborization (arrow). Bundle of radial glial fibers (g) traverses IZ. B, Section in A counterstained with bisbenzimide, showing emerging cortical layers. Scale bars, 0.5 mm.
Figure 4 A, DiI injection (asterisk) into layer 2/3 of primary visual cortex of 29-week-old human fetus. Labeling to the left of bright spot, representing injection site, is due to DiI diffusion from the injection site after section was cut. Unbranched fibers traverse layer 4. The small-caliber fibers are descending axons of neurons in superficial layers. The larger-caliber fibers represent radial glial processes. Descending axons issue short collaterals in layer 5, forming a dense plexus of terminal arborization (arrow). Bundle of radial glial fibers (g) traverses IZ. B, Section in A counterstained with bisbenzimide, showing emerging cortical layers. Scale bars, 0.5 mm. Figure 4. A, DiI injection (asterisk) into layer 2/3 of primary visual cortex of 29-week-old human fetus. Labeling to the left of bright spot, representing injection site, is due to DiI diffusion from the injection site after section was cut. Unbranched fibers traverse layer 4. The small-caliber fibers are descending axons of neurons in superficial layers. The larger-caliber fibers represent radial glial processes. Descending axons issue short collaterals in layer 5, forming a dense plexus of terminal arborization (arrow). Bundle of radial glial fibers (g) traverses IZ. B, Section in A counterstained with bisbenzimide, showing emerging cortical layers. Scale bars, 0.5 mm.CC-BY-NC-SA · From the PDF
Image 5
CC-BY-NC-SA · From the PDF
Image 6
CC-BY-NC-SA · From the PDF
Image 7
CC-BY-NC-SA · From the PDF
Image 8
CC-BY-NC-SA · From the PDF
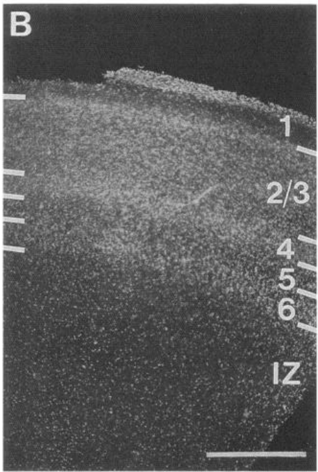
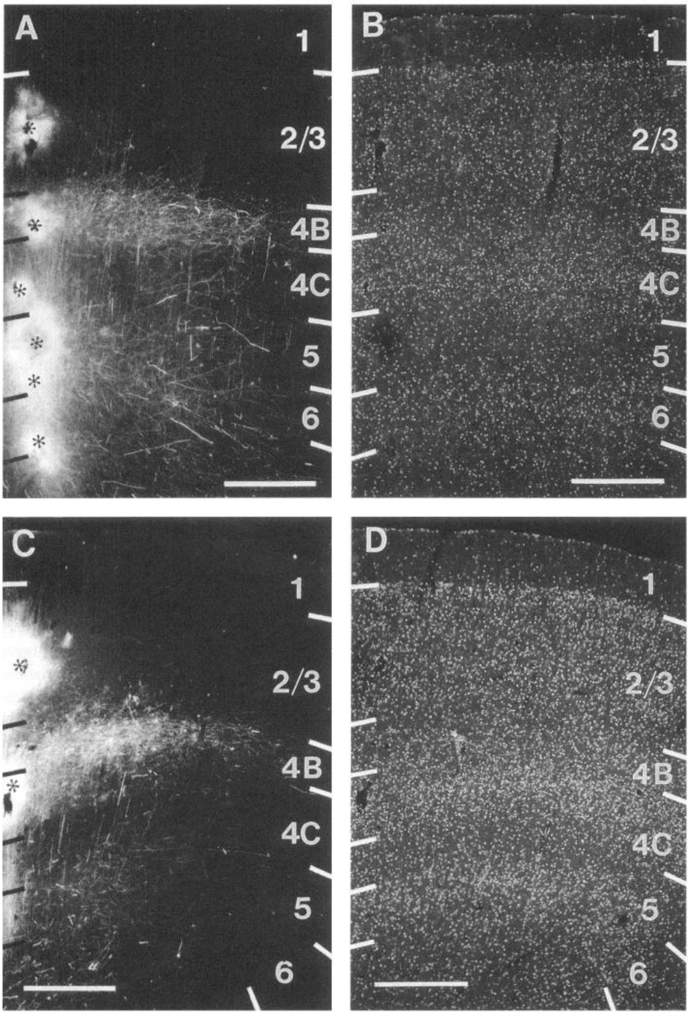
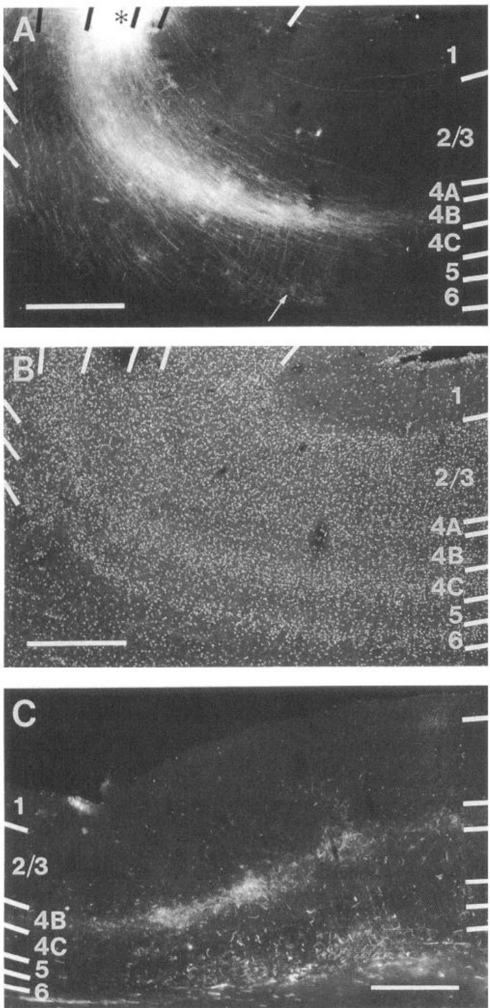
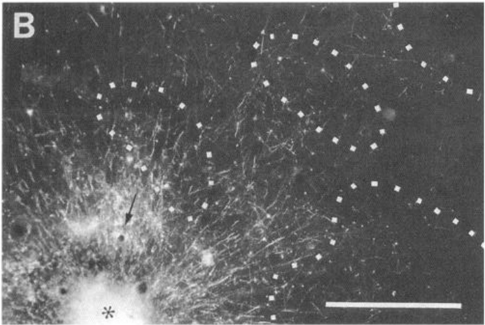
Figure 7 A, Five DiI injections (centers indicated with asterisks) distributed throughout the thickness of primary visual cortex in 37-week-old hun t (e t t st t t s s a st aonty of horizontal fibers extend within layer 4B and at the layer 5/6 border. Layers superficial to layer 4B contain extremely few labeled fibers. Labeled cell bodies (arrows) indicate that at least some of the horizontal fibers represent local collaterals of cortical neurons. B, Section shown in A, counterstained with bisbenzimide. Notice sublamination within layer 4. C, Dil labeling in primary visual cortex of 1-week-old neonate: multiple injections (asterisks) involving layers 4-6 and subcortical white matter (WM). Unlike "clean" cortical injections (A), white matter injections produce terminal labeling in layer 4C. D, Section shown in C, counterstained with bisbenzimide to reveal layers. Scale bars, 0.5 mm.
Figure 7 A, Five DiI injections (centers indicated with asterisks) distributed throughout the thickness of primary visual cortex in 37-week-old hun t (e t t st t t s s a st aonty of horizontal fibers extend within layer 4B and at the layer 5/6 border. Layers superficial to layer 4B contain extremely few labeled fibers. Labeled cell bodies (arrows) indicate that at least some of the horizontal fibers represent local collaterals of cortical neurons. B, Section shown in A, counterstained with bisbenzimide. Notice sublamination within layer 4. C, Dil labeling in primary visual cortex of 1-week-old neonate: multiple injections (asterisks) involving layers 4-6 and subcortical white matter (WM). Unlike "clean" cortical injections (A), white matter injections produce terminal labeling in layer 4C. D, Section shown in C, counterstained with bisbenzimide to reveal layers. Scale bars, 0.5 mm.CC-BY-NC-SA · From the PDF
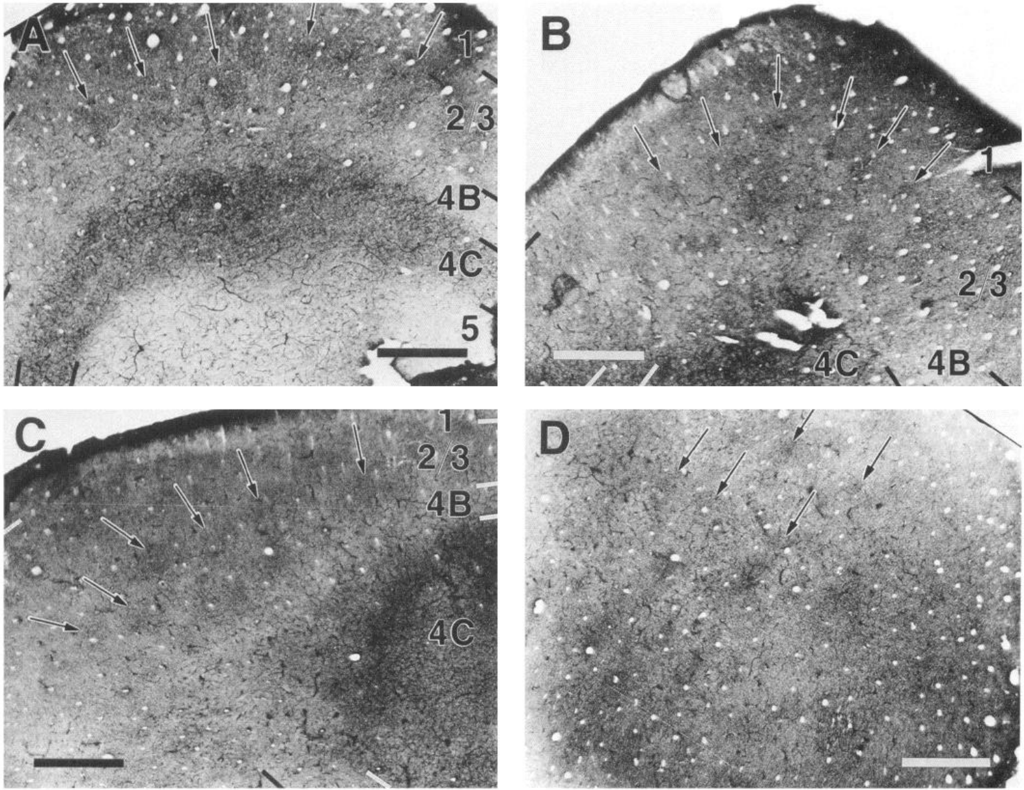
Figure 8 Distribution of CO activity in striate cortex of human neonate (1 d postnatal). A, Transverse section through V1 showing nonuniform staining in layer 2/3 that resembles blobs (arrows). Dense staining is also seen in layer 4C.There is no systematic difference in CO activity in superficial and deep parts of 4C. Although V1 contains a layer 4A, it does not express CO activity and can therefore not be distinguished from 4B. B-D, Horizontal section through V1 showing regular array of blobs (arrows). Scale bars, 1 mm.
Figure 8 Distribution of CO activity in striate cortex of human neonate (1 d postnatal). A, Transverse section through V1 showing nonuniform staining in layer 2/3 that resembles blobs (arrows). Dense staining is also seen in layer 4C.There is no systematic difference in CO activity in superficial and deep parts of 4C. Although V1 contains a layer 4A, it does not express CO activity and can therefore not be distinguished from 4B. B-D, Horizontal section through V1 showing regular array of blobs (arrows). Scale bars, 1 mm.CC-BY-NC-SA · From the PDF
Image 11
CC-BY-NC-SA · From the PDF
Sequential development of vertical and horizontal connections: functional implications
Sequential development of vertical and horizontal connections: functional implicationsCC-BY-NC-SA · From the PDF
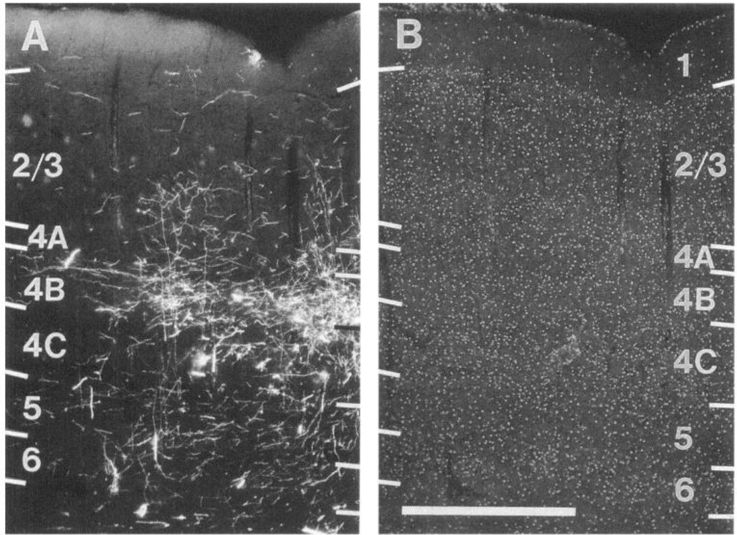
Figure 11 A, DiI injection (asterisk) into layer 4B of human primary visual cortex at 7 week postnatal. Most fibers are confined to layer 4B and terminate in uniform fashion. Many fibers descend into subcortical white matter. Some fibers terminate in layer 6 (arrow). Projections to superficial layers ascend vertically, but laterally spreading fibers are extremely rare. B, Section shown in A, counterstained with bisbenzimide to reveal layers. C, Distribution of DiI-labeled axon arborizations in primary visual cortex after injection into layer 4B of 5-year-old human. Layer 4B contains clusters of terminal arborizations. Above layer 4B, labeling is extremely sparse. Below layer 4B, patches of axon arborizations are seen, although less dense in layer 6. Scale bars, 0.5 mm.
Figure 11 A, DiI injection (asterisk) into layer 4B of human primary visual cortex at 7 week postnatal. Most fibers are confined to layer 4B and terminate in uniform fashion. Many fibers descend into subcortical white matter. Some fibers terminate in layer 6 (arrow). Projections to superficial layers ascend vertically, but laterally spreading fibers are extremely rare. B, Section shown in A, counterstained with bisbenzimide to reveal layers. C, Distribution of DiI-labeled axon arborizations in primary visual cortex after injection into layer 4B of 5-year-old human. Layer 4B contains clusters of terminal arborizations. Above layer 4B, labeling is extremely sparse. Below layer 4B, patches of axon arborizations are seen, although less dense in layer 6. Scale bars, 0.5 mm.CC-BY-NC-SA · From the PDF
Image 14
CC-BY-NC-SA · From the PDF
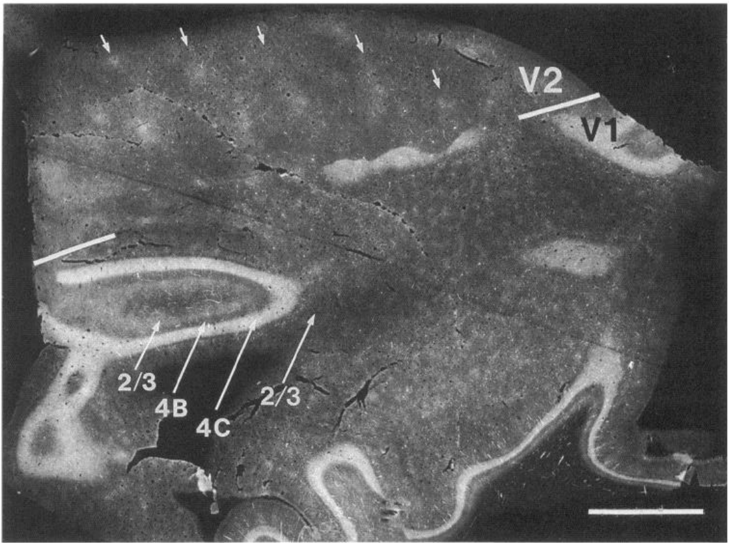
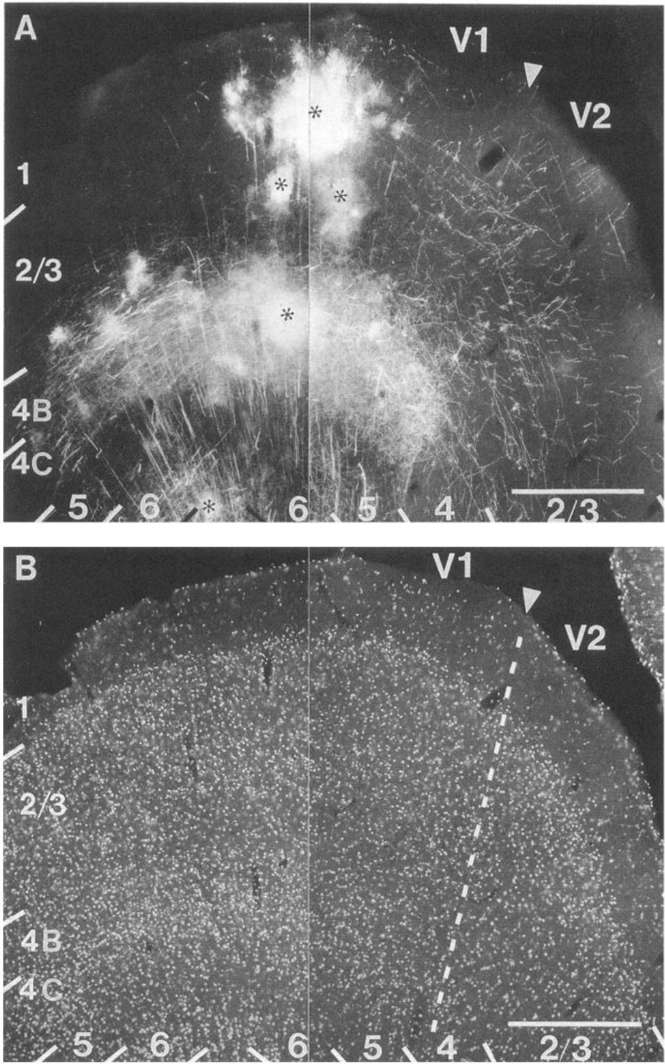
Figure 13 A, Montage of photomicrographs showing DiI injections into primary visual cortex of 4-month-old human. Injections (asterisks) are located near the V1/V2 border (arrowhead). Within V1, fiber labeling is dense in layers 4B and 6. Labeling in layer 2/3 is asymmetrical: extremely few fibers are seen within V1 on the left of the injection site, whereas numerous fibers are seen on the right, many of which cross the V1/V2 border and penetrate deep into V2. Within V2 fibers give off vertical collaterals, indicating terminal projections. B, Montage shown in A, counterstained with bisbenzimide to reveal layers and areal boundaries. V1/ V2 border is indicated by broken line. Scale bars, 0.5 mm.
Figure 13 A, Montage of photomicrographs showing DiI injections into primary visual cortex of 4-month-old human. Injections (asterisks) are located near the V1/V2 border (arrowhead). Within V1, fiber labeling is dense in layers 4B and 6. Labeling in layer 2/3 is asymmetrical: extremely few fibers are seen within V1 on the left of the injection site, whereas numerous fibers are seen on the right, many of which cross the V1/V2 border and penetrate deep into V2. Within V2 fibers give off vertical collaterals, indicating terminal projections. B, Montage shown in A, counterstained with bisbenzimide to reveal layers and areal boundaries. V1/ V2 border is indicated by broken line. Scale bars, 0.5 mm.CC-BY-NC-SA · From the PDF
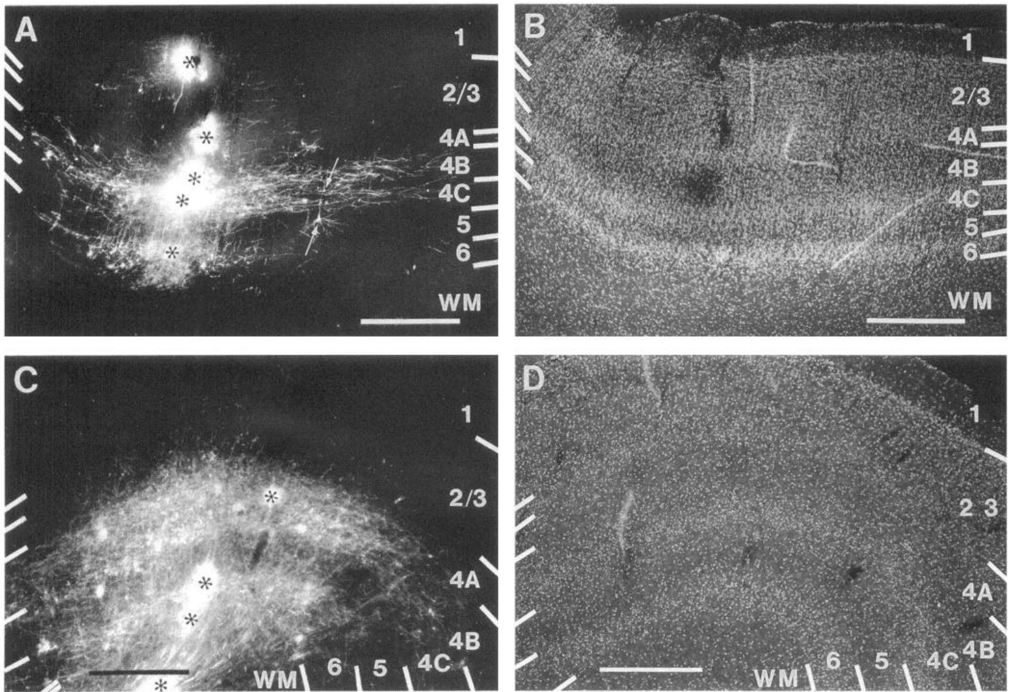
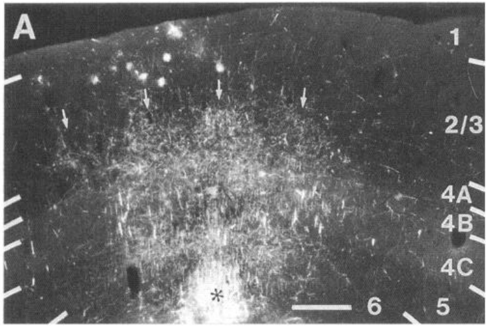
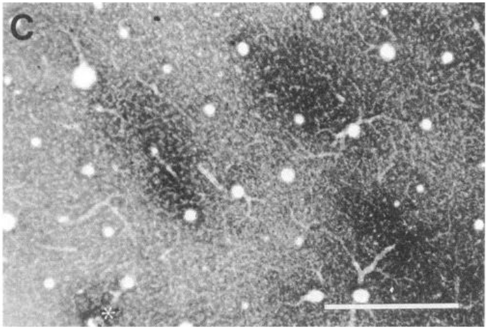
Figure 14 A, Dil-labeled projections within primary visual cortex after injection through depth of gray matter in 2-year-old human. Coronal section taken near the injection site (lowermost extension marked with asterisk) shows long-ranging axonal projections within layers 2/3, 4B, 5, and 6. Terminal arborizations are distributed in nonuniform fashion and appear clustered (arrows). B, Horizontal section through primary visual cortex of 5-year-old human: DiI injection into interblob (asterisk). Local projections are widespread and tend to arborize in interblob regions. Most prominent interblob projection site is marked by arrow. Blobs are outlined by white dots. C, CO staining pattern in section adjacent to that shown in B (compare blood vessels). Injection site (asterisk) is dark because of purple color of Dil crystals and does not represent increased CO activity. Notice that fibers preferentially arborize within interblob regions. Scale bars, 0.5mm.
Figure 14 A, Dil-labeled projections within primary visual cortex after injection through depth of gray matter in 2-year-old human. Coronal section taken near the injection site (lowermost extension marked with asterisk) shows long-ranging axonal projections within layers 2/3, 4B, 5, and 6. Terminal arborizations are distributed in nonuniform fashion and appear clustered (arrows). B, Horizontal section through primary visual cortex of 5-year-old human: DiI injection into interblob (asterisk). Local projections are widespread and tend to arborize in interblob regions. Most prominent interblob projection site is marked by arrow. Blobs are outlined by white dots. C, CO staining pattern in section adjacent to that shown in B (compare blood vessels). Injection site (asterisk) is dark because of purple color of Dil crystals and does not represent increased CO activity. Notice that fibers preferentially arborize within interblob regions. Scale bars, 0.5mm.CC-BY-NC-SA · From the PDF
Image 17
CC-BY-NC-SA · From the PDF
Image 18
CC-BY-NC-SA · From the PDF

Verification

Claims the paper makes

The claims and statistics of this paper haven’t been checked yet.

Run the check — free, no account needed. It reads the open-access text and checks the sources it cites.

A few free checks a day · papers already verified open instantly · results are public

Claims other papers make about this one

Each is checked against this paper’s own text: does it say what the citing paper says it does?

Self-check

Percentages, sums and reported differences re-computed from the paper’s own numbers.

The self-check needs the paper’s full text.

Citations

Cites

Research works printed but not linked: 7

  1. Atkinson J (1984) Human visual development over the first 6 months of life. A review and a hypothesis. Hum Neurobiol 3:6 l-74.
  2. Braak H (1984) Architectonics as seen by lipofuscin stains. In: Cerebral cortex, Vol 1 (Peters A, Jones EG, eds), pp 59-104. New York: Ple- num.
  3. Brown AM (1990) Development of visual sensitivity to light and color vision in human infants: a critical review. Vision Res 30: 1159-l 188.
  4. Cone1 JL (1939-1967) The postnatal development of the human ce- rebral cortex, Vols I-VII. Cambridge: Harvard UP.
  5. Sidman RL, Rakic P (1973) Neural migration with special reference to the developing human brain: a review. Brain Res 62:1-35.
  6. Tychsen L (1992a) Motion sensitivity and the origins of infantile strabismus. In: Infant vision: basic and clinical research (Simons K, ed), in press. New York: Oxford UP.
  7. Tychsen L (1992b) Binocular Vision. In: Adler's physiology of the eye: clinical applications, 9th ed (Hart WM, ed), pp 773-853. St. Louis: Mosby.

Cited by

Sorted by citations

See all 219

Metadata

Authors
Burkhalter, A., Bernardo, K., & Charles, V
Venue
The Journal of Neuroscience
Published
1993-05-01
Volume
13
Issue
5
Pages
1916-1931
ISSN
  • 0270-6474
  • 1529-2401
Cited by
219
References
2
Language
en

About these checks

Registry, retraction, Cites and statistics results are computed, not judged, with one exception: a printed reference that no index lists is read once by a model before it counts as a citation error. Claims are extracted by a model and kept only when their quote appears verbatim in the text; each cited source is then checked, with a model’s help, for whether it says what the claim relies on. Those verdicts can be wrong — read the claim’s quote and the cited source before relying on one.

Statistics and arithmetic are recomputed, not judged.

Confidence bands are shown only for fields calibrated on our annotated test set. None is calibrated yet, so no band is shown.

What counts as a claim ›How we measure confidence ›How we check this ›

Are you an author, or do you see a problem with this page? Request a review