

The DOI matches its Crossref record; 35 of the 35 references it cites were found in a registry or an index.
Memory of Learning Facilitates Saccadic Adaptation in the Monkey
Open accessAbstract
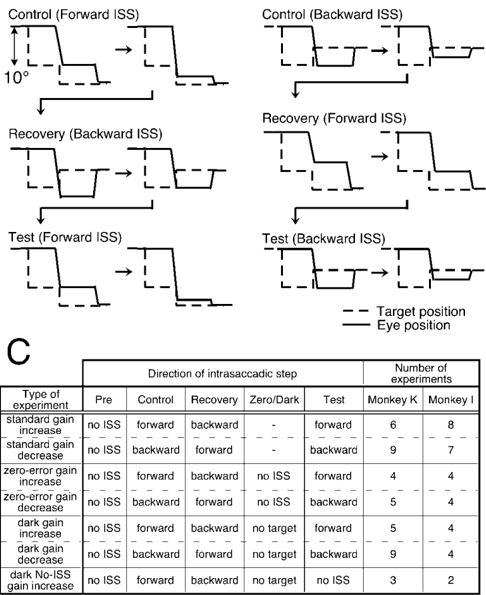
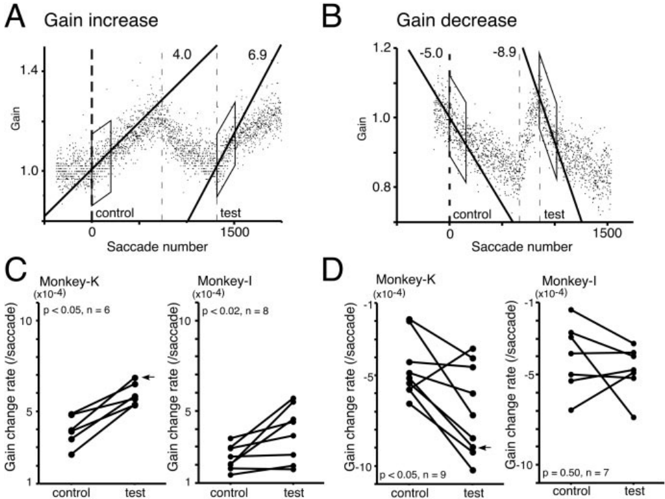
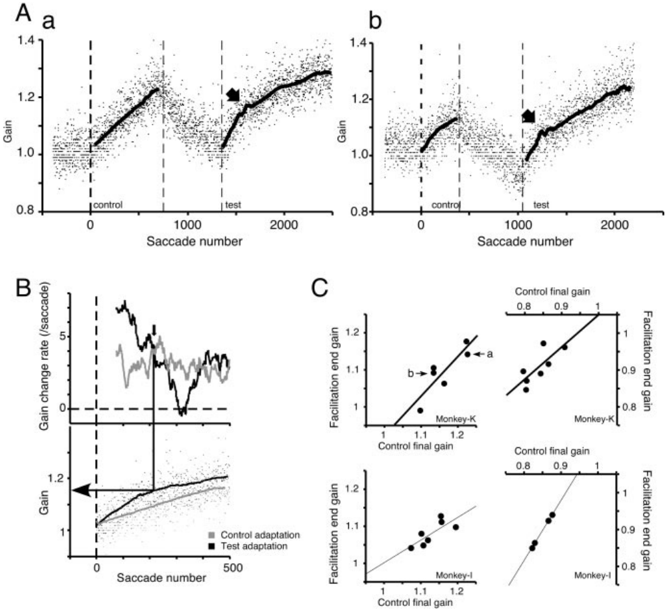
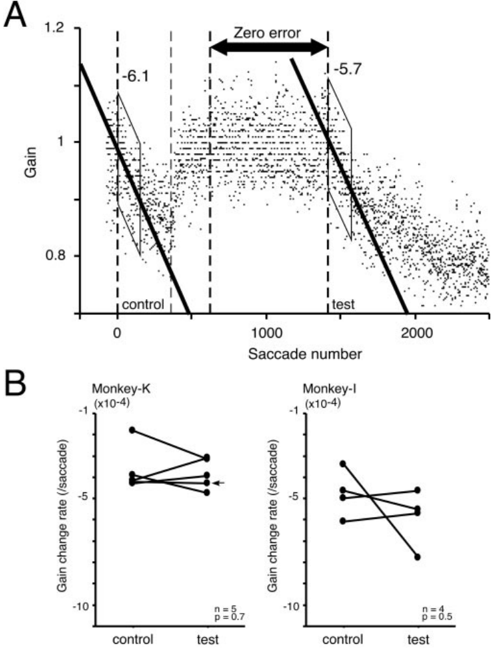
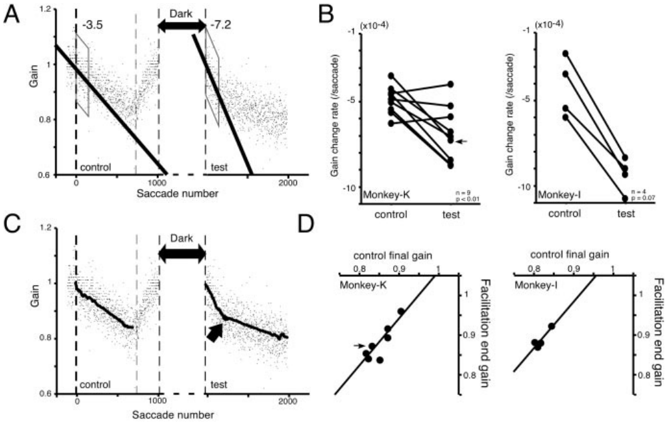
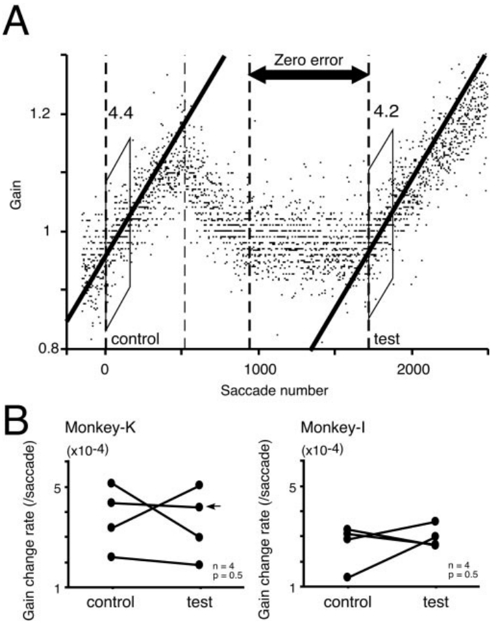
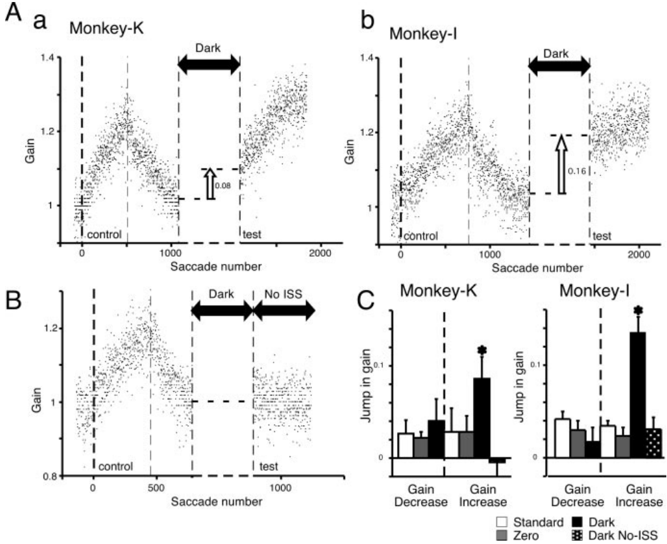
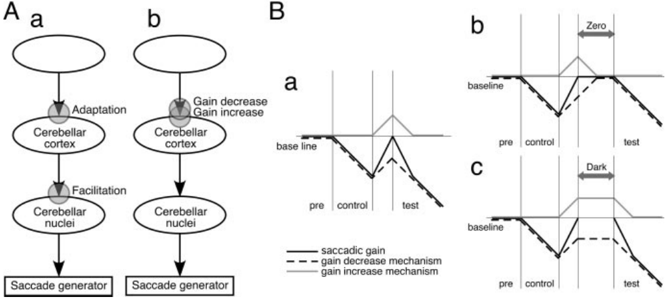
A motor learning mechanism called saccadic adaptation ensures accuracy of saccades throughout life despite growth, aging, and some pathologies of the oculomotor plant or nervous system. The present study investigates effects of preceding adaptation on the speed of subsequent adaptation during single experiments. Adaptive changes in gain (movement size divided by target eccentricity) were induced by intrasaccadic step (ISS) of the target. After the gain was altered (control block), we reversed the direction of ISS to bring the gain back to approximately 1.0 (recovery). We then reversed ISS direction again to induce another adaptation (test block). Analyses revealed that the gain changed at a higher rate in the early part of test adaptation than in the corresponding part of control. After approximately 100-300 saccades in the test block, adaptation slowed down. The gain value at which adaptation slowed was correlated with the gain achieved in the control. We further examined effects of a 30 min intervention inserted between recovery and test blocks. When zero-visual-error trials ( approximately 700 saccades) were repeated during this period, the rate of test adaptation was similar to that of control. In contrast, when the animal was deprived of visual inputs during this period, test adaptation was still influenced by preceding learning. We conclude that a memory of previous learning remains during recovery to facilitate subsequent adaptation and that such a memory does not disappear merely with time but is erased actively by repeated zero-error movements. Our results, which cannot be explained by a single mechanism, suggest that the saccadic system is equipped with more than one plasticity process.
Overview
The claims and statistics of this paper haven’t been checked yet.
Run the check — free, no account needed. It reads the open-access text and checks the sources it cites.
Integrity signals
Registry
Cites
Statistics
Figures
Verification
Claims the paper makes
The claims and statistics of this paper haven’t been checked yet.
Run the check — free, no account needed. It reads the open-access text and checks the sources it cites.
Claims other papers make about this one
Each is checked against this paper’s own text: does it say what the citing paper says it does?
In the citing paper
“In particular, relearning of a given perturbation for a second time is faster than initial learning – a phenomenon known as savings (Ebbinghaus, 1913; Kojima et al., 2004; Krakauer et al., 2005; Smith et al., 2006; Zarahn et al., 2008) – whereas a basic single-timescale SSM predicts that learning should always occur at the same rate, regardless of past experience (Zarahn et al., 2008).”
From Rethinking motor learning and savings in adaptation paradigms: model-free memory for successful actions combines with internal models (2011) · cites this paper as Kojima et al., 2004
Self-check
Percentages, sums and reported differences re-computed from the paper’s own numbers.
The self-check needs the paper’s full text.
Citations
Cites
A method for measuring horizontal and vertical eye movement chronically in the monkey.
Fuchs, A. F., & Robinson, D. A. (1966) · Journal of Applied Physiology · doi:10.1152/jappl.1966.21.3.1068 · Cited by 795 · cited 2×
“Two rhesus monkeys (Macaca mulatta, male; 4.5 and 6.8 kg) were prepared for eye movement recording by the magnetic search coil method (Fuchs and Robinson, 1966).”
MethodInfluentialCerebellar-dependent adaptive control of primate saccadic system
Optican, L. M., & Robinson, D. A. (1980) · Journal of Neurophysiology · doi:10.1152/jn.1980.44.6.1058 · Cited by 773 · cited 2×
“The oculo - motor vermis and the fastigial oculomotor region ( FOR ) of the cerebellum have been shown to be key players in saccadic adap - tation ( Optican and Robinson , 1980 ; Takagi et al .”
BackgroundParametric adjustment in saccadic eye movements
McLaughlin, S. C. (1967) · Perception & Psychophysics · doi:10.3758/bf03210071 · Cited by 570 · cited 3×
“Adaptive changes in saccade amplitude were induced by a conventional intrasaccadic target step paradigm (McLaughlin, 1967).”
BackgroundMethodEffects of Lesions of the Oculomotor Vermis on Eye Movements in Primate: Saccades
Takagi, M., Zee, D. S., & Tamargo, R. J. (1998) · Journal of Neurophysiology · doi:10.1152/jn.1998.80.4.1911 · Cited by 374 · cited 1×
“The oculomotor vermis and the fastigial oculomotor region (FOR) of the cerebellum have been shown to be key players in saccadic adaptation (Optican and Robinson, 1980; Takagi et al., 1998; Barash et al., 1999; Scudder, 2002; Inaba et al., 2003; Scudder and McGee, 2003).”
BackgroundLev‐Ram, V., Wong, S. T., Storm, D. R., & Tsien, R. Y. (2002) · Proceedings of the National Academy of Sciences · doi:10.1073/pnas.122206399 · Cited by 330 · cited 1×
“Recent results describe a previously unrecognized form of long-term potentiation in the cerebellar cortex (Lev-Ram et al., 2002) and a synaptic depotentiation in the hippocampus (Montgomery and Madison, 2002).”
BackgroundThe characteristics and neuronal substrate of saccadic eye movement plasticity
Hopp, J. J., & Fuchs, A. F. (2004) · Progress in Neurobiology · doi:10.1016/j.pneurobio.2003.12.002 · Cited by 316 · cited 1×
“This is because the saccadic gain (saccade amplitude divided by target eccentricity) is constantly recalibrated by a learning mechanism called saccadic adaptation (for review, see Hopp and Fuchs, 2004).”
BackgroundSaccadic Dysmetria and Adaptation after Lesions of the Cerebellar Cortex
Barash, S., Melikyan, A., Sivakov, A., Zhang, M., Glickstein, M., & Thier, P. (1999) · Journal of Neuroscience · doi:10.1523/jneurosci.19-24-10931.1999 · Cited by 312 · cited 1×
“The oculomotor vermis and the fastigial oculomotor region (FOR) of the cerebellum have been shown to be key players in saccadic adaptation (Optican and Robinson, 1980; Takagi et al., 1998; Barash et al., 1999; Scudder, 2002; Inaba et al., 2003; Scudder and McGee, 2003).”
BackgroundA Mechanism for Savings in the Cerebellum
Medina, J. F., Garcia, K. S., & Mauk, M. D. (2001) · Journal of Neuroscience · doi:10.1523/jneurosci.21-11-04081.2001 · Cited by 224 · cited 1×
“In the subsequent recovery block, the cortical plasticity decreases back to and possibly beyond the preadaptation level, as has been suggested for the extinction of eye blink conditioning (Medina et al., 2001), but the nuclear plasticity remains potentiated.”
BackgroundSaccadic Gain Modification: Visual Error Drives Motor Adaptation
Wallman, J., & Fuchs, A. F. (1998) · Journal of Neurophysiology · doi:10.1152/jn.1998.80.5.2405 · Cited by 218 · cited 2×
“There is good evidence that saccadic adaptation is a form of motor learning driven by visual error immediately after the end of saccades (Wallman and Fuchs, 1998; Shafer et al., 2000; Noto and Robinson, 2001).”
BackgroundCharacteristics of Saccadic Gain Adaptation in Rhesus Macaques
Straube, A. M., Fuchs, A. F., Usher, S., & Robinson, F. R. (1997) · Journal of Neurophysiology · doi:10.1152/jn.1997.77.2.874 · Cited by 211 · cited 6×
“Adaptation is fairly specific to the amplitude and direction of adapted saccades and does not generalize fully to those with different vectors (Straube et al., 1997; Wallman and Fuchs, 1998; Noto et al., 1999; Watanabe et al., 2000).”
BackgroundInfluentialSaccadic plasticity: Parametric adaptive control by retinal feedback.
Miller, J. M., Anstis, T., & Templeton, W. B. (1981) · Journal of Experimental Psychology Human Perception & Performance · doi:10.1037//0096-1523.7.2.356 · Cited by 208 · cited 1×
“It has been demonstrated that adaptation progresses more slowly when the subject is exposed to adapting target steps of a variety of sizes and directions in humans (Miller et al., 1981) and monkeys (Scudder et al.”
BackgroundTransfer of short-term adaptation in human saccadic eye movements
Frens, M. A., & Opstal, A. J. V. (1994) · Experimental Brain Research · doi:10.1007/bf00227199 · Cited by 174 · cited 1×
“Previous studies have shown that adaptation is relatively specific to the size and direction of target eccentricity (Deubel et al., 1987; Semmlow et al., 1989; Frens and van Opstal, 1994; Straube et al., 1997; Noto et al., 1999; Watanabe et al., 2000).”
BackgroundRapid reacquisition in conditioning of the rabbit's nictitating membrane response.
Napier, R. M., Macrae, M., & Kehoe, E. J. (1992) · Journal of Experimental Psychology Animal Behavior Processes · doi:10.1037//0097-7403.18.2.182 · Cited by 161 · cited 1×
“Reexposure to paired stimuli after extinction induces reacquisition that is much faster than original acquisition (Frey and Ross, 1968; Napier et al., 1992), indicating that a memory of learning is formed to facilitate subsequent learning.”
BackgroundState-Dependent Heterogeneity in Synaptic Depression between Pyramidal Cell Pairs
Montgomery, J. M., & Madison, D. V. (2002) · Neuron · doi:10.1016/s0896-6273(02)00606-2 · Cited by 152 · cited 2×
“, 2002 ) and a synaptic depotentiation in the hippocampus ( Montgomery and Madison , 2002 ) .”
BackgroundSaccadic plasticity: Parametric adaptive control by retinal feedback.
Miller, J. M., Anstis, T., & Templeton, W. B. (1981) · Journal of Experimental Psychology Human Perception & Performance · doi:10.1037/0096-1523.7.2.356 · Cited by 140
Active reversal of motor memories reveals rules governing memory encoding.
Boyden, E., & Raymond, J. L. (2003) · Neuron · doi:10.1016/s0896-6273(03)00562-2 · Cited by 138 · cited 2×
“, 1995 ) and use of a novel behavioral paradigm in mice ( Boyden and Raymond , 2003 ) have both suggested separate plasticity mechanisms for increases and decreases in vestibuloocular reflex gain .”
BackgroundLi, J., Smith, S. S., & McElligott, J. G. (1995) · Journal of Neurophysiology · doi:10.1152/jn.1995.74.1.489 · Cited by 134
Noto, C., Watanabe, S., & Fuchs, A. F. (1999) · Journal of Neurophysiology · doi:10.1152/jn.1999.81.6.2798 · Cited by 122 · cited 2×
“Previous studies have shown that adaptation is relatively specific to the size and direction of target eccentricity (Deubel et al., 1987; Semmlow et al., 1989; Frens and van Opstal, 1994; Straube et al., 1997; Noto et al., 1999; Watanabe et al., 2000).”
BackgroundRapid reacquisition in conditioning of the rabbit's nictitating membrane response.
Napier, R. M., Macrae, M., & Kehoe, E. J. (1992) · Journal of Experimental Psychology Animal Behavior Processes · doi:10.1037/0097-7403.18.2.182 · Cited by 117
Visual error is the stimulus for saccade gain adaptation
Noto, C., & Robinson, F. R. (2001) · Cognitive Brain Research · doi:10.1016/s0926-6410(01)00062-3 · Cited by 113 · cited 1×
“There is good evidence that saccadic adaptation is a form of motor learning driven by visual error immediately after the end of saccades (Wallman and Fuchs, 1998; Shafer et al., 2000; Noto and Robinson, 2001).”
BackgroundMechanisms of short-term saccadic adaptation.
Semmlow, J. L., Gauthier, G. M., & Vercher, J. (1989) · Journal of Experimental Psychology Human Perception & Performance · doi:10.1037//0096-1523.15.2.249 · Cited by 98 · cited 1×
“Previous studies have shown that adaptation is relatively specific to the size and direction of target eccentricity (Deubel et al., 1987; Semmlow et al., 1989; Frens and van Opstal, 1994; Straube et al., 1997; Noto et al., 1999; Watanabe et al., 2000).”
BackgroundCerebellar Influences on Saccade Plasticity
Robinson, F. R., Fuchs, A. F., & Noto, C. (2002) · Annals of the New York Academy of Sciences · doi:10.1111/j.1749-6632.2002.tb02816.x · Cited by 93 · cited 3×
“A recent study has further demonstrated that adaptation occurs upstream of the FOR (Robinson et al., 2002).”
BackgroundScudder, C. A., Batourina, E. Y., & Tunder, G. S. (1998) · Journal of Neurophysiology · doi:10.1152/jn.1998.79.2.704 · Cited by 93 · cited 1×
“Adaptation elicited by an intrasaccadic step (ISS) of the target (McLaughlin, 1967) has an approximately exponential course with a rate constant of 100 – 800 saccades (Straube et al., 1997; Scudder et al., 1998).”
BackgroundScudder, C. A., & McGee, D. M. (2003) · Journal of Neurophysiology · doi:10.1152/jn.00193.2002 · Cited by 79 · cited 2×
“, 2003 ; Scudder and McGee , 2003 ) .”
BackgroundMechanisms of short-term saccadic adaptation.
Semmlow, J. L., Gauthier, G. M., & Vercher, J. (1989) · Journal of Experimental Psychology Human Perception & Performance · doi:10.1037/0096-1523.15.2.249 · Cited by 74
Classical conditioning of the rabbit eyelid response as a function of interstimulus interval.
Frey, P. W., & Ross, L. E. (1968) · Journal of Comparative and Physiological Psychology · doi:10.1037/h0025555 · Cited by 70 · cited 1×
“Reexposure to paired stimuli after extinction induces reacquisition that is much faster than original acquisition (Frey and Ross, 1968; Napier et al., 1992), indicating that a memory of learning is formed to facilitate subsequent learning.”
BackgroundFuchs, A. F., Reiner, D., & Pong, M. (1996) · Journal of Neurophysiology · doi:10.1152/jn.1996.76.4.2522 · Cited by 63 · cited 2×
“The amount and rate of adaptation are highly variable across animals and also across experiments in the same animal (Fuchs et al., 1996; Straube et al., 1997).”
BackgroundTemporal Characteristics of Error Signals Driving Saccadic Gain Adaptation in the Macaque Monkey
Shafer, J. L., Noto, C., & Fuchs, A. F. (2000) · Journal of Neurophysiology · doi:10.1152/jn.2000.84.1.88 · Cited by 62 · cited 1×
“There is good evidence that saccadic adaptation is a form of motor learning driven by visual error immediately after the end of saccades (Wallman and Fuchs, 1998; Shafer et al., 2000; Noto and Robinson, 2001).”
BackgroundChanges in cerebellar fastigial burst activity related to saccadic gain adaptation in the monkey
Inaba, N., Iwamoto, Y., & YOSHIDA, K. T. (2003) · Neuroscience Research · doi:10.1016/s0168-0102(03)00098-1 · Cited by 54 · cited 1×
“The oculomotor vermis and the fastigial oculomotor region (FOR) of the cerebellum have been shown to be key players in saccadic adaptation (Optican and Robinson, 1980; Takagi et al., 1998; Barash et al., 1999; Scudder, 2002; Inaba et al., 2003; Scudder and McGee, 2003).”
BackgroundRole of the Fastigial Nucleus in Controlling Horizontal Saccades during Adaptation
Scudder, C. A. (2002) · Annals of the New York Academy of Sciences · doi:10.1111/j.1749-6632.2002.tb07556.x · Cited by 33 · cited 2×
“, 1999 ; Scudder , 2002 ; Inaba et al .”
BackgroundWatanabe, S., Noto, C., & Fuchs, A. F. (2000) · Experimental Brain Research · doi:10.1007/s002219900220 · Cited by 25 · cited 2×
“Previous studies have shown that adaptation is relatively specific to the size and direction of target eccentricity (Deubel et al., 1987; Semmlow et al., 1989; Frens and van Opstal, 1994; Straube et al., 1997; Noto et al., 1999; Watanabe et al., 2000).”
BackgroundSaccadic eye movements and the detection of fast-moving gratings
Deubel, H., Elsner, T., & Hauske, G. (1987) · Biological Cybernetics · doi:10.1007/bf00318714 · Cited by 21 · cited 1×
“Previous studies have shown that adaptation is relatively specific to the size and direction of target eccentricity (Deubel et al., 1987; Semmlow et al., 1989; Frens and van Opstal, 1994; Straube et al., 1997; Noto et al., 1999; Watanabe et al., 2000).”
BackgroundWatanabe, S., Noto, C., & Fuchs, A. F. (2000) · Experimental Brain Research · doi:10.1007/s002210050019 · Cited by 11
Saccadic adaptation is accelerated by transient reversal of gain change direction
Kojima, Y. (2002) · Medical Entomology and Zoology · Cited by 2
Storage and erasure of information about saccadic gain adaptation
Kojima, Y. (2003) · Neuroscience Research · Cited by 1
Research works printed but not linked: 5
- 2003, Soc Neurosci Abstr, 29, 441.7
- 2003, Neurosci Res, 46, S159
- 2002, Soc Neurosci Abstr, 28, 265.2
- 2003, Neurosci Res, 46, S49
- 2003, Soc Neurosci Abstr, 29, 79.1
Cited by
Sorted by citations
Error Correction, Sensory Prediction, and Adaptation in Motor Control
Shadmehr, R., Smith, M. A., & Krakauer, J. W. (2010) · Annual Review of Neuroscience · doi:10.1146/annurev-neuro-060909-153135 · Cited by 1,869
“This phenomenon has been observed in a wide range of paradigms (Rescorla, 2004;Kojima et al., 2004;Stollhoff et al., 2005).”
BackgroundPrinciples of sensorimotor learning
Wolpert, D. M., Diedrichsen, J., & Flanagan, J. R. (2011) · Nature Reviews Neuroscience · doi:10.1038/nrn3112 · Cited by 1,391
“A recent model 79 based on this idea of temporal credit assignment can account for a number of phenomena that are related to reach movement adaptation to perturbations as well as saccadic adaptation 98 .”
BackgroundInteracting adaptive processes with different timescales underlie short-term motor learning
Smith, M. A., Ghazizadeh, A., & Shadmehr, R. (2006) · PLoS Biology · doi:10.1371/journal.pbio.0040179 · Cited by 1,113
“observed in their saccade adaptation experiment following a period of darkness [3].”
BackgroundKrakauer, J. W., Hadjiosif, A. M., Xu, J., Wong, A. L., & Haith, A. M. (2019) · Comprehensive physiology · doi:10.1002/cphy.c170043 · Cited by 918
Krakauer, J. W., & Shadmehr, R. (2006) · Trends in Neurosciences · doi:10.1016/j.tins.2005.10.003 · Cited by 516
Metadata
- Authors
- Kojima, Y., Iwamoto, Y., & Yoshida, K.
- Affiliations
- University of Tsukuba (JP)
- Corresponding author
- Iwamoto, Yoshiki
- ORCID
- Kojima, Yoshiko
- Venue
- The Journal of Neuroscience
- Publisher
- Society for Neuroscience
- Published
- 2004-08-25
- Volume
- 24
- Issue
- 34
- Pages
- 7531-7539
- ISSN
- 0270-6474 (ISSN-L)
- 1529-2401
- PMC
- PMC6729647
- OpenAlex
- W2096184857
- Cited by
- 179
- References
- 31
- Citations by year
- 2026: 3 · 2025: 8 · 2024: 5 · 2023: 9 · 2022: 6 · 2021: 15 · 2020: 19 · 2019: 18 · 2018: 5 · 2017: 5 · 2016: 7 · 2015: 13 · 2014: 11 · 2013: 8 · 2012: 5
- FWCI
- 2.35
- Type
- journal article
- Language
- en
- Open access
- hybrid
- doi.org
- Licence
- Locations
- Journal of Neuroscience (publishedVersion, cc-by-nc-sa)
- PubMed Central (publishedVersion)
- PubMed (publishedVersion)
- Funders
- Japan Society for the Promotion of Science (13680894)
- Topics
- Life Sciences › Neuroscience › Cognitive Neuroscience › Motor Control and Adaptation
- Life Sciences › Neuroscience › Cognitive Neuroscience › Visual perception and processing mechanisms
- Life Sciences › Neuroscience › Neurology › Vestibular and auditory disorders
- Keywords
- saccadic adaptation, motor learning, visual deprivation
- MeSH terms
- Adaptation, Ocular, Animals, Learning, Macaca mulatta, Male, Memory, Saccades
About these checks
Registry, retraction, Cites and statistics results are computed, not judged, with one exception: a printed reference that no index lists is read once by a model before it counts as a citation error. Claims are extracted by a model and kept only when their quote appears verbatim in the text; each cited source is then checked, with a model’s help, for whether it says what the claim relies on. Those verdicts can be wrong — read the claim’s quote and the cited source before relying on one.
Statistics and arithmetic are recomputed, not judged.
Confidence bands are shown only for fields calibrated on our annotated test set. None is calibrated yet, so no band is shown.
What counts as a claim ›How we measure confidence ›How we check this ›
Are you an author, or do you see a problem with this page? Request a review
