

The DOI matches its Crossref record; 41 of the 41 references it cites were found in a registry or an index.
Induction of Cyclin-Dependent Kinase 5 in the Hippocampus by Chronic Electroconvulsive Seizures: Role of ΔFosB
Open accessAbstract
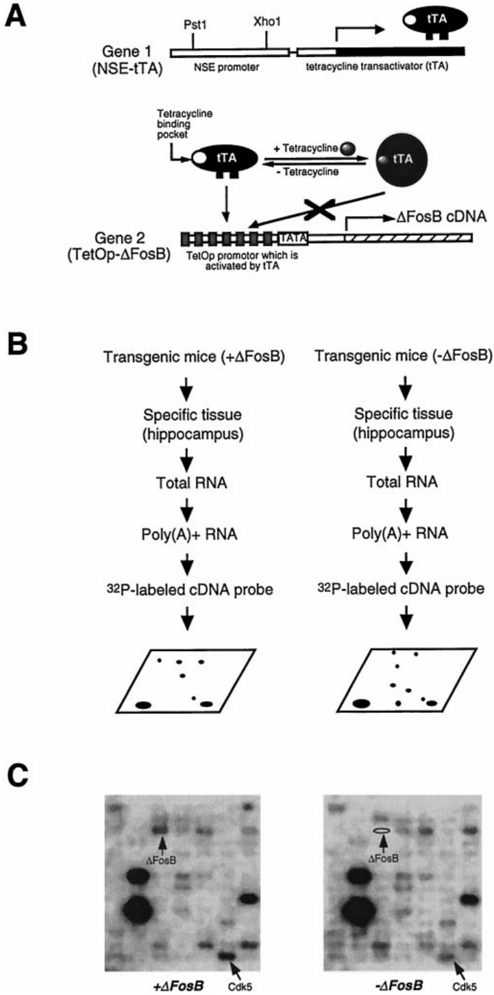
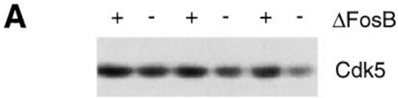
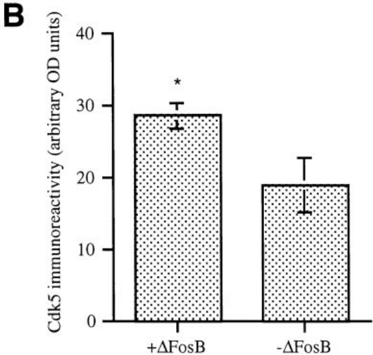
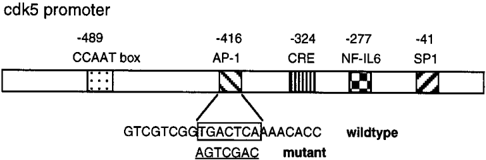
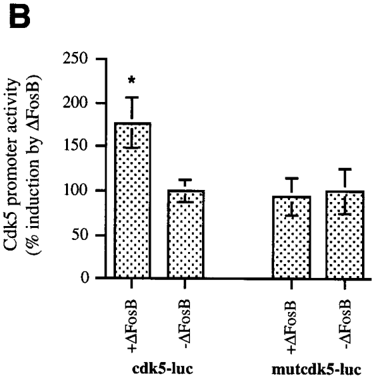
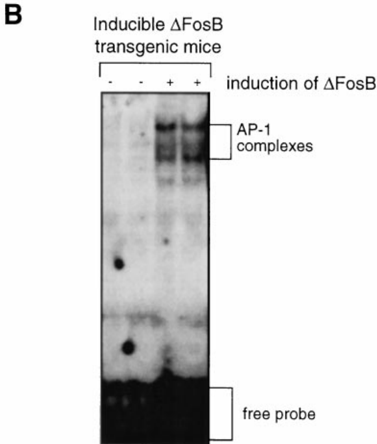
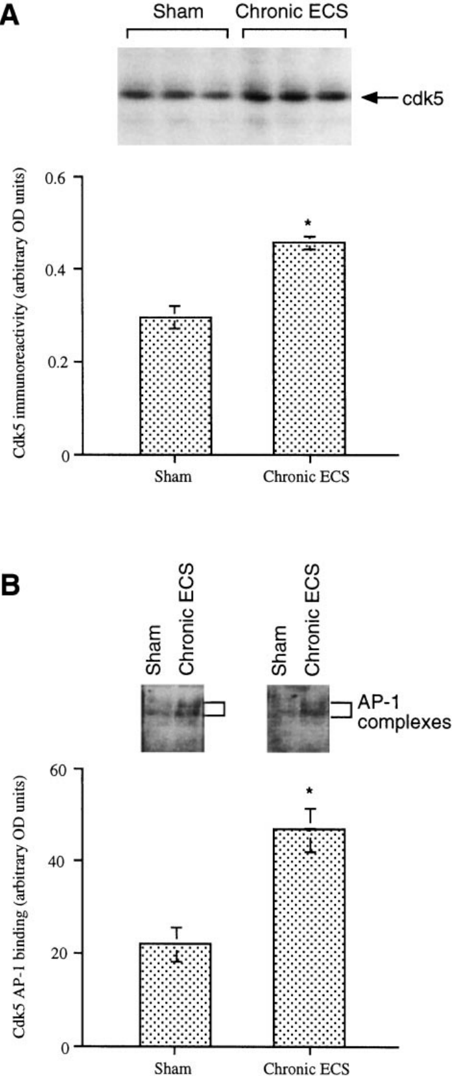
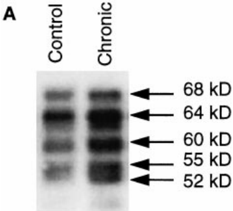
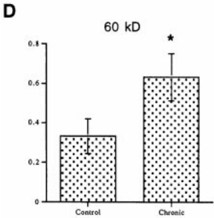
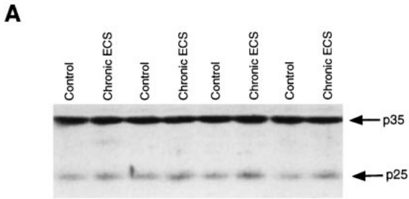
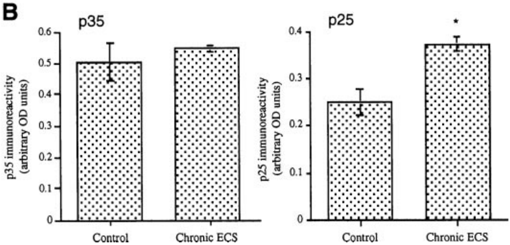
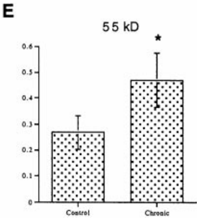
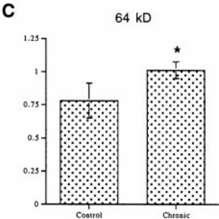
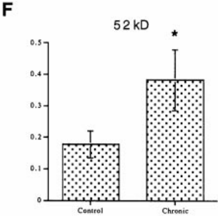
The transcription factor ΔFosB is induced in the hippocampus and other brain regions by repeated electroconvulsive seizures (ECS), an effective antidepressant treatment. The unusually high stability of this protein makes it an attractive candidate to mediate some of the long-lasting changes in the brain caused by ECS treatment. To understand how ΔFosB might alter brain function, we examined the gene expression profiles in the hippocampus of inducible transgenic mice that express ΔFosB in this brain region by the use of cDNA expression arrays that contain 588 genes. Of the 430 genes detected, 20 genes were consistently upregulated, and 14 genes were downregulated, by >50%. One of the upregulated genes is cyclin-dependent kinase 5 (cdk5). On the basis of its purported role in regulating neuronal structure, we studied directly whether cdk5 is a true target for ΔFosB. Upregulation of cdk5 immunoreactivity in the hippocampus was confirmed by Western blotting in the ΔFosB-expressing transgenic mice as well as in rats treated chronically with ECS. Chronic ECS treatment also increased, in the hippocampus, the phosphorylation state of tau, a microtubule-associated protein that is a known substrate for cdk5. A 1.6 kb fragment of the cdk5 promoter was cloned, and activity of the promoter was found to be increased after overexpression of ΔFosB in cell culture. Moreover, mutation of the single consensus activator protein-1 site contained within the cdk5 promoter fragment completely abolished activation of the promoter by ΔFosB. Together, these results suggest that cdk5 is one target by which ΔFosB produces some of its physiological effects in the hippocampus and thereby mediates certain long-term consequences of chronic ECS treatment.
Overview
The claims and statistics of this paper haven’t been checked yet.
Run the check — free, no account needed. It reads the open-access text and checks the sources it cites.
Integrity signals
Registry
Cites
Statistics
Figures

Verification
Claims the paper makes
The claims and statistics of this paper haven’t been checked yet.
Run the check — free, no account needed. It reads the open-access text and checks the sources it cites.
Claims other papers make about this one
Each is checked against this paper’s own text: does it say what the citing paper says it does?
The source backs part of the claim, not all of it — or backs it for a different population, condition or comparison.
In the citing paper
“Furthermore, progressive activation of CDK5 co-occurs with increasing tau phosphorylation in rodent seizure models (Chen et al., 2000; Liang et al., 2009), indicating significant mediation of seizure-associated tau hyperphosphorylation by CDK5.”
From Tauopathy and Epilepsy Comorbidities and Underlying Mechanisms (2022) · cites this paper as Chen et al., 2000
Experimental — accuracy not yet measured
Self-check
Percentages, sums and reported differences re-computed from the paper’s own numbers.
The self-check needs the paper’s full text.
Citations
Cites
Tight control of gene expression in mammalian cells by tetracycline-responsive promoters.
Gossen, M., & Bujard, H. (1992) · Proceedings of the National Academy of Sciences · doi:10.1073/pnas.89.12.5547 · Cited by 4,943 · cited 2×
“In previous studies, we used the tetracycline gene regulation system (Gossen and Bujard, 1992) to develop bitransgenic mice that support the inducible expression of DFosB in specific brain regions, including the hippocampus (Chen et al.”
A molecular and cellular theory of depression
Duman, R. S. (1997) · Archives of General Psychiatry · doi:10.1001/archpsyc.1997.01830190015002 · Cited by 2,129
Nibuya, M., Morinobu, S., & Duman, R. (1995) · The Journal of Neuroscience · doi:10.1523/jneurosci.15-11-07539.1995 · Cited by 2,109
Hippocampal atrophy in recurrent major depression
Sheline, Y. I., Wang, P. W., Gado, M. H., Csernansky, J. G., & Vannier, M. W. (1996) · Proceedings of the National Academy of Sciences · doi:10.1073/pnas.93.9.3908 · Cited by 1,932
Hippocampal Volume Reduction in Major Depression
Bremner, J. D., Narayan, M., Anderson, E. R., Staib, L. H., Miller, H. L., & Charney, D. S. (2000) · American Journal of Psychiatry · doi:10.1176/ajp.157.1.115 · Cited by 1,670
Cortisol levels during human aging predict hippocampal atrophy and memory deficits
Lupien, S. J., de Leon, M., de Santi, S., Convit, A., Tarshish, C., Nair, N. P. V., Thakur, M., McEwen, B. S., Hauger, R. L., & Meaney, M. J. (1998) · Nature Neuroscience · doi:10.1038/271 · Cited by 1,653
Conversion of p35 to p25 deregulates Cdk5 activity and promotes neurodegeneration
Patrick, G. N., Zukerberg, L. R., Nikolić, M., de la Monte, S. M., Dikkes, P., & Tsai, L. (1999) · Nature · doi:10.1038/45159 · Cited by 1,541
Smith, M., Makino, S., Květňanský, R., & Post, R. M. (1995) · Journal of Neuroscience · doi:10.1523/jneurosci.15-03-01768.1995 · Cited by 1,449
Why stress is bad for your brain
Sapolsky, R. M. (1996) · Science · doi:10.1126/science.273.5276.749 · Cited by 1,306 · cited 1×
“Conversely, stress exerts the opposite effects in rodent models; it decreases BDNF expression, the sprouting of several neuronal cell types, and neurogenesis in the hippocampus (Smith et al., 1995; Sapolsky, 1996; Brown et al., 1999; Gould and Tanapat, 1999).”
BackgroundNibuya, M., Nestler, E., & Duman, R. (1996) · The Journal of Neuroscience · doi:10.1523/jneurosci.16-07-02365.1996 · Cited by 1,206
Self-citation
Cited by
Sorted by citations
Items 101–101 of 101
The role of chromatin remodelers in dopaminoceptive neurons
Zayed, A. (2019) · theses.fr (ABES) · doi:10.70675/f1d09c9dz29c5z44e4zae26z358715db672e
Metadata
- Authors
- Chen, J., Zhang, Y., Kelz, M. B., Steffen, C., Ang, E. S., Zeng, L., & Nestler, E. J.
- Affiliations
- Yale University (US)
- Venue
- The Journal of Neuroscience
- Publisher
- Society for Neuroscience
- Published
- 2000-12-15
- Volume
- 20
- Issue
- 24
- Pages
- 8965-8971
- ISSN
- 0270-6474 (ISSN-L)
- 1529-2401
- OpenAlex
- W4322703188
- Cited by
- 101
- References
- 38
- Citations by year
- 2025: 3 · 2024: 4 · 2023: 2 · 2022: 3 · 2021: 4 · 2019: 3 · 2018: 3 · 2017: 4 · 2016: 5 · 2015: 4 · 2014: 4 · 2013: 3 · 2012: 3
- FWCI
- 3.29
- Type
- journal article
- Language
- en
- Open access
- hybrid
- doi.org
- Licence
- Locations
- Journal of Neuroscience (publishedVersion, cc-by-nc-sa)
- Funders
- National Institute of Mental Health
- National Institute on Drug Abuse
- Topics
- Health Sciences › Medicine › Psychiatry and Mental health › Electroconvulsive Therapy Studies
- Health Sciences › Medicine › Pharmacology (medical) › Treatment of Major Depression
- Life Sciences › Neuroscience › Cognitive Neuroscience › Memory and Neural Mechanisms
- Keywords
- ΔFosB, cyclin-dependent kinase 5, electroconvulsive seizures, hippocampus, gene expression profiling, AP-1 transcription factor, tau phosphorylation, transgenic mice, antidepressant treatment, long-term synaptic plasticity
About these checks
Registry, retraction, Cites and statistics results are computed, not judged, with one exception: a printed reference that no index lists is read once by a model before it counts as a citation error. Claims are extracted by a model and kept only when their quote appears verbatim in the text; each cited source is then checked, with a model’s help, for whether it says what the claim relies on. Those verdicts can be wrong — read the claim’s quote and the cited source before relying on one.
Statistics and arithmetic are recomputed, not judged.
Confidence bands are shown only for fields calibrated on our annotated test set. None is calibrated yet, so no band is shown.
What counts as a claim ›How we measure confidence ›How we check this ›
Are you an author, or do you see a problem with this page? Request a review
