

The DOI matches its Crossref record; 62 of the 62 references it cites were found in a registry or an index.
The Architecture of Reward Value Coding in the Human Orbitofrontal Cortex
Open accessAbstract
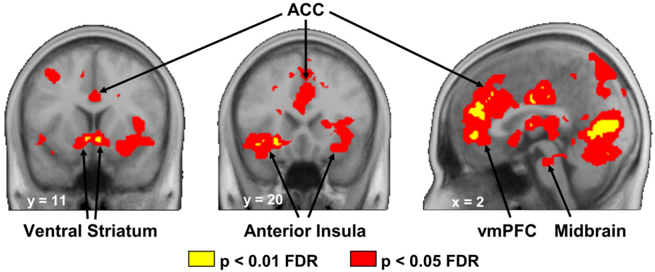
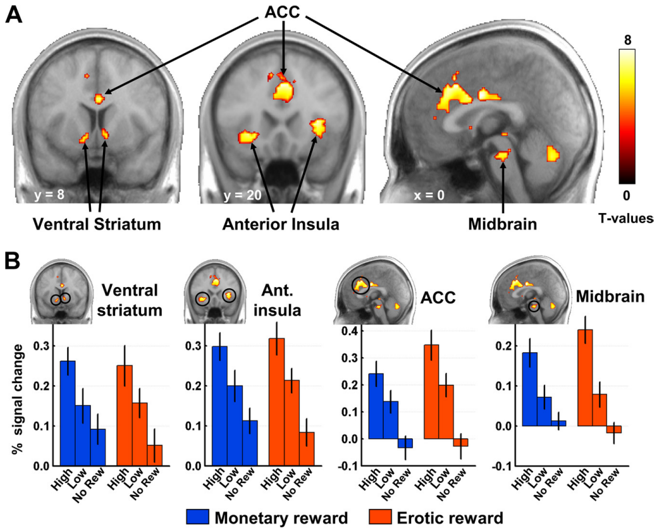
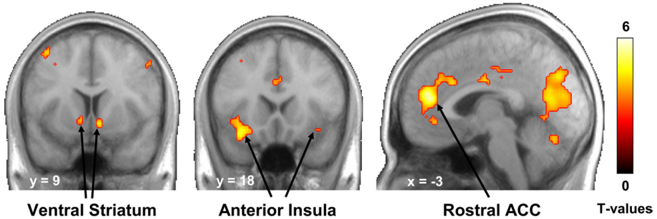
To ensure their survival, animals exhibit a number of reward-directed behaviors, such as foraging for food or searching for mates. This suggests that a core set of brain regions may be shared by many species to process different types of rewards. Conversely, many new brain areas have emerged over the course of evolution, suggesting potential specialization of specific brain regions in the processing of more recent rewards such as money. Here, using functional magnetic resonance imaging in humans, we identified the common and distinct brain systems processing the value of erotic stimuli and monetary gains. First, we provide evidence that a set of neural structures, including the ventral striatum, anterior insula, anterior cingulate cortex, and midbrain, encodes the subjective value of rewards regardless of their type, consistent with a general hedonic representation. More importantly, our results reveal reward-specific representations in the orbitofrontal cortex (OFC): whereas the anterior lateral OFC, a phylogenetically recent structure, processes monetary gains, the posterior lateral OFC, phylogenetically and ontogenetically older, processes more basic erotic stimuli. This dissociation between OFC representations of primary and secondary rewards parallels current views on lateral prefrontal cortex organization in cognitive control, suggesting an increasing trend in complexity along a postero-anterior axis according to more abstract representations. Together, our results support a modular view of reward value coding in the brain and propose that a unifying principle of postero-anterior organization can be applied to the OFC.
Overview
The claims and statistics of this paper haven’t been checked yet.
Run the check — free, no account needed. It reads the open-access text and checks the sources it cites.
Integrity signals
Registry
Cites
Statistics
Figures
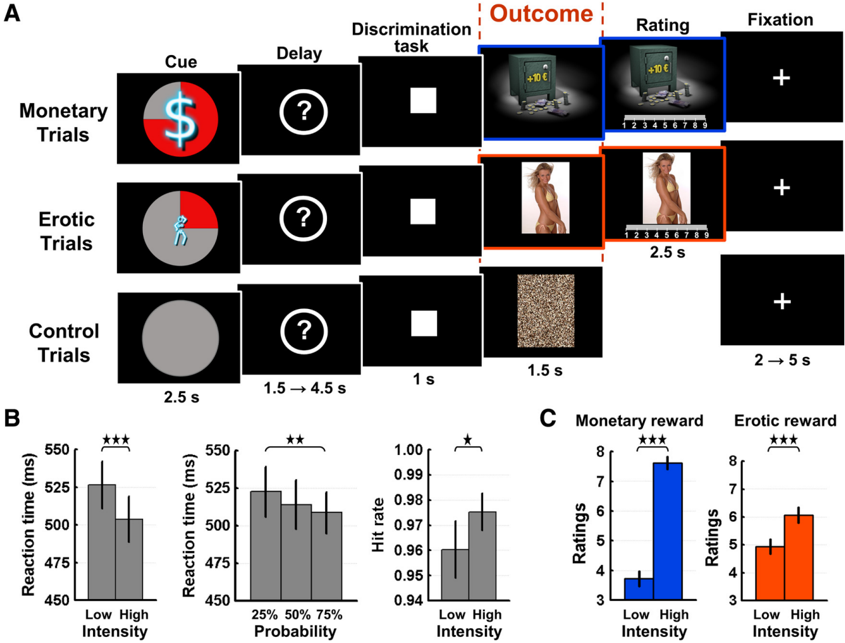
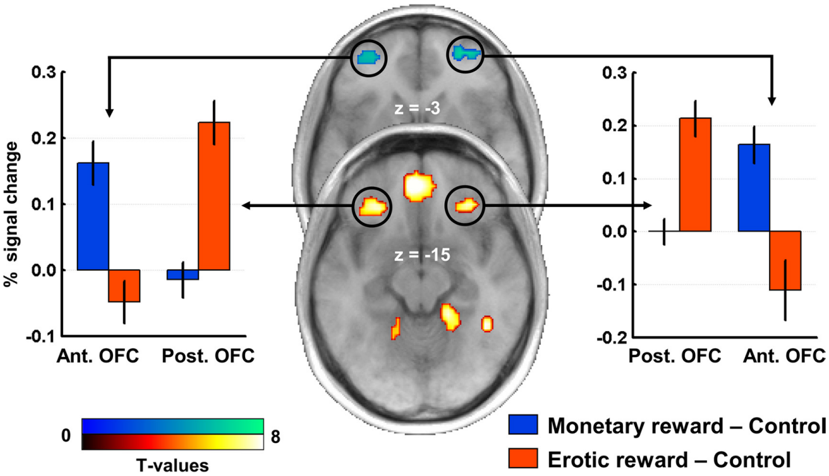
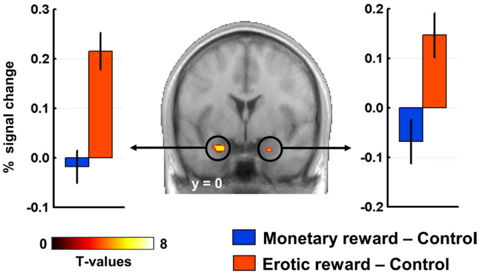
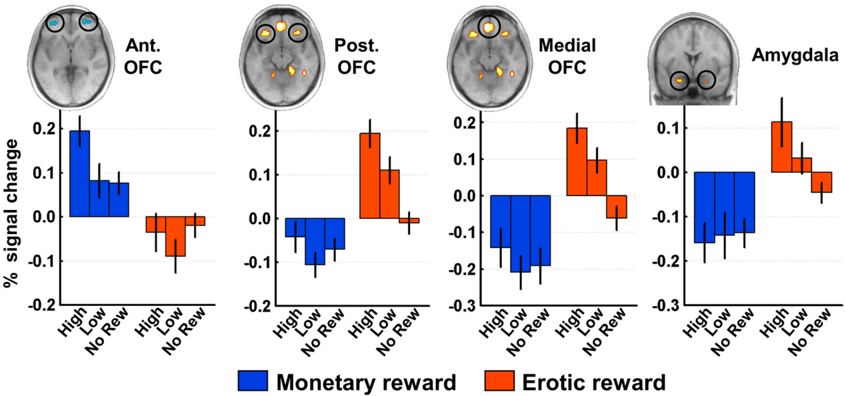
Verification
Claims the paper makes
The claims and statistics of this paper haven’t been checked yet.
Run the check — free, no account needed. It reads the open-access text and checks the sources it cites.
Claims other papers make about this one
Each is checked against this paper’s own text: does it say what the citing paper says it does?
In the citing paper
“This medial–lateral gradient interacts with a second hedonic gradient along the posterior–anterior axis, which represents secondary reinforcers (such as money), more anteriorly in the OFC than primary reinforcers (such as odors, food, touch, sexual pleasure, or drugs) [15,28,29].”
From Social “wanting” dysfunction in autism: neurobiological underpinnings and treatment implications (2012) · cites this paper as [28]
Self-check
Percentages, sums and reported differences re-computed from the paper’s own numbers.
The self-check needs the paper’s full text.
Citations
Cites
Circular analysis in systems neuroscience: the dangers of double dipping
Kriegeskorte, N., Simmons, W. K., Bellgowan, P. S. F., & Baker, C. I. (2009) · Nature Neuroscience · doi:10.1038/nn.2303 · Cited by 2,696
Ongur, D. (2000) · Cerebral Cortex · doi:10.1093/cercor/10.3.206 · Cited by 2,627
A framework for studying the neurobiology of value-based decision making
Rangel, A., Camerer, C., & Montague, P. R. (2008) · Nature Reviews Neuroscience · doi:10.1038/nrn2357 · Cited by 2,184
The somatic marker hypothesis: A neural theory of economic decision
Bechara, A., & Damasio, A. R. (2005) · Games and Economic Behavior · doi:10.1016/j.geb.2004.06.010 · Cited by 1,986
KRINGELBACH, M. (2004) · Progress in Neurobiology · doi:10.1016/j.pneurobio.2004.03.006 · Cited by 1,977
The neural correlates of subjective value during intertemporal choice
Kable, J. W., & Glimcher, P. W. (2007) · Nature Neuroscience · doi:10.1038/nn2007 · Cited by 1,916
Valid conjunction inference with the minimum statistic
Nichols, T. E., Brett, M., Andersson, J., Wager, T. D., & Poline, J. (2005) · NeuroImage · doi:10.1016/j.neuroimage.2004.12.005 · Cited by 1,854
Screening Depressed Patients in Family Practice
Beck, A. T., & Beck, R. W. (1972) · Postgraduate Medicine · doi:10.1080/00325481.1972.11713319 · Cited by 1,836
The Evolutionary Psychology of Facial Beauty
Rhodes, G. (2005) · Annual Review of Psychology · doi:10.1146/annurev.psych.57.102904.190208 · Cited by 1,821
Behavioral Theories and the Neurophysiology of Reward
Schultz, W. (2006) · Annual Review of Psychology · doi:10.1146/annurev.psych.56.091103.070229 · Cited by 1,637
Research works printed but not linked: 1
- Prevost C Pessiglione M Météreau E Clery-Melin ML Dreher JC (2010) Distinct valuation subsystems in the human brain for effort and delay. J Neurosci, in press.
Cited by
Sorted by citations
Items 101–200 of 352
Neural Correlates of Sexual Orientation in Heterosexual, Bisexual, and Homosexual Women
Safron, A., Klimaj, V., Sylva, D., Rosenthal, A. M., Li, M., Walter, M., & Bailey, J. M. (2018) · Scientific Reports · doi:10.1038/s41598-017-18372-0 · Cited by 56
Sharma, A. K., Satterthwaite, T. D., Vandekar, L., Katchmar, N., Daldal, A., Ruparel, K., Elliott, M. A., Baldassano, C. F., Thase, M. E., Gur, R. E., et al. (2016) · Psychiatry Research Neuroimaging · doi:10.1016/j.pscychresns.2016.06.003 · Cited by 55
Relationship between emotional experience and resilience: An fMRI study in fire-fighters
Reynaud, E., Guedj, É., Souville, M., Trousselard, M., Zendjidjian, X. Y., Khoury-Malhame, M. E., Fakra, É., Nazarian, B., Blin, O., Canini, F., et al. (2013) · Neuropsychologia · doi:10.1016/j.neuropsychologia.2013.01.007 · Cited by 54
Zhang, B., Lu, J., Xia, J., Wang, F., Li, W., Chen, F., Han, Y.-F., Chen, Y., Zhu, B., Zhao, Q., et al. (2017) · Scientific Reports · doi:10.1038/s41598-017-00421-3 · Cited by 51
Madan, C. R. (2017) · Collabra Psychology · doi:10.1525/collabra.111 · Cited by 53
Li, Y., Sescousse, G., Amiez, C., & Dreher, J. (2015) · Journal of Neuroscience · doi:10.1523/jneurosci.3058-14.2015 · Cited by 51
Self-citationPapageorgiou, G., Sallet, J., Wittmann, M. K., Chau, B. K. H., Schüffelgen, U., Buckley, M. J., & Rushworth, M. F. S. (2017) · Nature Communications · doi:10.1038/s41467-017-01833-5 · Cited by 49
Koot, S., Baars, A., Hesseling, P., van den Bos, R., & Joëls, M. (2013) · Neuropharmacology · doi:10.1016/j.neuropharm.2013.02.008 · Cited by 46
Borg, C., de Jong, P. J., & Georgiadis, J. R. (2012) · Social Cognitive and Affective Neuroscience · doi:10.1093/scan/nss117 · Cited by 47
Reward Sensitivity Is Associated with Brain Activity during Erotic Stimulus Processing
Costumero, V., Barrós-Loscertales, A., Bustamante, J. C., Ventura-Campos, N., Fuentes, P., Rosell-Negre, P., & Ávila, C. (2013) · PLoS ONE · doi:10.1371/journal.pone.0066940 · Cited by 45
BOLD responses in reward regions to hypothetical and imaginary monetary rewards
Miyapuram, K. P., Tobler, P. N., Gregorios-Pippas, L., & Schultz, W. (2011) · NeuroImage · doi:10.1016/j.neuroimage.2011.09.029 · Cited by 45
Imbalanced sensitivities to primary and secondary rewards in internet gaming disorder
(2021) · Journal of Behavioral Addictions · doi:10.1556/2006.2021.00072 · Cited by 44
Reward breaks through center‐surround inhibition via anterior insula
Wang, L., Yu, H., Hu, J., Theeuwes, J., Gong, X., Xiang, Y., Jiang, C., & Zhou, X. (2015) · Human Brain Mapping · doi:10.1002/hbm.23004 · Cited by 46
Gao, Y., Hu, Y., Wang, J., Liu, C., Im, H., Jin, W., Zhu, W., Ge, W., Zhao, G., Yao, Q., et al. (2025) · NeuroImage · doi:10.1016/j.neuroimage.2025.121029 · Cited by 43
High Reward Makes Items Easier to Remember, but Harder to Bind to a New Temporal Context
Madan, C. R., Fujiwara, E., Gerson, B. C., & Caplan, J. B. (2012) · Frontiers in Integrative Neuroscience · doi:10.3389/fnint.2012.00061 · Cited by 46
Clive Bell’s “Significant Form” and the neurobiology of aesthetics
Zeki, S. (2013) · Frontiers in Human Neuroscience · doi:10.3389/fnhum.2013.00730 · Cited by 45
Basal ganglia lateralization in different types of reward
Arsalidou, M., Vijayarajah, S., & Sharaev, M. (2020) · Brain Imaging and Behavior · doi:10.1007/s11682-019-00215-3 · Cited by 43
Thomas, J., Météreau, É., Déchaud, H., PUGEAT, M. M., & Dreher, J. (2014) · Psychoneuroendocrinology · doi:10.1016/j.psyneuen.2014.08.012 · Cited by 45
Self-citationWhat are the Odds? The Neural Correlates of Active Choice during Gambling
Studer, B., Apergis-Schoute, A. M., Robbins, T. W., & Clark, L. (2012) · Frontiers in Neuroscience · doi:10.3389/fnins.2012.00046 · Cited by 44
Converging prefrontal pathways support associative and perceptual features of conditioned stimuli
Howard, J. D., Kahnt, T., & Gottfried, J. A. (2016) · Nature Communications · doi:10.1038/ncomms11546 · Cited by 45
The Structural and Functional Organization of Cognition
Snow, P. J. (2016) · Frontiers in Human Neuroscience · doi:10.3389/fnhum.2016.00501 · Cited by 41
Huang, J., Zhang, Z., Gambeta, E., Chen, L., & Zamponi, G. W. (2021) · Cell Reports · doi:10.1016/j.celrep.2021.109033 · Cited by 40
Challenges of Interpreting Frontal Neurons during Value-Based Decision-Making
Wallis, J. D., & Rich, E. L. (2011) · Frontiers in Neuroscience · doi:10.3389/fnins.2011.00124 · Cited by 41
Attentional modulation of reward processing in the human brain
Rothkirch, M., Schmack, K., Deserno, L., Darmohray, D. M., & Sterzer, P. (2013) · Human Brain Mapping · doi:10.1002/hbm.22383 · Cited by 43
Humor and emotion: Quantitative meta analyses of functional neuroimaging studies
Farkas, A. H., Trotti, R. L., Edge, E. A., Huang, L.-Y., Kasowski, A., Thomas, O. F., Chlan, E., Granros, M., Patel, K., & Sabatinelli, D. (2021) · Cortex · doi:10.1016/j.cortex.2021.02.023 · Cited by 37
Hyatt, C. J., Assaf, M., Muska, C. E., Rosen, R. I., Thomas, A. D., Johnson, M. R., Hylton, J. L., Andrews, M. M., Reynolds, B. A., Krystal, J. H., et al. (2012) · PLoS ONE · doi:10.1371/journal.pone.0034917 · Cited by 38
Aberrant orbitofrontal cortex reactivity to erotic cues in compulsive sexual behavior disorder
Golec, K., Draps, M., Stark, R., Pluta, A., & Gola, M. (2021) · Journal of Behavioral Addictions · doi:10.1556/2006.2021.00051 · Cited by 36
Spikman, J. M., Boelen, D. H. E., Pijnenborg, G. H. M., Timmerman, M. E., van der Naalt, J., & Fasotti, L. (2013) · Neuropsychological Rehabilitation · doi:10.1080/09602011.2013.826138 · Cited by 36
Yan, C., Su, L., Wang, Y., Xu, T., Yin, D.-Z., Fan, M., Deng, C., Hu, Y., Wang, Z., Cheung, E. F. C., et al. (2016) · Scientific Reports · doi:10.1038/srep29079 · Cited by 38
Neural Correlates of Sex/Gender Differences in Humor Processing for Different Joke Types
Chan, Y. (2016) · Frontiers in Psychology · doi:10.3389/fpsyg.2016.00536 · Cited by 36
Pollak, T. A., Simoni, S. D., Barimani, B., Zelaya, F. O., Stone, J. M., & Mehta, M. A. (2015) · Psychopharmacology · doi:10.1007/s00213-015-4078-8 · Cited by 35
Neural and neurochemical basis of reinforcement-guided decision making
Khani, A., & Rainer, G. (2016) · Journal of Neurophysiology · doi:10.1152/jn.01113.2015 · Cited by 38
Safron, A., & DeYoung, C. G. (2021) · Elsevier eBooks · doi:10.1016/b978-0-12-819200-9.00010-7 · Cited by 34
Jin, C., Guan, M., Dong, M., Wu, J., He, Z., Chen, X., Shi, D., Ren, J., Shi, G., & Zhang, X. (2017) · Brain Imaging and Behavior · doi:10.1007/s11682-017-9805-9 · Cited by 33
Orbitofrontal connectivity is associated with depression and anxiety in marijuana-using adolescents
Subramaniam, P., Rogowska, J., DiMuzio, J. M., Lopez-Larson, M. P., McGlade, E., & Yurgelun-Todd, D. A. (2018) · Journal of Affective Disorders · doi:10.1016/j.jad.2018.07.002 · Cited by 33
Brain Imaging of Human Sexual Response: Recent Developments and Future Directions
Ruesink, G. B., & Georgiadis, J. R. (2017) · Current Sexual Health Reports · doi:10.1007/s11930-017-0123-4 · Cited by 33
Present bias for monetary and dietary rewards
Cheung, S. L., Tymula, A. A., & Wang, X. (2022) · Experimental Economics · doi:10.1007/s10683-022-09749-8 · Cited by 34
Cognitive-Emotion Interactions
Armony, J. L., & Vuilleumier, P. O. (2013) · Cambridge University Press eBooks · doi:10.1017/cbo9780511843716.018 · Cited by 33
Aberrations of anterior insular cortex functional connectivity in nontreatment-seeking alcoholics
Halcomb, M., Chumin, E. J., Goñi, J., Džemidžić, M., & Yoder, K. K. (2019) · Psychiatry Research Neuroimaging · doi:10.1016/j.pscychresns.2018.12.016 · Cited by 33
Do brain responses to emotional images and cigarette cues differ? An fMRI study in smokers
Versace, F., Engelmann, J. M., Jackson, E. F., Costa, V. D., Robinson, J. D., Lam, C. Y., Minnix, J. A., Brown, V., Wetter, D. W., & Cinciripini, P. M. (2011) · European Journal of Neuroscience · doi:10.1111/j.1460-9568.2011.07915.x · Cited by 31
Decreased reward value of biological motion among individuals with autistic traits
Williams, E. H., & Cross, E. S. (2017) · Cognition · doi:10.1016/j.cognition.2017.10.017 · Cited by 33
Liberg, B., Öberg, K. G., Jokinen, J., Savard, J., Dhejne, C., Arver, S., Fuß, J., Ingvar, M., & Abé, C. (2022) · Journal of Behavioral Addictions · doi:10.1556/2006.2022.00035 · Cited by 33
Neural coding of computational factors affecting decision making
Dreher, J. (2013) · Progress in brain research · doi:10.1016/b978-0-444-62604-2.00016-2 · Cited by 29
Self-citationImmediate processing of erotic stimuli in paedophilia and controls: a case control study
Habermeyer, B., Esposito, F., Händel, N., Lemoine, P., Klarhöfer, M., Mager, R., Dittmann, V., Seifritz, E., & Graf, M. (2013) · BMC Psychiatry · doi:10.1186/1471-244x-13-88 · Cited by 28
Motivation and Cognitive Control: Going Beyond Monetary Incentives
Krug, M. K., & Braver, T. S. (2014) · Springer eBooks · doi:10.1007/978-1-4939-0959-9_7 · Cited by 30
Chan, Y., Hsu, W.-C., & Chou, T. (2018) · Scientific Reports · doi:10.1038/s41598-018-33623-4 · Cited by 27
Neural mechanisms of affective matching across faces and scenes
Preckel, K., Trautwein, F., Paulus, F. M., Kirsch, P., Krach, S., Singer, T., & Kanske, P. (2019) · Scientific Reports · doi:10.1038/s41598-018-37163-9 · Cited by 27
Striatal and septo-hypothalamic responses to anticipation and outcome of affiliative rewards
Bortolini, T., Melo, B. R. P., Basílio, R., Fischer, R. D., Zahn, R., de Oliveira‐Souza, R., Knutson, B. D., & Moll, J. (2021) · NeuroImage · doi:10.1016/j.neuroimage.2021.118474 · Cited by 26
Pedophilic brain potential responses to adult erotic stimuli
Knott, V., Impey, D., Fisher, D. J., Delpero, E., & Fedoroff, P. (2015) · Brain Research · doi:10.1016/j.brainres.2015.12.004 · Cited by 26
Anatomy and connectivity of the reward circuit
Haber, S. N. (2009) · Elsevier eBooks · doi:10.1016/b978-0-12-374620-7.00001-7 · Cited by 28
Examining Neural Reactivity to Gambling Cues in the Age of Online Betting
Brevers, D., Sescousse, G., Maurage, P., & Billieux, J. (2019) · Current Behavioral Neuroscience Reports · doi:10.1007/s40473-019-00177-2 · Cited by 32
Self-citationAudrin, C., Ceravolo, L., Chanal, J. P., Brosch, T., & Sander, D. (2017) · Scientific Reports · doi:10.1038/s41598-017-16544-6 · Cited by 25
Hamelin, H., Poizat, G., Florian, C., Kursa, M. B., Pittaras, E., Callebert, J., Rampon, C., Taouis, M., Hamed, A., & Granon, S. (2021) · Cerebral Cortex · doi:10.1093/cercor/bhab274 · Cited by 25
Hartogsveld, B., Quaedflieg, C. W. E. M., van Ruitenbeek, P., & Smeets, T. (2022) · eNeuro · doi:10.1523/eneuro.0080-21.2021 · Cited by 27
Lawn, W., Freeman, T. P., Hindocha, C., Mokrysz, C., Das, R., Morgan, C. J. A., & Curran, H. V. (2015) · Psychopharmacology · doi:10.1007/s00213-015-3883-4 · Cited by 25
Wolf, D. H. (2011) · Frontiers in Behavioral Neuroscience · doi:10.3389/fnbeh.2011.00081 · Cited by 25
An ERP Study on Decisions between Attractive Females and Money
Zeng, J., Wang, Y., & Zhang, Q. (2012) · PLoS ONE · doi:10.1371/journal.pone.0045945 · Cited by 24
Behavioral Activation and Brain Network Changes in Depression
Jung, M., & Han, K. (2024) · Journal of Clinical Neurology · doi:10.3988/jcn.2024.0148 · Cited by 24
Subjective reward value of visual sexual stimuli is coded in human striatum and orbitofrontal cortex
Klein, S., Kruse, O., Markert, C., León, I. T., Strahler, J., & Stark, R. M. (2020) · Behavioural Brain Research · doi:10.1016/j.bbr.2020.112792 · Cited by 23
Klein, S., Krikova, K., Antons, S., Brand, M., Klucken, T., & Stark, R. M. (2022) · Current Addiction Reports · doi:10.1007/s40429-022-00423-w · Cited by 25
Schott, B. H., Voss, M., Wagner, B., Wüstenberg, T., Düzel, E., & Behr, J. (2015) · Frontiers in Behavioral Neuroscience · doi:10.3389/fnbeh.2015.00144 · Cited by 23
Reading the Freudian theory of sexual drives from a functional neuroimaging perspective
Stoléru, S. (2014) · Frontiers in Human Neuroscience · doi:10.3389/fnhum.2014.00157 · Cited by 25
Markert, C., Klein, S., Strahler, J., Kruse, O., & Stark, R. M. (2021) · Journal of Behavioral Addictions · doi:10.1556/2006.2021.00018 · Cited by 27
An fMRI-Based Neural Signature of Decisions to Smoke Cannabis
Bedi, G., Lindquist, M. A., & Haney, M. (2015) · Neuropsychopharmacology · doi:10.1038/npp.2015.135 · Cited by 24
Leong, S. L., De Ridder, D., Vanneste, S., Sutherland, W., Ross, S., & Manning, P. (2018) · Appetite · doi:10.1016/j.appet.2017.10.034 · Cited by 22
Ventromedial Prefrontal Cortex Tracks Multiple Environmental Variables during Search
Mehta, P. S., Tu, J. C., LoConte, G. A., Pesce, M. C., & Hayden, B. Y. (2019) · Journal of Neuroscience · doi:10.1523/jneurosci.2365-18.2019 · Cited by 24
Candy and the brain: neural response to candy gains and losses
Luking, K. R., & Barch, D. M. (2013) · Cognitive Affective & Behavioral Neuroscience · doi:10.3758/s13415-013-0156-8 · Cited by 25
Dopaminergic modulation of the trade-off between probability and time in economic decision-making
Arrondo, G., Aznárez‐Sanado, M., Fernández‐Seara, M. A., Goñi, J., Loayza, F. R., Salamon-Klobut, E., Heukamp, F. H., & Pastor, M. A. (2015) · European Neuropsychopharmacology · doi:10.1016/j.euroneuro.2015.02.011 · Cited by 22
Habermeyer, B., Händel, N., Lemoine, P., Klarhöfer, M., Seifritz, E., Dittmann, V., & Graf, M. (2011) · Neurocase · doi:10.1080/13554794.2011.627346 · Cited by 25
The evaluation and brain representation of pleasant touch in chronic and subacute back pain
Nees, F., Usai, K., Löffler, M., & Flor, H. (2018) · Neurobiology of Pain · doi:10.1016/j.ynpai.2018.10.002 · Cited by 22
Barreiros, I. V., Ishii, H., Walton, M., & Panayi, M. C. (2021) · Behavioral Neuroscience · doi:10.1037/bne0000442 · Cited by 20
Koritzky, G., He, Q., Xue, G., Wong, S. W. H., Xiao, L., & Bechara, A. (2013) · NeuroImage · doi:10.1016/j.neuroimage.2013.01.056 · Cited by 21
Kong, F., He, Q., Liu, X., Chen, X. S., Wang, X., & Zhao, J. (2017) · Journal of Personality · doi:10.1111/jopy.12306 · Cited by 21
Clarke, R. E., Verdejo‐García, A., & Andrews, Z. B. (2018) · Journal of Neurochemistry · doi:10.1111/jnc.14455 · Cited by 21
Lawn, W., Mitchener, L., Freeman, T. P., Benattayallah, A., Bisby, J. A., Wall, M. B., Dodds, C. M., Curran, H. V., & Morgan, C. J. A. (2019) · Addiction Biology · doi:10.1111/adb.12802 · Cited by 21
Kahnt, T., & Tobler, P. N. (2016) · Elsevier eBooks · doi:10.1016/b978-0-12-805308-9.00009-9 · Cited by 22
Dusi, N., Bracco, L., Bressi, C., Delvecchio, G., & Brambilla, P. (2021) · Journal of Affective Disorders · doi:10.1016/j.jad.2021.08.074 · Cited by 20
Semantic knowledge of social interactions is mediated by the hedonic evaluation system in the brain
Rijpma, M. G., Montembeault, M., Shdo, S. M., Kramer, J. H., Miller, B. L., & Rankin, K. P. (2023) · Cortex · doi:10.1016/j.cortex.2022.12.015 · Cited by 19
Basic Instinct Undressed: Early Spatiotemporal Processing for Primary Sexual Characteristics
Legrand, L. B., Zotto, M. D., Tyrand, R., & Pegna, A. J. (2013) · PLoS ONE · doi:10.1371/journal.pone.0069726 · Cited by 19
Neural substrates of sexual arousal in heterosexual males: event-related fMRI investigation
Seok, J., Sohn, J., & Cheong, C. (2016) · Journal of PHYSIOLOGICAL ANTHROPOLOGY · doi:10.1186/s40101-016-0089-3 · Cited by 19
Yang, X., Liu, X., Zeng, Y., Wu, R., Zhao, W., Xin, F., Yao, S., Kendrick, K. M., Ebstein, R. P., & Becker, B. (2021) · Brain Structure and Function · doi:10.1007/s00429-021-02333-5 · Cited by 19
Messimeris, D., Lévy, R., & Bouc, R. L. (2023) · Frontiers in Neurology · doi:10.3389/fneur.2023.1198262 · Cited by 19
Exposing orgasm in the brain: a critical eye
Georgiadis, J. R. (2011) · Sexual & Relationship Therapy · doi:10.1080/14681994.2011.647904 · Cited by 18
Neural encoding of food and monetary reward delivery
Oren, S., Tittgemeyer, M., Rigoux, L., Schlamann, M. U., Schönberg, T., & Kuzmanovic, B. (2022) · NeuroImage · doi:10.1016/j.neuroimage.2022.119335 · Cited by 20
Rosenberg, K. P., O’Connor, S., & Carnes, P. J. (2014) · Elsevier eBooks · doi:10.1016/b978-0-12-407724-9.00009-4 · Cited by 20
“Contemplating the Next Maneuver”
Leff, D. R., Yongue, G., Vlaev, I., Orihuela‐Espina, F., James, D. R. C., Taylor, M. J., Athanasiou, T., Dolan, R. J., Yang, G., & Darzi, A. W. (2016) · Annals of Surgery · doi:10.1097/sla.0000000000001651 · Cited by 19
Butlin, P. (2017) · Review of Philosophy and Psychology · doi:10.1007/s13164-017-0332-9 · Cited by 17
Ucha, M., Roura‐Martínez, D., Contreras, A., Pinto-Rivero, S., Orihuel, J., Ambrosio, E., & Higuera‐Matas, A. (2019) · Frontiers in Behavioral Neuroscience · doi:10.3389/fnbeh.2019.00022 · Cited by 17
Insular dichotomy in the implicit detection of emotions in human faces
Frot, M., Mauguìere, F., & García-Larrea, L. (2021) · Cerebral Cortex · doi:10.1093/cercor/bhab477 · Cited by 21
Functional neuroanatomy of human cortex cerebri in relation to wanting sex and having it
Georgiadis, J. R. (2015) · Clinical Anatomy · doi:10.1002/ca.22528 · Cited by 17
Barbour, T. A., Pruitt, P. J., & Diwadkar, V. A. (2012) · Journal of Affective Disorders · doi:10.1016/j.jad.2011.11.036 · Cited by 18
Morie, K. P., Wu, J., Landi, N., Potenza, M. N., Mayes, L. C., & Crowley, M. J. (2018) · Developmental Neuropsychology · doi:10.1080/87565641.2018.1439945 · Cited by 16
Distinct neural correlates of social and object reward seeking motivation
Dubey, I., Georgescu, A. L., Hommelsen, M., Vogeley, K. T., Ropar, D., & Hamilton, A. F. D. C. (2020) · European Journal of Neuroscience · doi:10.1111/ejn.14888 · Cited by 17
Neuroanatomical correlates of donating behavior in middle childhood
Wildeboer, A., Thijssen, S., Muetzel, R. L., Bakermans‐Kranenburg, M. J., Tiemeier, H. W., White, T. J. H., & van IJzendoorn, M. H. (2017) · Social Neuroscience · doi:10.1080/17470919.2017.1361864 · Cited by 14
Neural basis of multi-sensory communication in primates
Sliwa, J., Mallet, M., Christiaens, M., & Takahashi, D. Y. (2022) · Ethology Ecology & Evolution · doi:10.1080/03949370.2021.2024266 · Cited by 15
Segal, O., & Elkana, O. (2023) · Frontiers in Neuroanatomy · doi:10.3389/fnana.2023.1076095 · Cited by 15
Hong, D., Huang, W., Ji, A.-A., Yang, S.-S., Xu, H., Sun, K.-Y., Cao, A., Gao, W., Zhou, N., & Yu, P. (2018) · Metabolic Brain Disease · doi:10.1007/s11011-018-0360-x · Cited by 18
How Do Somatic Markers Feature in Decision Making?
Bartol, J., & Linquist, S. (2014) · Emotion Review · doi:10.1177/1754073914553000 · Cited by 14
Comparing gratitude and pride: evidence from brain and behavior
Ding, K., & Liu, J. (2022) · Cognitive Affective & Behavioral Neuroscience · doi:10.3758/s13415-022-01006-y · Cited by 15
Stoll, F. M., & Rudebeck, P. H. (2024) · Journal of Neuroscience · doi:10.1523/jneurosci.0464-24.2024 · Cited by 14
Metadata
- Authors
- Sescousse, G., Redouté, J., & Dreher, J.-C.
- Affiliations
- Centre National de la Recherche Scientifique (FR)
- Lyon 1 Université (FR)
- Venue
- The Journal of Neuroscience
- Publisher
- Society for Neuroscience
- Published
- 2010-09-29
- Volume
- 30
- Issue
- 39
- Pages
- 13095-13104
- ISSN
- 0270-6474 (ISSN-L)
- 1529-2401
- PMC
- PMC6633499
- OpenAlex
- W1983640865
- Cited by
- 353
- References
- 62
- Citations by year
- 2026: 5 · 2025: 14 · 2024: 16 · 2023: 8 · 2022: 20 · 2021: 31 · 2020: 39 · 2019: 14 · 2018: 22 · 2017: 20 · 2016: 34 · 2015: 27 · 2014: 28 · 2013: 27 · 2012: 26
- FWCI
- 14.35
- Type
- journal article
- Language
- en
- Open access
- hybrid
- doi.org
- Licence
- Locations
- Journal of Neuroscience (publishedVersion, cc-by-nc-sa)
- PubMed Central (publishedVersion)
- PubMed (publishedVersion)
- HAL (submittedVersion)
- Funders
- Fondation Fyssen
- Topics
- Life Sciences › Neuroscience › Cognitive Neuroscience › Neural and Behavioral Psychology Studies
- Life Sciences › Neuroscience › Cellular and Molecular Neuroscience › Neurotransmitter Receptor Influence on Behavior
- Social Sciences › Decision Sciences › General Decision Sciences › Decision-Making and Behavioral Economics
- Keywords
- orbitofrontal cortex, erotic stimuli, monetary gain, ventral striatum, anterior insula, anterior cingulate cortex, midbrain, lateral prefrontal cortex
- MeSH terms
- Adult, Amygdala, Brain Mapping, Humans, Male, Motivation, Nerve Net, Neuropsychological Tests, Photic Stimulation, Predictive Value of Tests, Reward, Social Values, Prefrontal Cortex, Young Adult, Pleasure
About these checks
Registry, retraction, Cites and statistics results are computed, not judged, with one exception: a printed reference that no index lists is read once by a model before it counts as a citation error. Claims are extracted by a model and kept only when their quote appears verbatim in the text; each cited source is then checked, with a model’s help, for whether it says what the claim relies on. Those verdicts can be wrong — read the claim’s quote and the cited source before relying on one.
Statistics and arithmetic are recomputed, not judged.
Confidence bands are shown only for fields calibrated on our annotated test set. None is calibrated yet, so no band is shown.
What counts as a claim ›How we measure confidence ›How we check this ›
Are you an author, or do you see a problem with this page? Request a review
