Student or educator? Sign up with your school email and get 6 months of Pro free.
Cited by 118

The DOI matches its Crossref record; 8 of the 8 references it cites were found in a registry or an index.

Decreased synthesis of ribosomal proteins in tauopathy revealed by non-canonical amino acid labelling

Evans, Harrison Tudor, Benetatos, Joseph, van Roijen, Marloes, Bodea, Liviu‐Gabriel, Götz, Jürgen·2019·The EMBO Journal

Overview

The claims and statistics of this paper haven’t been checked yet.

Run the check — free, no account needed. It reads the open-access text and checks the sources it cites.

A few free checks a day · papers already verified open instantly · results are public

Integrity signals

Registry

Crossref · 10.15252/embj.2018101174

Cites

8 of 8 references verified0 citation errors · 0 not checkable

Statistics

Figures

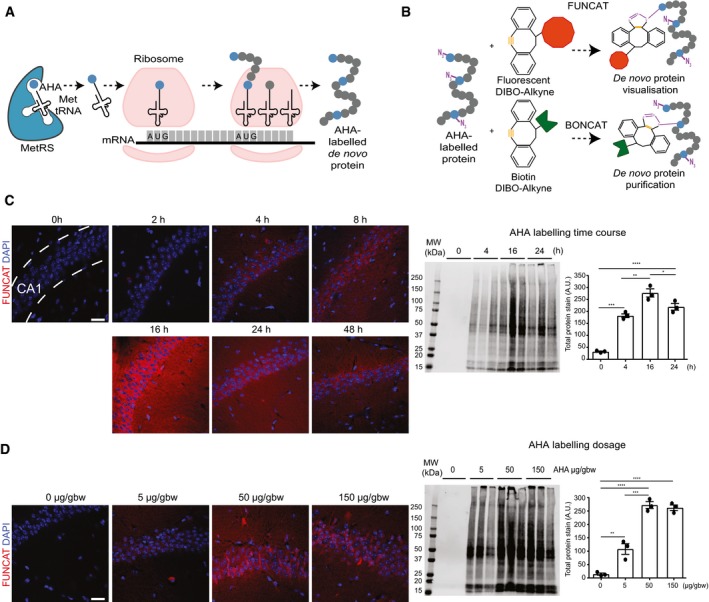
Figure 1 Establishing conditions of azidohomoalanine (AHA) labelling to examine protein synthesis in mice following intraperitoneal administration Schematic representation of AHA labelling as a tool to identify newly synthesised proteins. De novo synthesised proteins are labelled with AHA at the amino‐terminal and internal methionine residues using the endogenous translational machinery.AHA‐labelled proteins can be covalently bonded through reaction of the azide group (purple) of AHA with the alkyne group (orange) of tags and either visualised using fluorescent non‐canonical amino acid tagging (FUNCAT) or purified using bio‐orthogonal non‐canonical amino acid tagging (BONCAT) for further analysis.FUNCAT visualisation in wild‐type (WT) mice treated for varying time periods with 50 μg AHA per gram body weight (gbw). AHA incorporation can be observed as early as 4‐h post‐injection in the CA1 region of the hippocampus and is still observed 48‐h post‐injection. Western blot analysis of AHA‐labelled proteins purified from whole hemisphere (without the cerebellum) with BONCAT reveals that maximal AHA labelling occurs approximately 16‐h post‐injection (n = 3 mice, one‐way ANOVA, Tukey's multiple comparison test).AHA‐labelled proteins in WT mice treated with ascending concentrations of AHA were visualised using FUNCAT. Scale bar: 40 μm. Western blot of AHA‐labelled proteins purified from whole hemisphere (without the cerebellum) using BONCAT reveals that maximal AHA labelling occurs when mice are administered 50 μg AHA/gbw (n = 3 mice, one‐way ANOVA, Tukey's multiple comparison test).Data information: Mean ± SEM. *P ≤ 0.05, **P ≤ 0.01, ***P ≤ 0.001, ****P ≤ 0.0001. Scale bar: 40 μm.
Figure 1 Establishing conditions of azidohomoalanine (AHA) labelling to examine protein synthesis in mice following intraperitoneal administration Schematic representation of AHA labelling as a tool to identify newly synthesised proteins. De novo synthesised proteins are labelled with AHA at the amino‐terminal and internal methionine residues using the endogenous translational machinery.AHA‐labelled proteins can be covalently bonded through reaction of the azide group (purple) of AHA with the alkyne group (orange) of tags and either visualised using fluorescent non‐canonical amino acid tagging (FUNCAT) or purified using bio‐orthogonal non‐canonical amino acid tagging (BONCAT) for further analysis.FUNCAT visualisation in wild‐type (WT) mice treated for varying time periods with 50 μg AHA per gram body weight (gbw). AHA incorporation can be observed as early as 4‐h post‐injection in the CA1 region of the hippocampus and is still observed 48‐h post‐injection. Western blot analysis of AHA‐labelled proteins purified from whole hemisphere (without the cerebellum) with BONCAT reveals that maximal AHA labelling occurs approximately 16‐h post‐injection (n = 3 mice, one‐way ANOVA, Tukey's multiple comparison test).AHA‐labelled proteins in WT mice treated with ascending concentrations of AHA were visualised using FUNCAT. Scale bar: 40 μm. Western blot of AHA‐labelled proteins purified from whole hemisphere (without the cerebellum) using BONCAT reveals that maximal AHA labelling occurs when mice are administered 50 μg AHA/gbw (n = 3 mice, one‐way ANOVA, Tukey's multiple comparison test).Data information: Mean ± SEM. *P ≤ 0.05, **P ≤ 0.01, ***P ≤ 0.001, ****P ≤ 0.0001. Scale bar: 40 μm.CC BY-NC-ND · PubMed Central
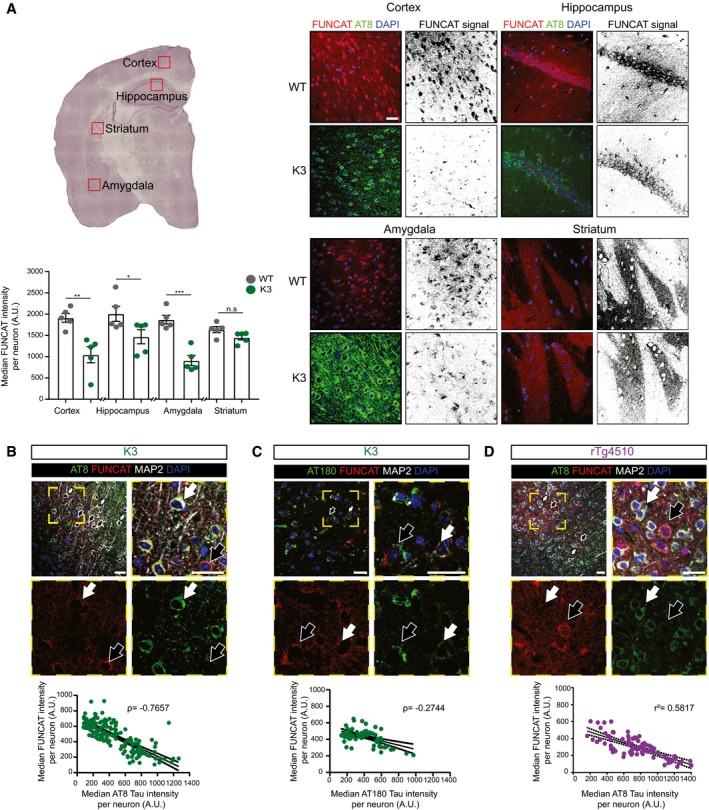
Figure 2 Protein synthesis is decreased in neurons with AT8 tau pathology In 5‐month‐old K3 mice, brain regions analysed by microscopy corresponding to layer 2/3 of the cortex, the CA1 region of the hippocampus and the amygdala, which contain neurons with high levels of AT8‐positivity, show significantly less FUNCAT signal compared with WT brains. In the striatum, where no AT8 immunoreactivity is observed, there is no difference in FUNCAT signal between the two genotypes (two‐way ANOVA, Sidak's multiple comparison test, n = 5 animals, three sections per animal).In layer 2/3 of the cortex of 5‐month‐old K3 mice, the FUNCAT signal negatively correlates with AT8 tau. Neurons with strong AT8 tau pathology and a low FUNCAT signal are indicated by white filled arrows, whereas neurons with low AT8 tau pathology and a high FUNCAT signal are indicated by black filled arrows (Spearman's correlation, ρ = −0.7657, standard error of correlation shown by black dotted line, n = 5 animals, 30 neurons per animal).FUNCAT signal is negatively correlated with AT180 signal in layer 2/3 of the cortex of 5‐month‐old K3 mice. Neurons with high AT180 tau pathology and a low FUNCAT signal are indicated by white filled arrows, whereas neurons with low AT8 tau pathology and a high FUNCAT signal are indicated by black filled arrows (Spearman's correlation, ρ = −0.2744, p standard error of correlation shown by a black dotted line, n = 5 animals, 15 ≤ neurons per animal).FUNCAT and AT8 tau signal are negatively correlated in layer 2/3 cortical neurons of 3‐month‐old rTg4510 mice. Neurons with strong AT8 tau pathology and a low FUNCAT signal are indicated by white filled arrows, whereas neurons with low AT8 tau pathology and a high FUNCAT signal are indicated by black filled arrows (Pearson's correlation, r 2 = 0.5817, standard error of correlation shown by a black dotted line, n = 3 animals, 30 neurons per animal).Data information: Mean ± SEM. *P ≤ 0.05, **P ≤ 0.01, ***P ≤ 0.001. Scale bar: 40 μm.
Figure 2 Protein synthesis is decreased in neurons with AT8 tau pathology In 5‐month‐old K3 mice, brain regions analysed by microscopy corresponding to layer 2/3 of the cortex, the CA1 region of the hippocampus and the amygdala, which contain neurons with high levels of AT8‐positivity, show significantly less FUNCAT signal compared with WT brains. In the striatum, where no AT8 immunoreactivity is observed, there is no difference in FUNCAT signal between the two genotypes (two‐way ANOVA, Sidak's multiple comparison test, n = 5 animals, three sections per animal).In layer 2/3 of the cortex of 5‐month‐old K3 mice, the FUNCAT signal negatively correlates with AT8 tau. Neurons with strong AT8 tau pathology and a low FUNCAT signal are indicated by white filled arrows, whereas neurons with low AT8 tau pathology and a high FUNCAT signal are indicated by black filled arrows (Spearman's correlation, ρ = −0.7657, standard error of correlation shown by black dotted line, n = 5 animals, 30 neurons per animal).FUNCAT signal is negatively correlated with AT180 signal in layer 2/3 of the cortex of 5‐month‐old K3 mice. Neurons with high AT180 tau pathology and a low FUNCAT signal are indicated by white filled arrows, whereas neurons with low AT8 tau pathology and a high FUNCAT signal are indicated by black filled arrows (Spearman's correlation, ρ = −0.2744, p standard error of correlation shown by a black dotted line, n = 5 animals, 15 ≤ neurons per animal).FUNCAT and AT8 tau signal are negatively correlated in layer 2/3 cortical neurons of 3‐month‐old rTg4510 mice. Neurons with strong AT8 tau pathology and a low FUNCAT signal are indicated by white filled arrows, whereas neurons with low AT8 tau pathology and a high FUNCAT signal are indicated by black filled arrows (Pearson's correlation, r 2 = 0.5817, standard error of correlation shown by a black dotted line, n = 3 animals, 30 neurons per animal).Data information: Mean ± SEM. *P ≤ 0.05, **P ≤ 0.01, ***P ≤ 0.001. Scale bar: 40 μm.CC BY-NC-ND · PubMed Central
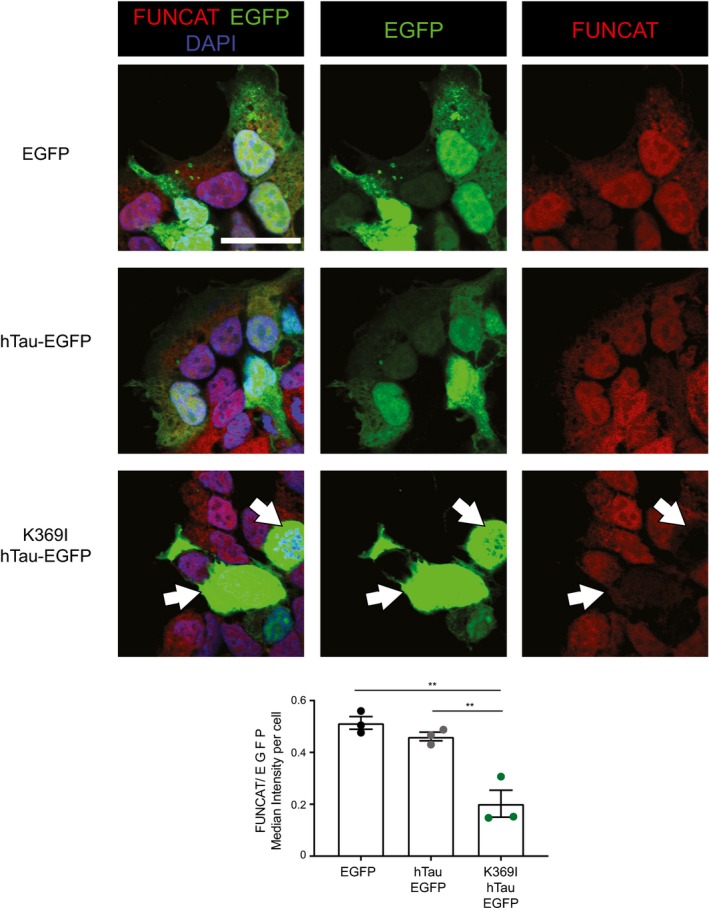
Figure EV1 HEK293 cells transfected with K369I‐hTau‐EGFP have significantly decreased protein synthesis compared with EGFP or hTau‐EGFP expressing cells After treatment with AHA for 4 h, HEK293 cells transfected with K369I‐hTau (1N4R)‐EGFP showed a significantly lower FUNCAT signal normalised to the EGFP signal than cells transfected with hTau (1N4R)‐EGFP or the EGFP vector alone, suggesting that protein synthesis is decreased in the mutant cells (one‐way ANOVA, Tukey's multiple comparison test, n = 3 replicates). Cells with K369I‐hTau‐EGFP and low FUNCAT signal are indicated by white filled arrows. Data information: Mean ± SEM. **P ≤ 0.01, ***P ≤ 0.001. Scale bar: 40 μm.
Figure EV1 HEK293 cells transfected with K369I‐hTau‐EGFP have significantly decreased protein synthesis compared with EGFP or hTau‐EGFP expressing cells After treatment with AHA for 4 h, HEK293 cells transfected with K369I‐hTau (1N4R)‐EGFP showed a significantly lower FUNCAT signal normalised to the EGFP signal than cells transfected with hTau (1N4R)‐EGFP or the EGFP vector alone, suggesting that protein synthesis is decreased in the mutant cells (one‐way ANOVA, Tukey's multiple comparison test, n = 3 replicates). Cells with K369I‐hTau‐EGFP and low FUNCAT signal are indicated by white filled arrows. Data information: Mean ± SEM. **P ≤ 0.01, ***P ≤ 0.001. Scale bar: 40 μm.CC BY-NC-ND · PubMed Central
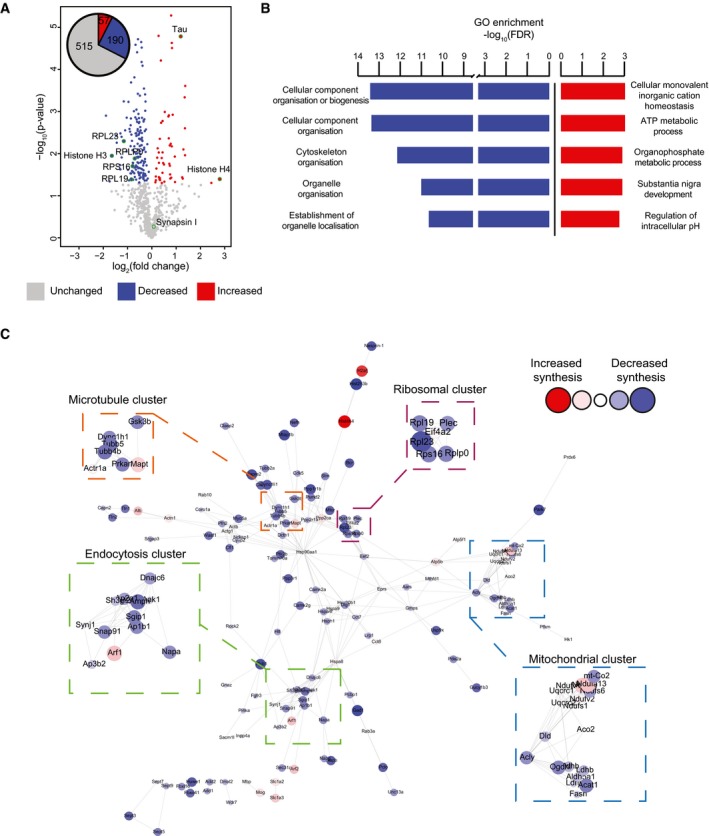
Figure 3 Alteration of specific cellular pathways revealed by quantitative de novo proteomics analysis of K3 mice Relative abundance of de novo synthesised proteins in 5‐month‐old K3 and WT mice. 762 proteins were quantified using SWATH‐MS across 5 K3 and 5 WT samples. The fold‐change was calculated for individual proteins by comparing the relative protein abundance in K3 vs. WT mice. Proteins displaying significantly increased synthesis in K3 mice (fold‐change > 1, P ≤ 0.05) are shown in red, whereas those exhibiting significantly decreased synthesis (fold‐change < 1, P ≤ 0.05) are shown in blue. Candidate proteins are encircled in green.Gene ontology (GO) analysis of proteins which were significantly altered in synthesis in K3 mice. GO analyses were performed separately for proteins exhibiting significantly increased or decreased synthesis in K3 mice using the STRING database. The 5 biological functions identified with the lowest false discovery rates (FDR) are displayed.STRING network analysis of proteins with significantly altered synthesis in K3 mice. Only interactions with a STRING score ≥ 0.7 are shown. Evidence of interaction is represented by the distance between nodes, with more tightly packed nodes having a higher STRING score. Proteins that did not display interactions are not shown. Node size and colour are linearly related to fold‐change. The microtubule, endocytosis, mitochondrial and ribosomal clusters contain tightly packed nodes and are depicted magnified in the inserts.
Figure 3 Alteration of specific cellular pathways revealed by quantitative de novo proteomics analysis of K3 mice Relative abundance of de novo synthesised proteins in 5‐month‐old K3 and WT mice. 762 proteins were quantified using SWATH‐MS across 5 K3 and 5 WT samples. The fold‐change was calculated for individual proteins by comparing the relative protein abundance in K3 vs. WT mice. Proteins displaying significantly increased synthesis in K3 mice (fold‐change > 1, P ≤ 0.05) are shown in red, whereas those exhibiting significantly decreased synthesis (fold‐change < 1, P ≤ 0.05) are shown in blue. Candidate proteins are encircled in green.Gene ontology (GO) analysis of proteins which were significantly altered in synthesis in K3 mice. GO analyses were performed separately for proteins exhibiting significantly increased or decreased synthesis in K3 mice using the STRING database. The 5 biological functions identified with the lowest false discovery rates (FDR) are displayed.STRING network analysis of proteins with significantly altered synthesis in K3 mice. Only interactions with a STRING score ≥ 0.7 are shown. Evidence of interaction is represented by the distance between nodes, with more tightly packed nodes having a higher STRING score. Proteins that did not display interactions are not shown. Node size and colour are linearly related to fold‐change. The microtubule, endocytosis, mitochondrial and ribosomal clusters contain tightly packed nodes and are depicted magnified in the inserts.CC BY-NC-ND · PubMed Central
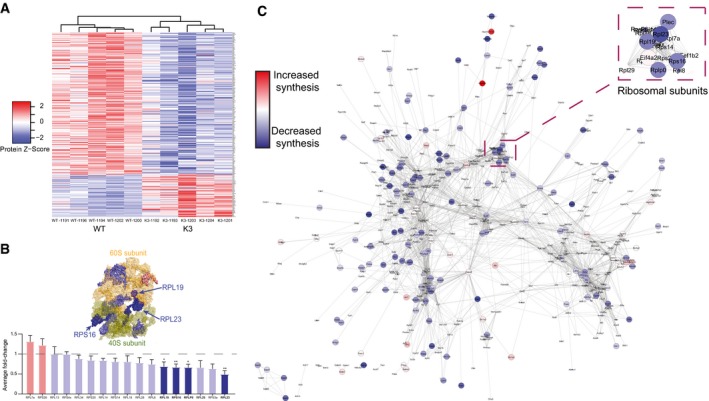
Figure EV2 Heatmap and STRING analysis of the de novo proteome reveals alterations in protein synthesis between K3 and WT mice Heatmap of the relative abundance in individual samples of 247 proteins that are significantly altered in synthesis in K3 mice compared with WT controls. Clustering analysis using average linkage shows that K3 and WT samples cluster separately.The average fold‐change in the synthesis of ribosomal proteins in K3 mice compared with WT mapped onto a surface representation of the structure of the ribosome complex (PDB: 3J7R). Proteins showing significantly decreased synthesis (fold‐change < 1, P ≤ 0.05) in K3 mice (RPL23, RPLP0, RPL19 & RPS16) are represented in dark blue (Student's t‐test, n = 5 animals).Network analysis of all de novo synthesised proteins identified in SWATH‐MS analysis. Interactions between proteins (nodes) were examined using the STRING database, with only interactions with a STRING score ≥ 0.7 being shown. Evidence of interaction is represented by the distance between nodes, with more tightly packed nodes having a higher STRING score. Proteins not displaying interactions are not shown. Proteins that showed significantly altered synthesis in K3 mice compared with WT controls (P ≤ 0.05) are shown by large nodes. The node colour is linearly related to the fold‐change. The ribosomal node is detailed in the magnification.Data information: Mean ± SEM. *P ≤ 0.05, **P ≤ 0.01.
Figure EV2 Heatmap and STRING analysis of the de novo proteome reveals alterations in protein synthesis between K3 and WT mice Heatmap of the relative abundance in individual samples of 247 proteins that are significantly altered in synthesis in K3 mice compared with WT controls. Clustering analysis using average linkage shows that K3 and WT samples cluster separately.The average fold‐change in the synthesis of ribosomal proteins in K3 mice compared with WT mapped onto a surface representation of the structure of the ribosome complex (PDB: 3J7R). Proteins showing significantly decreased synthesis (fold‐change < 1, P ≤ 0.05) in K3 mice (RPL23, RPLP0, RPL19 & RPS16) are represented in dark blue (Student's t‐test, n = 5 animals).Network analysis of all de novo synthesised proteins identified in SWATH‐MS analysis. Interactions between proteins (nodes) were examined using the STRING database, with only interactions with a STRING score ≥ 0.7 being shown. Evidence of interaction is represented by the distance between nodes, with more tightly packed nodes having a higher STRING score. Proteins not displaying interactions are not shown. Proteins that showed significantly altered synthesis in K3 mice compared with WT controls (P ≤ 0.05) are shown by large nodes. The node colour is linearly related to the fold‐change. The ribosomal node is detailed in the magnification.Data information: Mean ± SEM. *P ≤ 0.05, **P ≤ 0.01.CC BY-NC-ND · PubMed Central
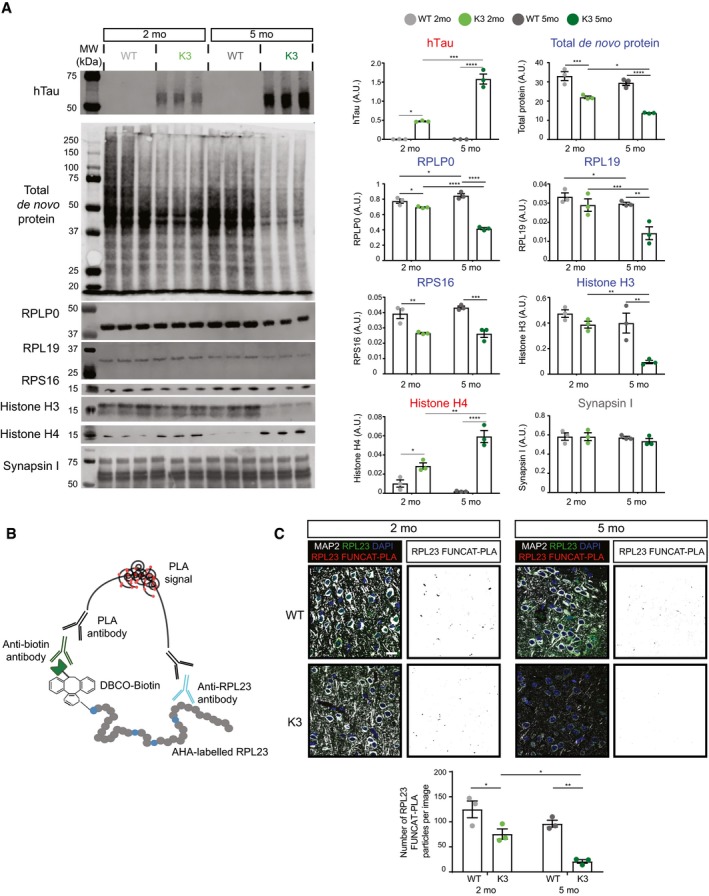
Figure 4 The synthesis of select ribosomal subunits is decreased in an age‐dependent manner in K3 mice Western blot analysis of de novo synthesised proteins demonstrates age‐dependent alterations in protein synthesis in K3 mice compared with WT controls. AHA‐labelled proteins from 2‐ and 5‐month‐old K3 and WT mice were purified using BONCAT and probed by Western blotting (BONCAT‐WB). The synthesis of ribosomal proteins RPLP0, RPL19 and RPS16, as well as histone H3, was found to be significantly decreased in K3 mice, whereas that of histone H4 was increased and that of synapsin I was unaltered (two‐way ANOVA, Sidak's multiple comparison test, n = 3 animals).Schematic representation of the FUNCAT‐PLA (proximity ligation assay) technique, showing that newly synthesised, AHA‐labelled RPL23 is biotinylated using DIBO‐biotin and subsequently co‐labelled with anti‐biotin and anti‐RPL23 primary antibodies. Co‐labelling is then detected using PLA antibodies, which results in a fluorescent signal when the two targets are in close proximity (i.e. < 40 nm apart).Synthesis of RPL23 in K3 mice is decreased in an age‐dependent manner. Compared to WT mice, significantly lower numbers of RPL23 FUNCAT‐PLA punctae are detected in layer 2/3 cortical neurons of K3 mice at both 2 and 5 months of age (two‐way ANOVA, Sidak's multiple comparison test, n = 3 animals).Data information: Mean ± SEM. *P ≤ 0.05, **P ≤ 0.01, ***P ≤ 0.001, ****P ≤ 0.0001. Scale bar: 40 μm.Source data are available online for this figure.
Figure 4 The synthesis of select ribosomal subunits is decreased in an age‐dependent manner in K3 mice Western blot analysis of de novo synthesised proteins demonstrates age‐dependent alterations in protein synthesis in K3 mice compared with WT controls. AHA‐labelled proteins from 2‐ and 5‐month‐old K3 and WT mice were purified using BONCAT and probed by Western blotting (BONCAT‐WB). The synthesis of ribosomal proteins RPLP0, RPL19 and RPS16, as well as histone H3, was found to be significantly decreased in K3 mice, whereas that of histone H4 was increased and that of synapsin I was unaltered (two‐way ANOVA, Sidak's multiple comparison test, n = 3 animals).Schematic representation of the FUNCAT‐PLA (proximity ligation assay) technique, showing that newly synthesised, AHA‐labelled RPL23 is biotinylated using DIBO‐biotin and subsequently co‐labelled with anti‐biotin and anti‐RPL23 primary antibodies. Co‐labelling is then detected using PLA antibodies, which results in a fluorescent signal when the two targets are in close proximity (i.e. < 40 nm apart).Synthesis of RPL23 in K3 mice is decreased in an age‐dependent manner. Compared to WT mice, significantly lower numbers of RPL23 FUNCAT‐PLA punctae are detected in layer 2/3 cortical neurons of K3 mice at both 2 and 5 months of age (two‐way ANOVA, Sidak's multiple comparison test, n = 3 animals).Data information: Mean ± SEM. *P ≤ 0.05, **P ≤ 0.01, ***P ≤ 0.001, ****P ≤ 0.0001. Scale bar: 40 μm.Source data are available online for this figure.CC BY-NC-ND · PubMed Central
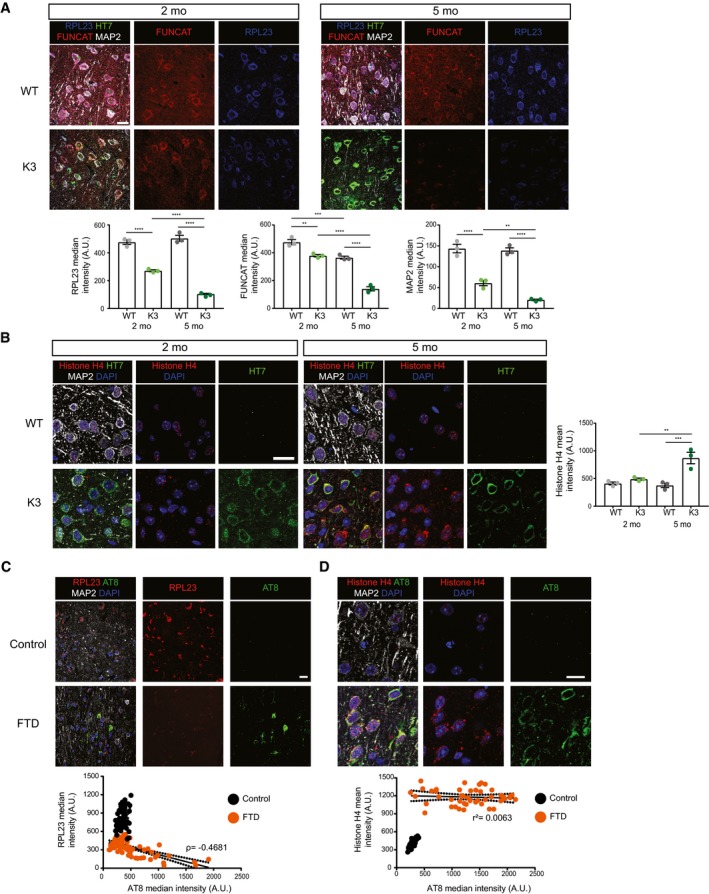
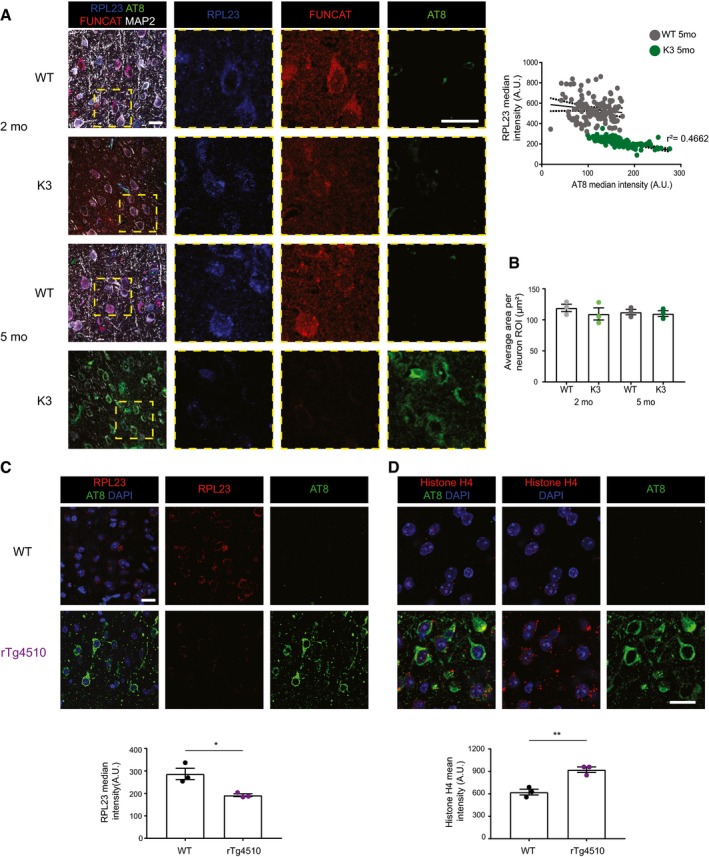
Figure 5 The total abundance of RPL23 and histone H4 is altered in K3 mice and human FTD brains The total abundance of RPL23 is decreased in K3 mice compared with WT controls at both 2 and 5 months of age. RPL23, FUNCAT and MAP2 signal intensities are decreased in layer 2/3 cortical neurons of K3 mice in an age‐dependent manner (two‐way ANOVA, Sidak's multiple comparison test, n = 3 animals).Histone H4 levels are increased in layer 2/3 of the cortex of K3 compared with WT mice at 5 months of age. This difference is not observed at 2 months of age (two‐way ANOVA, Sidak's multiple comparison test, n = 3 animals).Levels of RPL23 are significantly decreased in neurons from the superior frontal cortex of human FTD brains compared with healthy controls. This decrease correlates with AT8 tau (Spearman's correlation, ρ = −0.4681, standard error of correlation represented by black dots, Student's t‐test, n > 3, ≥ 15 neurons per sample).Histone H4 levels are significantly increased in neurons from the superior frontal cortex of human FTD brains compared with healthy controls (Student's t‐test, n = 3, ≥ 15 neurons per sample). This increase is not correlated with AT8 (Pearson's correlation r 2 = 0.0063, standard error of correlation represented by black dots).Data information: Mean ± SEM. **P ≤ 0.01, ***P ≤ 0.001, ****P ≤ 0.0001. Scale bar: 40 μm.
Figure 5 The total abundance of RPL23 and histone H4 is altered in K3 mice and human FTD brains The total abundance of RPL23 is decreased in K3 mice compared with WT controls at both 2 and 5 months of age. RPL23, FUNCAT and MAP2 signal intensities are decreased in layer 2/3 cortical neurons of K3 mice in an age‐dependent manner (two‐way ANOVA, Sidak's multiple comparison test, n = 3 animals).Histone H4 levels are increased in layer 2/3 of the cortex of K3 compared with WT mice at 5 months of age. This difference is not observed at 2 months of age (two‐way ANOVA, Sidak's multiple comparison test, n = 3 animals).Levels of RPL23 are significantly decreased in neurons from the superior frontal cortex of human FTD brains compared with healthy controls. This decrease correlates with AT8 tau (Spearman's correlation, ρ = −0.4681, standard error of correlation represented by black dots, Student's t‐test, n > 3, ≥ 15 neurons per sample).Histone H4 levels are significantly increased in neurons from the superior frontal cortex of human FTD brains compared with healthy controls (Student's t‐test, n = 3, ≥ 15 neurons per sample). This increase is not correlated with AT8 (Pearson's correlation r 2 = 0.0063, standard error of correlation represented by black dots).Data information: Mean ± SEM. **P ≤ 0.01, ***P ≤ 0.001, ****P ≤ 0.0001. Scale bar: 40 μm.CC BY-NC-ND · PubMed Central
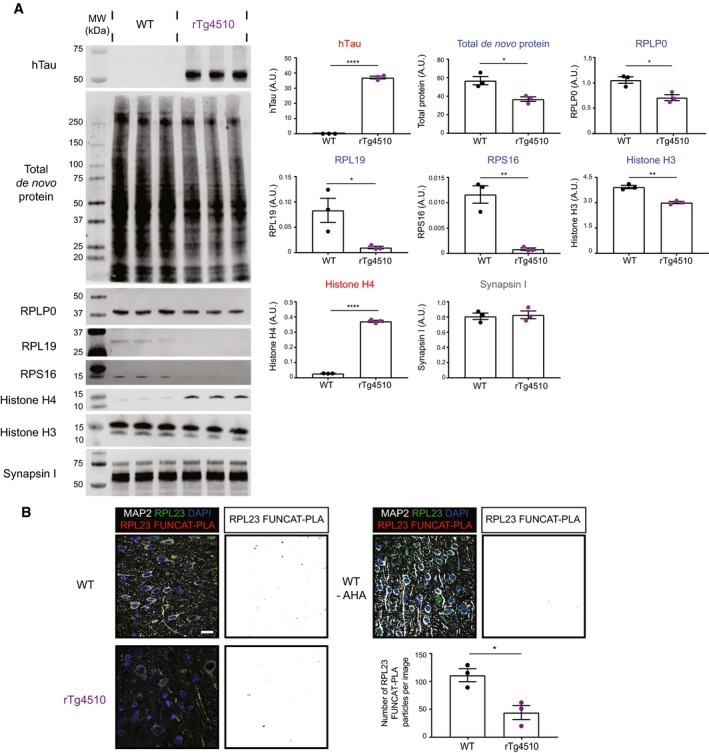
Figure EV3 The synthesis of selected ribosomal subunits is decreased in rTg4510 Western blot analysis of de novo synthesised proteins reveals altered protein synthesis in rTg4510 mice compared with WT controls. AHA‐labelled proteins from rTg4510 and WT mice were purified using BONCAT and probed via Western blotting. The synthesis of the ribosomal proteins RPLP0, RPL19 and RPS16, as well as histone H3, was significantly decreased in rTg4510 mice, whereas that of histone H4 was increased, and that of synapsin I was unaltered (Student's t‐test, n = 3 animals).Synthesis of RPL23 is decreased in rTg4510 mice. Compared to WT mice, significantly lower numbers of RPL23 FUNCAT‐PLA punctae are detected in layer 2/3 cortical neurons of rTg4510 mice (Student's t‐test, n = 3 animals). A PBS‐treated WT control is also shown as a negative control.Data information: Mean ± SEM. *P ≤ 0.05, **P ≤ 0.01, ****P ≤ 0.0001. Scale bar: 40 μm.Source data are available online for this figure.
Figure EV3 The synthesis of selected ribosomal subunits is decreased in rTg4510 Western blot analysis of de novo synthesised proteins reveals altered protein synthesis in rTg4510 mice compared with WT controls. AHA‐labelled proteins from rTg4510 and WT mice were purified using BONCAT and probed via Western blotting. The synthesis of the ribosomal proteins RPLP0, RPL19 and RPS16, as well as histone H3, was significantly decreased in rTg4510 mice, whereas that of histone H4 was increased, and that of synapsin I was unaltered (Student's t‐test, n = 3 animals).Synthesis of RPL23 is decreased in rTg4510 mice. Compared to WT mice, significantly lower numbers of RPL23 FUNCAT‐PLA punctae are detected in layer 2/3 cortical neurons of rTg4510 mice (Student's t‐test, n = 3 animals). A PBS‐treated WT control is also shown as a negative control.Data information: Mean ± SEM. *P ≤ 0.05, **P ≤ 0.01, ****P ≤ 0.0001. Scale bar: 40 μm.Source data are available online for this figure.CC BY-NC-ND · PubMed Central
Figure EV4 Total abundance of RPL23 and histone H4 is altered in K3 and rTg4510 mice RPL23 levels are negatively correlated with AT8 phospho‐tau in the cortex of 5‐month‐old K3 mice (Pearson's correlation, r 2 = 0.4662, standard error of correlation represented by dotted black lines, n = 3 animals, ≥ 30 neurons per animal). AT8‐positive neurons were not detected in 2‐month‐old K3 mice.The average area of regions of interest drawn around individual neurons using MAP2 labelling does not differ between K3 and WT mice (two‐way ANOVA, Sidak's multiple comparison test, n = 3 animals, ≥ 30 neurons per animal).The total abundance of RPL23 is decreased in rTg4510 mice compared with WT controls (Student's t‐test, n = 3 animals).Histone H4 levels are increased in layer 2/3 of the cortex of rTg4510 mice compared with WT mice (Student's t‐test, n = 3 animals).Data information: Mean ± SEM. *P ≤ 0.05, **P ≤ 0.01. Scale bar: 40 μm.
Figure EV4 Total abundance of RPL23 and histone H4 is altered in K3 and rTg4510 mice RPL23 levels are negatively correlated with AT8 phospho‐tau in the cortex of 5‐month‐old K3 mice (Pearson's correlation, r 2 = 0.4662, standard error of correlation represented by dotted black lines, n = 3 animals, ≥ 30 neurons per animal). AT8‐positive neurons were not detected in 2‐month‐old K3 mice.The average area of regions of interest drawn around individual neurons using MAP2 labelling does not differ between K3 and WT mice (two‐way ANOVA, Sidak's multiple comparison test, n = 3 animals, ≥ 30 neurons per animal).The total abundance of RPL23 is decreased in rTg4510 mice compared with WT controls (Student's t‐test, n = 3 animals).Histone H4 levels are increased in layer 2/3 of the cortex of rTg4510 mice compared with WT mice (Student's t‐test, n = 3 animals).Data information: Mean ± SEM. *P ≤ 0.05, **P ≤ 0.01. Scale bar: 40 μm.CC BY-NC-ND · PubMed Central

Verification

Claims the paper makes

The claims and statistics of this paper haven’t been checked yet.

Run the check — free, no account needed. It reads the open-access text and checks the sources it cites.

A few free checks a day · papers already verified open instantly · results are public

Claims other papers make about this one

Each is checked against this paper’s own text: does it say what the citing paper says it does?

Self-check

Percentages, sums and reported differences re-computed from the paper’s own numbers.

The self-check needs the paper’s full text.

Citations

Cites

Research works printed but not linked: 39

  1. Anjo SI, Santa C, Manadas B (2017) SWATH‐MS as a tool for biomarker discovery: from basic research to clinical applications. Proteomics 17: 1600278 · DOI
  2. Babicki S, Arndt D, Marcu A, Liang Y, Grant JR, Maciejewski A, Wishart DS (2016) Heatmapper: web‐enabled heat mapping for all. Nucleic Acids Res 44: W147–W153 · DOI
  3. Beatty KE, Fisk JD, Smart BP, Lu YY, Szychowski J, Hangauer MJ, Baskin JM, Bertozzi CR, Tirrell DA (2010) Live‐cell imaging of cellular proteins by a strain‐promoted azide‐alkyne cycloaddition. ChemBioChem 11: 2092–2095 · DOI
  4. Bernabò P, Tebaldi T, Groen EJN, Lane FM, Perenthaler E, Mattedi F, Newbery HJ, Zhou H, Zuccotti P, Potrich V et al (2017) In vivo translatome profiling in spinal muscular atrophy reveals a role for SMN protein in ribosome biology. Cell Rep 21: 953–965 · DOI
  5. Bodea L‐G, Evans HT, Van der Jeugd A, Ittner LM, Delerue F, Kril J, Halliday G, Hodges J, Kiernan MC, Götz J (2017) Accelerated aging exacerbates a pre‐existing pathology in a tau transgenic mouse model. Aging Cell 16: 377–386 · DOI
  6. Calve S, Witten AJ, Ocken AR, Kinzer‐Ursem TL (2016) Incorporation of non‐canonical amino acids into the developing murine proteome. Sci Rep 6: 32377 · DOI
  7. tom Dieck S, Kochen L, Hanus C, Heumüller M, Bartnik I, Nassim‐Assir B, Merk K, Mosler T, Garg S, Bunse S et al (2015) Direct visualization of newly synthesized target proteins in situ. Nat Methods 12: 411–414 · DOI
  8. Dörrbaum AR, Kochen L, Langer JD, Schuman EM (2018) Local and global influences on protein turnover in neurons and glia. Elife 7: 1–24 · DOI · Paper page
  9. Erdmann I, Marter K, Kobler O, Niehues S, Abele J, Müller A, Bussmann J, Storkebaum E, Ziv T, Thomas U et al (2015) Cell‐selective labelling of proteomes in Drosophila melanogaster. Nat Commun 6: 7521 · DOI
  10. Garcia‐Esparcia P, Hernández‐Ortega K, Koneti A, Gil L, Delgado‐Morales R, Castaño E, Carmona M, Ferrer I (2015) Altered machinery of protein synthesis is region‐ and stage‐dependent and is associated with α‐synuclein oligomers in Parkinson's disease. Acta Neuropathol Commun 3: 76 · DOI
  11. van Geel R, Pruijn GJM, van Delft FL, Boelens WC (2012) Preventing thiol‐yne addition improves the specificity of strain‐promoted azide‐alkyne cycloaddition. Bioconjug Chem 23: 392–398 · DOI
  12. Goedert M, Spillantini MG (2011) Pathogenesis of the tauopathies. J Mol Neurosci 45: 425–431 · DOI
  13. Götz J, Bodea L‐G, Goedert M (2018) Rodent models for Alzheimer disease. Nat Rev Neurosci 19: 583–598 · DOI · Paper page
  14. Hinz FI, Dieterich DC, Tirrell DA, Schuman EM (2012) Noncanonical amino acid labeling in vivo to visualize and affinity purify newly synthesized proteins in larval zebrafish. ACS Chem Neurosci 3: 40–49 · DOI
  15. Hinz F, Dieterich D, Schuman E (2013) Teaching old NCATs new tricks: using non‐canonical amino acid tagging to study neuronal plasticity. Curr Opin Chem Biol 17: 738–746 · DOI
  16. Ittner LM, Fath T, Ke YD, Bi M, van Eersel J, Li KM, Gunning P, Götz J (2008) Parkinsonism and impaired axonal transport in a mouse model of frontotemporal dementia. Proc Natl Acad Sci 105: 15997–16002 · DOI
  17. Ke YD, Suchowerska AK, van der Hoven J, De Silva DM, Wu CW, van Eersel J, Ittner A, Ittner LM (2012) Lessons from tau‐deficient mice. Int J Alzheimers Dis 2012: 1–8
  18. Klinge S, Voigts‐Hoffmann F, Leibundgut M, Arpagaus S, Ban N (2011) Crystal structure of the eukaryotic 60S ribosomal subunit in complex with initiation factor 6. Science 334: 941–948 · DOI
  19. Li C, Götz J (2017) Somatodendritic accumulation of Tau in Alzheimer's disease is promoted by Fyn‐mediated local protein translation. EMBO J 36: 3120–3138 · DOI
  20. Liang V, Ullrich M, Lam H, Chew YL, Banister S, Song X, Zaw T, Kassiou M, Götz J, Nicholas HR (2014) Altered proteostasis in aging and heat shock response in C. elegans revealed by analysis of the global and de novo synthesized proteome. Cell Mol Life Sci 71: 3339–3361 · DOI
  21. Link AJ, Vink MKS, Tirrell DA (2004) Presentation and detection of Azide functionality in bacterial cell surface proteins. J Am Chem Soc 126: 10598–10602 · DOI
  22. Lu X, Wang L, Yu C, Yu D, Yu G (2015) Histone acetylation modifiers in the pathogenesis of Alzheimer's disease. Front Cell Neurosci 9: 226
  23. Maina MB, Bailey LJ, Wagih S, Biasetti L, Pollack SJ, Quinn JP, Thorpe JR, Doherty AJ, Serpell LC (2018) The involvement of tau in nucleolar transcription and the stress response. Acta Neuropathol Commun 6: 70 · DOI
  24. McClatchy DB, Ma Y, Liu C, Stein BD, Martínez‐Bartolomé S, Vasquez D, Hellberg K, Shaw RJ, Yates JR (2015) Pulsed Azidohomoalanine labeling in mammals (PALM) detects changes in liver‐specific LKB1 knockout mice. J Proteome Res 14: 4815–4822 · DOI
  25. Narayan PJ, Lill C, Faull R, Curtis MA, Dragunow M (2015) Increased acetyl and total histone levels in post‐mortem Alzheimer's disease brain. Neurobiol Dis 74: 281–294 · DOI
  26. Neumann M, Schulz‐Schaeffer W, Crowther RA, Smith MJ, Spillantini MG, Goedert M, Kretzschmar HA (2001) Pick's disease associated with the novel tau gene mutation K369I. Ann Neurol 50: 503–513 · DOI
  27. Ngo JT, Schuman EM, Tirrell DA (2013) Mutant methionyl‐tRNA synthetase from bacteria enables site‐selective N‐terminal labeling of proteins expressed in mammalian cells. Proc Natl Acad Sci 110: 4992–4997 · DOI
  28. Perez‐Riverol Y, Csordas A, Bai J, Bernal‐Llinares M, Hewapathirana S, Kundu DJ, Inuganti A, Griss J, Mayer G, Eisenacher M et al (2019) The PRIDE database and related tools and resources in 2019: improving support for quantification data. Nucleic Acids Res 47: D442–D450 · DOI
  29. Polanco JC, Li C, Durisic N, Sullivan R, Götz J (2018) Exosomes taken up by neurons hijack the endosomal pathway to spread to interconnected neurons. Acta Neuropathol Commun 6: 10 · DOI
  30. Rangaraju V, tom Dieck S, Schuman EM (2017) Local translation in neuronal compartments: how local is local? EMBO Rep 18: 693–711 · DOI
  31. Reed LA, Schelper RL, Solodkin A, Van Hoesen GW, Van Hoesen GW, Solodkin A, Morris JC, Trojanowski JQ, Grabowski TJ, Talbot CJ et al (1997) Autosomal dominant dementia with widespread neurofibrillary tangles. Ann Neurol 42: 564–572 · DOI
  32. Santacruz K, Lewis J, Spires T, Paulson J, Kotilinek L, Ingelsson M, Guimaraes A, DeTure M, Ramsden M, McGowan E et al (2005) Tau suppression in a neurodegenerative mouse model improves memory function. Science 309: 476–481 · DOI · Paper page
  33. Shi Z, Fujii K, Kovary KM, Genuth NR, Röst HL, Teruel MN, Barna M (2017) Heterogeneous ribosomes preferentially translate distinct subpools of mRNAs genome‐wide. Mol Cell 67: 71–83 · DOI
  34. Slomnicki LP, Pietrzak M, Vashishta A, Jones J, Lynch N, Elliot S, Poulos E, Malicote D, Morris BE, Hallgren J et al (2016) Requirement of neuronal ribosome synthesis for growth and maintenance of the Dendritic tree. J Biol Chem 291: 5721–5739 · DOI
  35. Sotiropoulos I, Galas M‐C, Silva JM, Skoulakis E, Wegmann S, Maina MB, Blum D, Sayas CL, Mandelkow E‐M, Mandelkow E et al (2017) Atypical, non‐standard functions of the microtubule associated Tau protein. Acta Neuropathol Commun 5: 91 · DOI
  36. Ullrich M, Liang V, Chew YL, Banister S, Song X, Zaw T, Lam H, Berber S, Kassiou M, Nicholas HR et al (2014) Bio‐orthogonal labeling as a tool to visualize and identify newly synthesized proteins in Caenorhabditis elegans. Nat Protoc 9: 2237–2255 · DOI
  37. Vanderweyde T, Apicco DJ, Youmans‐Kidder K, Ash PEA, Cook C, Lummertz da Rocha E, Jansen‐West K, Frame AA, Citro A, Leszyk JD et al (2016) Interaction of tau with the RNA‐binding protein TIA1 regulates tau pathophysiology and toxicity. Cell Rep 15: 1455–1466 · DOI · Paper page
  38. Xia D, Gutmann JM, Götz J (2016) Mobility and subcellular localization of endogenous, gene‐edited Tau differs from that of over‐expressed human wild‐type and P301L mutant Tau. Sci Rep 6: 29074 · DOI
  39. Zatloukal B, Kufferath I, Thueringer A, Landegren U, Zatloukal K, Haybaeck J (2014) Sensitivity and specificity of in situ proximity ligation for protein interaction analysis in a model of steatohepatitis with mallory‐denk bodies. PLoS One 9: e96690 · DOI

Cited by

See all 118

Metadata

Authors
Evans, H. T., Benetatos, J., van Roijen, M., Bodea, L., & Götz, J.
Venue
The EMBO Journal
Published
2019-05-22
Volume
38
Issue
13
ISSN
  • 0261-4189
  • 1460-2075
Cited by
118
References
8
Language
en
Funders
  • Department of Education and Training | Australian Research Council (DP160103812)
  • Federal Government of Australia (ACT900116)
  • National Institute of Alcohol Abuse and Alcoholism of the National Institutes of Health (R28AA012725)
  • Department of Health | National Health and Medical Research Council (GNT1127999)

About these checks

Registry, retraction, Cites and statistics results are computed, not judged, with one exception: a printed reference that no index lists is read once by a model before it counts as a citation error. Claims are extracted by a model and kept only when their quote appears verbatim in the text; each cited source is then checked, with a model’s help, for whether it says what the claim relies on. Those verdicts can be wrong — read the claim’s quote and the cited source before relying on one.

Statistics and arithmetic are recomputed, not judged.

Confidence bands are shown only for fields calibrated on our annotated test set. None is calibrated yet, so no band is shown.

What counts as a claim ›How we measure confidence ›How we check this ›

Are you an author, or do you see a problem with this page? Request a review

Data sources

Bibliographic data: Semantic Scholar, OpenAlex, Crossref.

Contains information from the Semantic Scholar Academic Graph Datasets, made available under the ODC Attribution License (ODC-BY 1.0).

Semantic Scholar’s data is described in: Kinney, R., et al. (2023). The Semantic Scholar Open Data Platform. arXiv:2301.10140.