Cited by 351Alzheimer's disease research and treatmentsNeuroinflammation and Neurodegeneration MechanismsNeuroscience and Neuropharmacology Research

The DOI matches its Crossref record; 42 of the 42 references it cites were found in a registry or an index.

Inhibition of Stat3‐mediated astrogliosis ameliorates pathology in an Alzheimer's disease model

Open access

Abstract

Reactive astrogliosis is a hallmark of Alzheimer's disease (AD), but its role for disease initiation and progression has remained incompletely understood. We here show that the transcription factor Stat3 (signal transducer and activator of transcription 3), a canonical inducer of astrogliosis, is activated in an AD mouse model and human AD. Therefore, using a conditional knockout approach, we deleted Stat3 specifically in astrocytes in the APP/PS1 model of AD. We found that Stat3‐deficient APP/PS1 mice show decreased β‐amyloid levels and plaque burden. Plaque‐close microglia displayed a more complex morphology, internalized more β‐amyloid, and upregulated amyloid clearance pathways in Stat3‐deficient mice. Moreover, astrocyte‐specific Stat3‐deficient APP/PS1 mice showed decreased pro‐inflammatory cytokine activation and lower dystrophic neurite burden, and were largely protected from cerebral network imbalance. Finally, Stat3 deletion in astrocytes also strongly ameliorated spatial learning and memory decline in APP/PS1 mice. Importantly, these protective effects on network dysfunction and cognition were recapitulated in APP/PS1 mice systemically treated with a preclinical Stat3 inhibitor drug. In summary, our data implicate Stat3‐mediated astrogliosis as an important therapeutic target in AD.

Overview

The claims and statistics of this paper haven’t been checked yet.

Run the check — free, no account needed. It reads the open-access text and checks the sources it cites.

A few free checks a day · papers already verified open instantly · results are public

Integrity signals

Registry

Crossref · 10.15252/emmm.201809665

Cites

42 of 42 references verified0 citation errors · 0 not checkable

Statistics

Figures

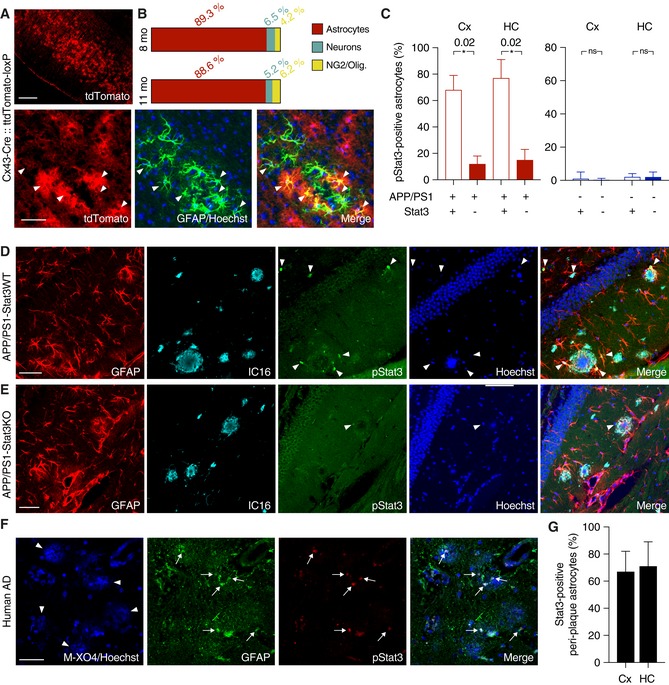
Figure 1 Stat3 activation in an AD model is efficiently reduced using a conditional knockout strategy A, BTo verify the specificity of Cx43‐CreERT mice for astrocytes, mice were crossed to a tdTomato reporter line to induce Cre‐dependent tdTomato expression after tamoxifen administration. TdTomato fluorescence was enhanced with an antibody against red fluorescent protein, and astrocytes were stained with antibodies against GFAP or S100β (not shown). Merged images and quantification show efficient and widespread tdTomato expression specific for astrocytes (arrowheads indicate tdTomato and GFAP overlap) in 8‐ and 11‐month‐old animals. Expression was low in neurons (stained with NeuN, not shown) and negligible in NG2 cells and oligodendrocytes. Scale bars, 250 μm (upper panel) and 50 μm (lower panel).CThe majority of peri‐plaque astrocytes in APP/PS1‐Stat3WT were positive for activated/phosphorylated Stat3 (pStat3) in the cortex (Cx) and hippocampus (HC), whereas the fraction of pStat3‐positive astrocytes was significantly lower in APP/PS1‐Stat3KO mice in both regions (n = 8 mice (three females and five males) per group; age, 8 months; *P < 0.05, Mann–Whitney test). The occurrence of pStat3 in WT‐Stat3KO and WT‐Stat3WT mice was negligible (n = 8 mice (four females and four males) per group; age, 8 months; Mann–Whitney test).D, EExamples of Stat3 activation in APP/PS1‐Stat3KO and APP/PS1‐Stat3WT. (D) pStat3 (arrowheads) was abundantly present in reactive astrocytes (identified by GFAP) around plaques (identified by IC16). (E) Only few astrocytes were positive for pStat3 in APP/PS1‐Stat3WT mice. Scale bars, 50 μm.F, GIn postmortem brain sections from AD patients, we detected nuclear pStat3 (arrows) in the majority of peri‐plaque reactive astrocytes (identified by GFAP) in the cortex and hippocampus (plaques were stained with methoxy‐XO4, arrowheads). Scale bar, 50 μm. In total, n = 4 cortical and n = 3 hippocampal sections were analyzed.Data information: Data are represented as mean ± SEM.
Figure 1 Stat3 activation in an AD model is efficiently reduced using a conditional knockout strategy A, BTo verify the specificity of Cx43‐CreERT mice for astrocytes, mice were crossed to a tdTomato reporter line to induce Cre‐dependent tdTomato expression after tamoxifen administration. TdTomato fluorescence was enhanced with an antibody against red fluorescent protein, and astrocytes were stained with antibodies against GFAP or S100β (not shown). Merged images and quantification show efficient and widespread tdTomato expression specific for astrocytes (arrowheads indicate tdTomato and GFAP overlap) in 8‐ and 11‐month‐old animals. Expression was low in neurons (stained with NeuN, not shown) and negligible in NG2 cells and oligodendrocytes. Scale bars, 250 μm (upper panel) and 50 μm (lower panel).CThe majority of peri‐plaque astrocytes in APP/PS1‐Stat3WT were positive for activated/phosphorylated Stat3 (pStat3) in the cortex (Cx) and hippocampus (HC), whereas the fraction of pStat3‐positive astrocytes was significantly lower in APP/PS1‐Stat3KO mice in both regions (n = 8 mice (three females and five males) per group; age, 8 months; *P < 0.05, Mann–Whitney test). The occurrence of pStat3 in WT‐Stat3KO and WT‐Stat3WT mice was negligible (n = 8 mice (four females and four males) per group; age, 8 months; Mann–Whitney test).D, EExamples of Stat3 activation in APP/PS1‐Stat3KO and APP/PS1‐Stat3WT. (D) pStat3 (arrowheads) was abundantly present in reactive astrocytes (identified by GFAP) around plaques (identified by IC16). (E) Only few astrocytes were positive for pStat3 in APP/PS1‐Stat3WT mice. Scale bars, 50 μm.F, GIn postmortem brain sections from AD patients, we detected nuclear pStat3 (arrows) in the majority of peri‐plaque reactive astrocytes (identified by GFAP) in the cortex and hippocampus (plaques were stained with methoxy‐XO4, arrowheads). Scale bar, 50 μm. In total, n = 4 cortical and n = 3 hippocampal sections were analyzed.Data information: Data are represented as mean ± SEM.CC BY · PubMed Central
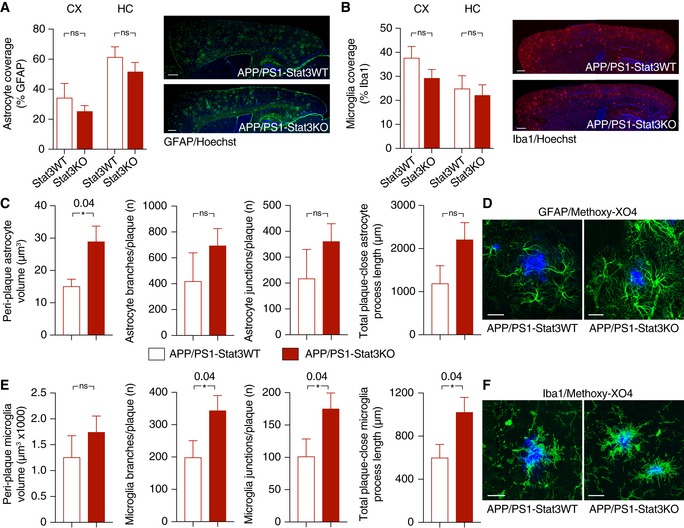
Figure 2 Astrocyte‐specific Stat3 deletion induces greater astrocytic and microglial complexity A, BOverall astrocytic and microglial coverage, as assessed by GFAP and Iba1 stainings, remained unchanged in APP/PS1‐Stat3WT versus APP/PS1‐Stat3KO mice (n = 8 mice (four females and four males) per group; age, 8 months; Mann–Whitney test for each comparison). Scale bars, 500 μm.C, DThe volume of peri‐plaque reactive astrocytes was increased by the Stat3 deletion (*P < 0.05, Mann–Whitney test), and there was a nonsignificant trend toward more astrocytic branches and junctions and longer total process length (Mann–Whitney test; APP/PS1‐Stat3WT, n = 5 (two females and three males) mice; APP/PS1‐Stat3KO, n = 7 (three females and four males) mice; age, 8–10 months). Scale bar, 20 μm.E, FMicroglial volume was not affected by the Stat3 deletion (Mann–Whitney test), but peri‐plaque microglia had significantly more microglial branches and junctions per plaque, and the total process length of peri‐plaque microglia was increased (*P < 0.05, Mann–Whitney test; same mice as in C and D). Scale bar, 20 μm.Data information: Data are represented as mean ± SEM.
Figure 2 Astrocyte‐specific Stat3 deletion induces greater astrocytic and microglial complexity A, BOverall astrocytic and microglial coverage, as assessed by GFAP and Iba1 stainings, remained unchanged in APP/PS1‐Stat3WT versus APP/PS1‐Stat3KO mice (n = 8 mice (four females and four males) per group; age, 8 months; Mann–Whitney test for each comparison). Scale bars, 500 μm.C, DThe volume of peri‐plaque reactive astrocytes was increased by the Stat3 deletion (*P < 0.05, Mann–Whitney test), and there was a nonsignificant trend toward more astrocytic branches and junctions and longer total process length (Mann–Whitney test; APP/PS1‐Stat3WT, n = 5 (two females and three males) mice; APP/PS1‐Stat3KO, n = 7 (three females and four males) mice; age, 8–10 months). Scale bar, 20 μm.E, FMicroglial volume was not affected by the Stat3 deletion (Mann–Whitney test), but peri‐plaque microglia had significantly more microglial branches and junctions per plaque, and the total process length of peri‐plaque microglia was increased (*P < 0.05, Mann–Whitney test; same mice as in C and D). Scale bar, 20 μm.Data information: Data are represented as mean ± SEM.CC BY · PubMed Central
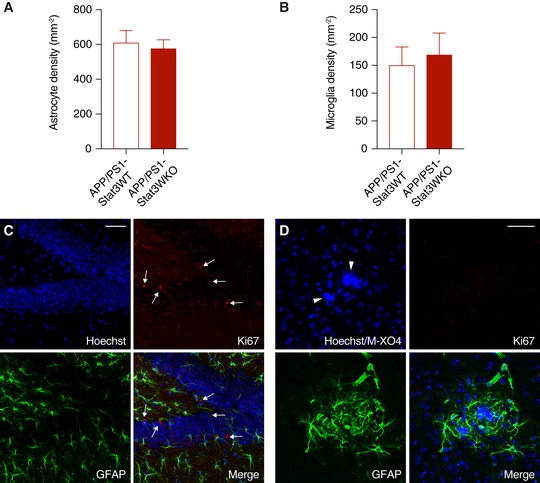
Figure EV1 No evidence for proliferation of near‐plaque reactive glia A, BThe total density of astrocytes and microglia remained unchanged in APP/PS1‐Stat3KO compared to APP/PS1‐Stat3WT mice (Mann–Whitney test for both comparisons; APP/PS1‐Stat3WT, n = 8 (three females and five males) mice; APP/PS1‐Stat3KO, n = 8 (five females and three males) mice; age, 8–9 months).C, DUsing an anti‐Ki67 antibody as a marker for cellular proliferation, we detected Ki67‐positive cells (arrows) in the hippocampal dentate gyrus as a positive control. However, no Ki67 signal was detected around plaques (marked by arrowheads) of either APP/PS1‐Stat3KO or APP/PS1‐Stat3WT mice, indicating little‐to‐no glial proliferation (scale bars, 50 μm; same mice as in A and B).Data information: Data are represented as mean ± SEM.
Figure EV1 No evidence for proliferation of near‐plaque reactive glia A, BThe total density of astrocytes and microglia remained unchanged in APP/PS1‐Stat3KO compared to APP/PS1‐Stat3WT mice (Mann–Whitney test for both comparisons; APP/PS1‐Stat3WT, n = 8 (three females and five males) mice; APP/PS1‐Stat3KO, n = 8 (five females and three males) mice; age, 8–9 months).C, DUsing an anti‐Ki67 antibody as a marker for cellular proliferation, we detected Ki67‐positive cells (arrows) in the hippocampal dentate gyrus as a positive control. However, no Ki67 signal was detected around plaques (marked by arrowheads) of either APP/PS1‐Stat3KO or APP/PS1‐Stat3WT mice, indicating little‐to‐no glial proliferation (scale bars, 50 μm; same mice as in A and B).Data information: Data are represented as mean ± SEM.CC BY · PubMed Central
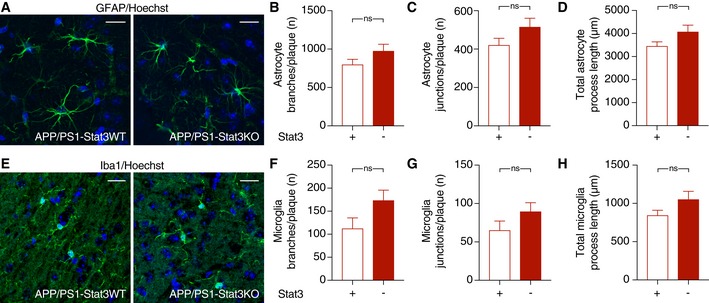
Figure EV2 No significant morphological changes in glial cells remote from plaques A–DThe morphology of hippocampal astrocytes remote from plaques was largely unaltered in APP/PS1‐Stat3KO compared to APP/PS1‐Stat3WT mice.E–HSimilarly, the morphology of hippocampal microglia remote from plaques was also similar in APP/PS1‐Stat3KO compared to APP/PS1‐Stat3WT mice.Data information: Data are represented as mean ± SEM. Mann–Whitney test for all comparisons; scale bars, 20 μm; APP/PS1‐Stat3KO, n = 10 (four females and six males) mice; APP/PS1‐Stat3WT, n = 6 (three females and three males) mice; age, 8–9 months.
Figure EV2 No significant morphological changes in glial cells remote from plaques A–DThe morphology of hippocampal astrocytes remote from plaques was largely unaltered in APP/PS1‐Stat3KO compared to APP/PS1‐Stat3WT mice.E–HSimilarly, the morphology of hippocampal microglia remote from plaques was also similar in APP/PS1‐Stat3KO compared to APP/PS1‐Stat3WT mice.Data information: Data are represented as mean ± SEM. Mann–Whitney test for all comparisons; scale bars, 20 μm; APP/PS1‐Stat3KO, n = 10 (four females and six males) mice; APP/PS1‐Stat3WT, n = 6 (three females and three males) mice; age, 8–9 months.CC BY · PubMed Central
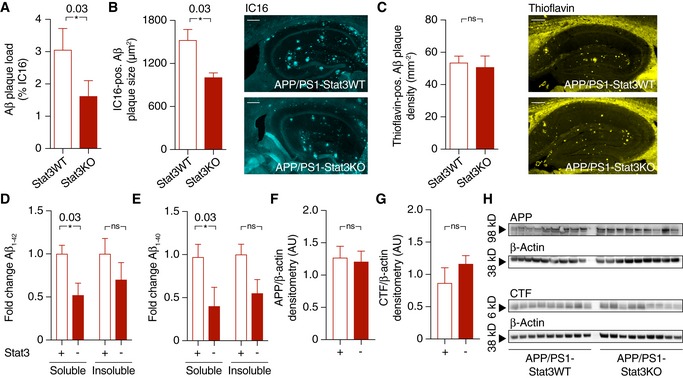
Figure 3 Astrocyte‐specific Stat3 deletion reduces Aβ plaque burden and Aβ levels without altering APP metabolism A, BAβ plaque burden, as assessed by plaque load and size using an anti‐Aβ antibody, was strongly reduced in APP/PS1‐Stat3KO versus APP/PS1‐Stat3WT mice (*P < 0.05, Mann–Whitney test; scale bar, 300 μm).CPlaque density, assessed by staining brain sections with thioflavin (yellow), remained unchanged in APP/PS1‐Stat3KO versus APP/PS1‐Stat3WT mice (Mann–Whitney test; scale bar, 250 μm).D, EElectrochemiluminescence ELISA after sequential extraction from whole‐brain homogenates using RIPA and SDS buffer revealed that soluble Aβ1–42 and Aβ1–40 were significantly reduced (*P < 0.05, Mann–Whitney test), whereas there was a nonsignificant trend toward reduced levels of insoluble Aβ1‐42 and Aβ1‐40 (Mann–Whitney test).F–HWestern blot quantification of full‐length amyloid precursor protein (APP) and its C‐terminal fragments (CTF) showed no differences between both groups (Mann–Whitney test).Data information: Data are represented as mean ± SEM. For all datasets, n = 9 male mice for both groups (age, 11 months).Source data are available online for this figure.
Figure 3 Astrocyte‐specific Stat3 deletion reduces Aβ plaque burden and Aβ levels without altering APP metabolism A, BAβ plaque burden, as assessed by plaque load and size using an anti‐Aβ antibody, was strongly reduced in APP/PS1‐Stat3KO versus APP/PS1‐Stat3WT mice (*P < 0.05, Mann–Whitney test; scale bar, 300 μm).CPlaque density, assessed by staining brain sections with thioflavin (yellow), remained unchanged in APP/PS1‐Stat3KO versus APP/PS1‐Stat3WT mice (Mann–Whitney test; scale bar, 250 μm).D, EElectrochemiluminescence ELISA after sequential extraction from whole‐brain homogenates using RIPA and SDS buffer revealed that soluble Aβ1–42 and Aβ1–40 were significantly reduced (*P < 0.05, Mann–Whitney test), whereas there was a nonsignificant trend toward reduced levels of insoluble Aβ1‐42 and Aβ1‐40 (Mann–Whitney test).F–HWestern blot quantification of full‐length amyloid precursor protein (APP) and its C‐terminal fragments (CTF) showed no differences between both groups (Mann–Whitney test).Data information: Data are represented as mean ± SEM. For all datasets, n = 9 male mice for both groups (age, 11 months).Source data are available online for this figure.CC BY · PubMed Central
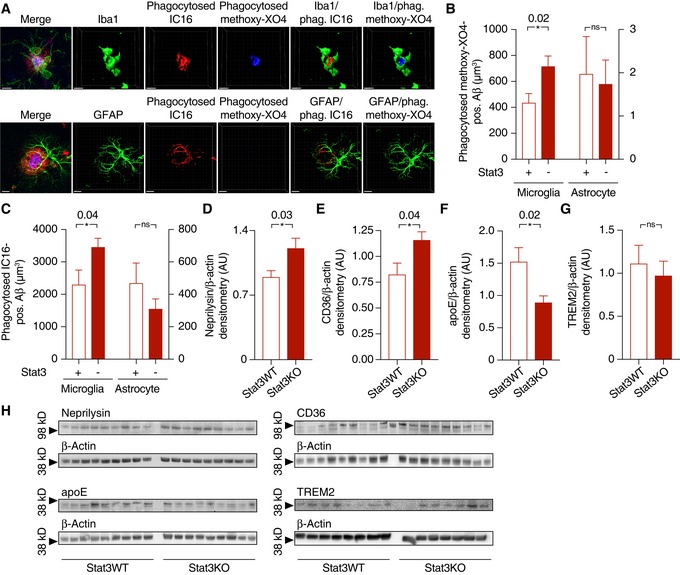
Figure 4 Astrocyte‐specific Stat3 deletion increases microglial Aβ internalization and degradation, and reduces apoE expression, dystrophic neurites, and detrimental cytokines AInternalization of Aβ (stained with IC16 antibody or methoxy‐XO4) was assessed using an engulfment assay, in which glial and Aβ structures were surface‐rendered and Aβ volumes co‐localized with glial volumes were quantified. Scale bars, 10 μm.B, CMicroglia (left Y axes) from APP/PS1 mice internalized significantly more Aβ positive for IC16 or methoxy‐XO4 when Stat3 was deleted in astrocytes (*P < 0.05, Mann–Whitney test), whereas no changes were seen in astrocytes (right axes; APP/PS1‐Stat3WT, n = 8 (four females and four males) mice; APP/PS1‐Stat3KO, n = 11 (five females and six males) mice; age, 11 months; Mann–Whitney test).D–H(D–F) Western blot quantification of protein levels of the Aβ‐degrading enzymes neprilysin/CD10 and CD36, as well as the Aβ‐binding apolipoprotein E (apoE), revealed a significantly increased expression of neprilysin and CD36 and a decreased expression of apoE (APP/PS1‐Stat3WT, n = 9 (five females and four males) mice; APP/PS1‐Stat3KO, n = 9 (five females and four males) mice; age, 11 months; *P < 0.05, Mann–Whitney test for all comparisons). (G) In contrast, TREM2 expression remained unchanged (APP/PS1‐Stat3WT, n = 8 (four females and four males) mice; APP/PS1‐Stat3KO, n = 7 (four females and three males) mice; age, 11 months; Mann–Whitney test). (H) Western blots for proteins analyzed in (D‐G).Data information: Data are represented as mean ± SEM.Source data are available online for this figure.
Figure 4 Astrocyte‐specific Stat3 deletion increases microglial Aβ internalization and degradation, and reduces apoE expression, dystrophic neurites, and detrimental cytokines AInternalization of Aβ (stained with IC16 antibody or methoxy‐XO4) was assessed using an engulfment assay, in which glial and Aβ structures were surface‐rendered and Aβ volumes co‐localized with glial volumes were quantified. Scale bars, 10 μm.B, CMicroglia (left Y axes) from APP/PS1 mice internalized significantly more Aβ positive for IC16 or methoxy‐XO4 when Stat3 was deleted in astrocytes (*P < 0.05, Mann–Whitney test), whereas no changes were seen in astrocytes (right axes; APP/PS1‐Stat3WT, n = 8 (four females and four males) mice; APP/PS1‐Stat3KO, n = 11 (five females and six males) mice; age, 11 months; Mann–Whitney test).D–H(D–F) Western blot quantification of protein levels of the Aβ‐degrading enzymes neprilysin/CD10 and CD36, as well as the Aβ‐binding apolipoprotein E (apoE), revealed a significantly increased expression of neprilysin and CD36 and a decreased expression of apoE (APP/PS1‐Stat3WT, n = 9 (five females and four males) mice; APP/PS1‐Stat3KO, n = 9 (five females and four males) mice; age, 11 months; *P < 0.05, Mann–Whitney test for all comparisons). (G) In contrast, TREM2 expression remained unchanged (APP/PS1‐Stat3WT, n = 8 (four females and four males) mice; APP/PS1‐Stat3KO, n = 7 (four females and three males) mice; age, 11 months; Mann–Whitney test). (H) Western blots for proteins analyzed in (D‐G).Data information: Data are represented as mean ± SEM.Source data are available online for this figure.CC BY · PubMed Central
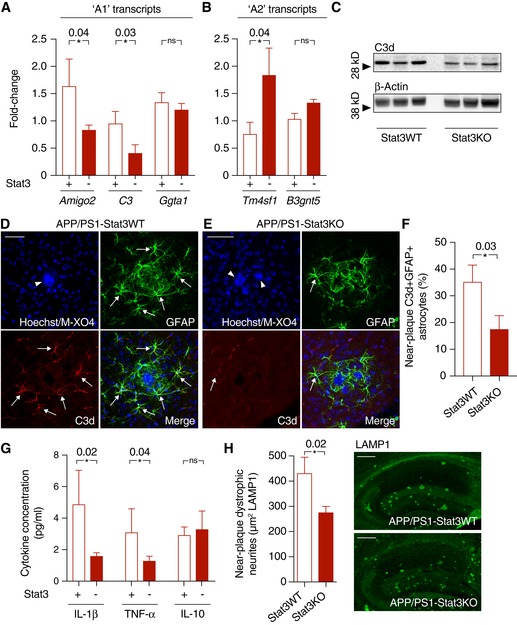
Figure 5 Stat3 deletion triggers a phenotypical switch in reactive astrocytes A, BQuantitative PCR from cortex of APP/PS1‐Stat3KO compared to APP/PS1‐Stat3WT mice revealed lower expression of “A1” markers Amigo2 and C3, whereas Ggta1 remained unchanged. In turn, the “A2” marker Tm4sf1 was upregulated and there was a nonsignificant trend for a higher expression of B3gnt5 (n = 6 mice (three females and three males) per group; age, 8 months; *P < 0.05, Mann–Whitney test).C–FConfirming lower expression of the “A1” marker C3d, Western blot analysis indicated lower protein levels of C3d in APP/PS1‐Stat3KO. Immunohistochemistry using an antibody against C3d revealed that lower expression of C3d particularly occurred in peri‐plaque reactive astrocytes (arrows indicate C3d and GFAP colocalization; arrowheads indicate plaques visualized with methoxy‐XO4; scale bars, 50 μm; APP/PS1‐Stat3WT, n = 6 (two females and four males) mice; APP/PS1‐Stat3KO, n = 6 (three females and three males) mice; age, 8 months; *P < 0.05, Mann–Whitney test).GWhole‐brain levels of the pro‐inflammatory cytokines IL‐1β and TNF‐α were significantly reduced in APP/PS1‐Stat3KO mice (Mann–Whitney test), whereas no changes were seen for IL‐10 (APP/PS1‐Stat3WT, n = 13 (six females and seven males) mice; APP/PS1‐Stat3KO, n = 13 (eight females and five males) mice; age, 11 months; *P < 0.05, Mann–Whitney test).HThese changes were paralleled by a decrease in the area covered by dystrophic neurites in APP/PS1‐Stat3KO compared to APP/PS1‐Stat3WT mice, as assessed by LAMP1 staining (*P < 0.05, Mann–Whitney test; n = 10 male mice for both groups; age, 8 months; scale bars, 300 μm).Data information: Data are represented as mean ± SEM.
Figure 5 Stat3 deletion triggers a phenotypical switch in reactive astrocytes A, BQuantitative PCR from cortex of APP/PS1‐Stat3KO compared to APP/PS1‐Stat3WT mice revealed lower expression of “A1” markers Amigo2 and C3, whereas Ggta1 remained unchanged. In turn, the “A2” marker Tm4sf1 was upregulated and there was a nonsignificant trend for a higher expression of B3gnt5 (n = 6 mice (three females and three males) per group; age, 8 months; *P < 0.05, Mann–Whitney test).C–FConfirming lower expression of the “A1” marker C3d, Western blot analysis indicated lower protein levels of C3d in APP/PS1‐Stat3KO. Immunohistochemistry using an antibody against C3d revealed that lower expression of C3d particularly occurred in peri‐plaque reactive astrocytes (arrows indicate C3d and GFAP colocalization; arrowheads indicate plaques visualized with methoxy‐XO4; scale bars, 50 μm; APP/PS1‐Stat3WT, n = 6 (two females and four males) mice; APP/PS1‐Stat3KO, n = 6 (three females and three males) mice; age, 8 months; *P < 0.05, Mann–Whitney test).GWhole‐brain levels of the pro‐inflammatory cytokines IL‐1β and TNF‐α were significantly reduced in APP/PS1‐Stat3KO mice (Mann–Whitney test), whereas no changes were seen for IL‐10 (APP/PS1‐Stat3WT, n = 13 (six females and seven males) mice; APP/PS1‐Stat3KO, n = 13 (eight females and five males) mice; age, 11 months; *P < 0.05, Mann–Whitney test).HThese changes were paralleled by a decrease in the area covered by dystrophic neurites in APP/PS1‐Stat3KO compared to APP/PS1‐Stat3WT mice, as assessed by LAMP1 staining (*P < 0.05, Mann–Whitney test; n = 10 male mice for both groups; age, 8 months; scale bars, 300 μm).Data information: Data are represented as mean ± SEM.CC BY · PubMed Central
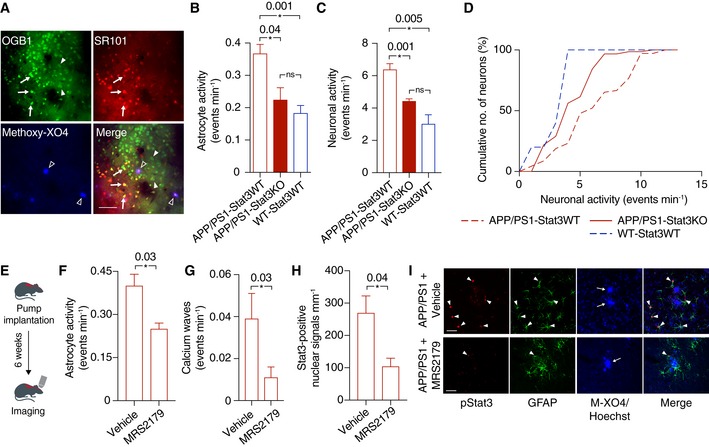
Figure 6 Astroglial Stat3 modulates network imbalance in APP/PS1 mice AFor in vivo two‐photon imaging, astrocytes (arrows) and neurons (arrowheads) were labeled with the calcium indicator OGB‐1, and astrocytes were co‐labeled with sulforhodamine 101 (SR101; arrows). Aβ plaques were labeled with the intravital dye methoxy‐XO4 (open arrowheads). Scale bar, 50 μm.BCalcium imaging of anesthetized animals showed that the hyperactivity of astrocytes in APP/PS1‐Stat3KO mice was reduced to levels comparable to WT‐Stat3WT mice, but significantly increased in APP/PS1‐Stat3WT mice (*P < 0.05, one‐way ANOVA followed by Bonferroni's multiple comparison test; n = 6 mice (three females and three males) for each group; age, 8 months).C, DSimilarly, neuronal activity was also reduced to levels comparable to WT‐Stat3WT mice in APP/PS1‐Stat3KO mice, but significantly increased in APP/PS1‐Stat3WT mice (*P < 0.05, one‐way ANOVA followed by Bonferroni's multiple comparison test; same mice as in B). The cumulative distributions of neuronal calcium transients in APP/PS1‐Stat3KO mice were not different from those of WT‐Stat3WT mice (P = 0.31, Kolmogorov–Smirnov test), but significantly different from those of APP/PS1‐Stat3WT mice (P = 0.001, Kolmogorov–Smirnov test).ETo investigate a reciprocal scenario in which astroglial hyperactivity reduces Stat3 activation, we implanted osmotic minipumps into APP/PS1 mice and treated them with the network‐normalizing P2Y1R inhibitor MRS2179 or vehicle for 6 weeks.F–ITwo‐photon imaging of these mice confirmed that astrocytic hyperactivity and propagating calcium waves in APP/PS1 mice were reduced by MRS2179 (n = 6 (four females and two males) mice) compared to vehicle‐treated APP/PS1 mice (n = 6 (two females and four males) mice; age, 8 months; *P < 0.05, Mann–Whitney test). This network normalization induced a reduction in activated Stat3 (pStat3) in astrocytes assessed in fixed brain sections of the same mice (*P < 0.05, Mann–Whitney test). Scale bars, 50 μm. Arrowheads indicate pStat3 and GFAP colocalization, arrows indicate plaques visualized with methoxy‐XO4 (M‐XO4).Data information: Data are represented as mean ± SEM.
Figure 6 Astroglial Stat3 modulates network imbalance in APP/PS1 mice AFor in vivo two‐photon imaging, astrocytes (arrows) and neurons (arrowheads) were labeled with the calcium indicator OGB‐1, and astrocytes were co‐labeled with sulforhodamine 101 (SR101; arrows). Aβ plaques were labeled with the intravital dye methoxy‐XO4 (open arrowheads). Scale bar, 50 μm.BCalcium imaging of anesthetized animals showed that the hyperactivity of astrocytes in APP/PS1‐Stat3KO mice was reduced to levels comparable to WT‐Stat3WT mice, but significantly increased in APP/PS1‐Stat3WT mice (*P < 0.05, one‐way ANOVA followed by Bonferroni's multiple comparison test; n = 6 mice (three females and three males) for each group; age, 8 months).C, DSimilarly, neuronal activity was also reduced to levels comparable to WT‐Stat3WT mice in APP/PS1‐Stat3KO mice, but significantly increased in APP/PS1‐Stat3WT mice (*P < 0.05, one‐way ANOVA followed by Bonferroni's multiple comparison test; same mice as in B). The cumulative distributions of neuronal calcium transients in APP/PS1‐Stat3KO mice were not different from those of WT‐Stat3WT mice (P = 0.31, Kolmogorov–Smirnov test), but significantly different from those of APP/PS1‐Stat3WT mice (P = 0.001, Kolmogorov–Smirnov test).ETo investigate a reciprocal scenario in which astroglial hyperactivity reduces Stat3 activation, we implanted osmotic minipumps into APP/PS1 mice and treated them with the network‐normalizing P2Y1R inhibitor MRS2179 or vehicle for 6 weeks.F–ITwo‐photon imaging of these mice confirmed that astrocytic hyperactivity and propagating calcium waves in APP/PS1 mice were reduced by MRS2179 (n = 6 (four females and two males) mice) compared to vehicle‐treated APP/PS1 mice (n = 6 (two females and four males) mice; age, 8 months; *P < 0.05, Mann–Whitney test). This network normalization induced a reduction in activated Stat3 (pStat3) in astrocytes assessed in fixed brain sections of the same mice (*P < 0.05, Mann–Whitney test). Scale bars, 50 μm. Arrowheads indicate pStat3 and GFAP colocalization, arrows indicate plaques visualized with methoxy‐XO4 (M‐XO4).Data information: Data are represented as mean ± SEM.CC BY · PubMed Central
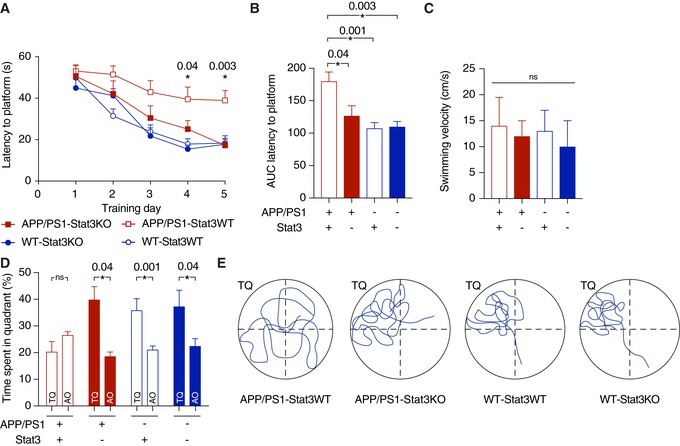
Figure 7 Stat3 deletion in astrocytes protects from spatial memory and learning deterioration ASpatial learning and memory were assessed in the Morris Water Maze paradigm. APP/PS1‐Stat3KO mice showed faster latencies to reach the hidden platform compared with APP/PS1‐Stat3WT on days 4 and 5, but were similar to WT‐Stat3WT and WT‐Stat3KO mice (*P < 0.05, two‐way repeated‐measures ANOVA followed by Bonferroni post hoc test; P‐values are for APP/PS1‐Stat3KO versus APP/PS1‐Stat3WT mice).BThe area under the curve (AUC) for the latency to reach the hidden platform was similar in APP/PS1‐Stat3WT compared to WT‐Stat3WT and WT‐Stat3KO mice, but significantly higher in APP/PS1‐Stat3KO mice (*P < 0.05, Kruskal–Wallis test followed by Dunn's multiple comparisons test).CThe swimming velocity was similar in all groups (Kruskal–Wallis test followed by Dunn's multiple comparisons test).D, EIn the probe trial 24 h after the last training day, the time mice spent in the target quadrant (TQ) was different from chance in all groups except for APP/PS1‐Stat3WT mice (P < 0.05, one‐tailed one‐sample t‐test). APP/PS1‐Stat3KO, WT‐Stat3WT, and WT‐Stat3KO mice spent significantly more time in the target quadrant compared to the mean of all other quadrants (AO), whereas APP/PS1‐Stat3WT spent equal times in the target and all other quadrants (*P < 0.05, Wilcoxon matched‐pairs signed rank test for each comparison).Data information: Data are represented as mean ± SEM. WT‐Stat3WT, n = 15 (7 females and 8 males) mice; WT‐Stat3KO, n = 15 (10 females and 5 males) mice; APP/PS1‐Stat3WT, n = 15 (eight females and seven males) mice; APP/PS1‐Stat3KO, n = 15 (nine females and six males) mice; age, 8–9 months).
Figure 7 Stat3 deletion in astrocytes protects from spatial memory and learning deterioration ASpatial learning and memory were assessed in the Morris Water Maze paradigm. APP/PS1‐Stat3KO mice showed faster latencies to reach the hidden platform compared with APP/PS1‐Stat3WT on days 4 and 5, but were similar to WT‐Stat3WT and WT‐Stat3KO mice (*P < 0.05, two‐way repeated‐measures ANOVA followed by Bonferroni post hoc test; P‐values are for APP/PS1‐Stat3KO versus APP/PS1‐Stat3WT mice).BThe area under the curve (AUC) for the latency to reach the hidden platform was similar in APP/PS1‐Stat3WT compared to WT‐Stat3WT and WT‐Stat3KO mice, but significantly higher in APP/PS1‐Stat3KO mice (*P < 0.05, Kruskal–Wallis test followed by Dunn's multiple comparisons test).CThe swimming velocity was similar in all groups (Kruskal–Wallis test followed by Dunn's multiple comparisons test).D, EIn the probe trial 24 h after the last training day, the time mice spent in the target quadrant (TQ) was different from chance in all groups except for APP/PS1‐Stat3WT mice (P < 0.05, one‐tailed one‐sample t‐test). APP/PS1‐Stat3KO, WT‐Stat3WT, and WT‐Stat3KO mice spent significantly more time in the target quadrant compared to the mean of all other quadrants (AO), whereas APP/PS1‐Stat3WT spent equal times in the target and all other quadrants (*P < 0.05, Wilcoxon matched‐pairs signed rank test for each comparison).Data information: Data are represented as mean ± SEM. WT‐Stat3WT, n = 15 (7 females and 8 males) mice; WT‐Stat3KO, n = 15 (10 females and 5 males) mice; APP/PS1‐Stat3WT, n = 15 (eight females and seven males) mice; APP/PS1‐Stat3KO, n = 15 (nine females and six males) mice; age, 8–9 months).CC BY · PubMed Central
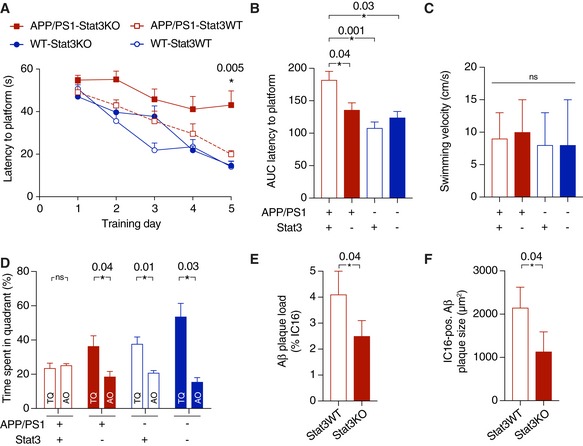
Figure EV3 Persistence of cognitive protection and reduced amyloid pathology in late‐stage APP/PS1‐Stat3KO mice ASpatial learning and memory were assessed in the Morris Water Maze. APP/PS1‐Stat3KO mice showed faster latencies to reach the hidden platform compared with APP/PS1‐Stat3WT on day 5, but were similar to WT‐Stat3WT and WT‐Stat3KO mice (*P < 0.05, two‐way repeated‐measures ANOVA followed by Bonferroni post hoc test; P‐value for APP/PS1‐Stat3KO versus APP/PS1‐Stat3WT mice).B, CThe area under the curve (AUC) for the latency to reach the hidden platform was similar in APP/PS1‐Stat3WT compared to WT‐Stat3WT and WT‐Stat3KO mice, but significantly higher in APP/PS1‐Stat3KO mice (*P < 0.05, Kruskal–Wallis test followed by Dunn's multiple comparisons test). The swimming velocity was similar in all groups (Kruskal–Wallis test followed by Dunn's multiple comparisons test).DIn the probe trial, APP/PS1‐Stat3KO, WT‐Stat3WT, and WT‐Stat3KO mice spent significantly more time in the target quadrant (TQ) compared to the mean of all other quadrants (AO), whereas APP/PS1‐Stat3WT spent equal times in the target and all other quadrants (*P < 0.05, Wilcoxon matched‐pairs signed rank test for each comparison).E, FPlaque load and plaque size were reduced in APP/PS1‐Stat3KO compared to APP/PS1‐Stat3WT mice (*P < 0.05, Mann–Whitney test for both comparisons; same mice as in A–D).Data information: Data are represented as mean ± SEM. WT‐Stat3WT, n = 12 (6 females and 6 males) mice; WT‐Stat3KO, n = 10 (4 females and 6 males) mice; APP/PS1‐Stat3WT, n = 12 (seven females and five males) mice; APP/PS1‐Stat3KO, n = 12 (eight females and four males) mice; age, 13–14 months.
Figure EV3 Persistence of cognitive protection and reduced amyloid pathology in late‐stage APP/PS1‐Stat3KO mice ASpatial learning and memory were assessed in the Morris Water Maze. APP/PS1‐Stat3KO mice showed faster latencies to reach the hidden platform compared with APP/PS1‐Stat3WT on day 5, but were similar to WT‐Stat3WT and WT‐Stat3KO mice (*P < 0.05, two‐way repeated‐measures ANOVA followed by Bonferroni post hoc test; P‐value for APP/PS1‐Stat3KO versus APP/PS1‐Stat3WT mice).B, CThe area under the curve (AUC) for the latency to reach the hidden platform was similar in APP/PS1‐Stat3WT compared to WT‐Stat3WT and WT‐Stat3KO mice, but significantly higher in APP/PS1‐Stat3KO mice (*P < 0.05, Kruskal–Wallis test followed by Dunn's multiple comparisons test). The swimming velocity was similar in all groups (Kruskal–Wallis test followed by Dunn's multiple comparisons test).DIn the probe trial, APP/PS1‐Stat3KO, WT‐Stat3WT, and WT‐Stat3KO mice spent significantly more time in the target quadrant (TQ) compared to the mean of all other quadrants (AO), whereas APP/PS1‐Stat3WT spent equal times in the target and all other quadrants (*P < 0.05, Wilcoxon matched‐pairs signed rank test for each comparison).E, FPlaque load and plaque size were reduced in APP/PS1‐Stat3KO compared to APP/PS1‐Stat3WT mice (*P < 0.05, Mann–Whitney test for both comparisons; same mice as in A–D).Data information: Data are represented as mean ± SEM. WT‐Stat3WT, n = 12 (6 females and 6 males) mice; WT‐Stat3KO, n = 10 (4 females and 6 males) mice; APP/PS1‐Stat3WT, n = 12 (seven females and five males) mice; APP/PS1‐Stat3KO, n = 12 (eight females and four males) mice; age, 13–14 months.CC BY · PubMed Central
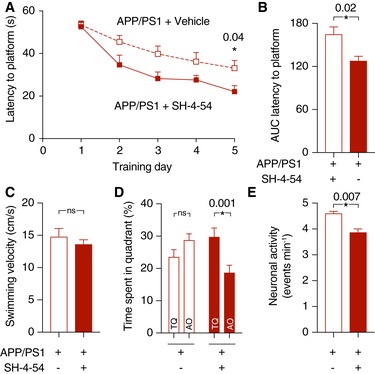
Figure 8 The systemic Stat3 inhibitor SH‐4‐54 confers protection from cognitive decline in APP/PS1 mice AAPP/PS1 mice were systemically treated with SH‐4‐54 for 6 weeks and compared to age‐matched APP/PS1 mice treated with vehicle. In the Morris Water Maze test, treatment with SH‐4‐54 led to significantly faster latencies to reach the hidden platform on the last training day (*P < 0.05, two‐way repeated‐measures ANOVA followed by Bonferroni post hoc test).BThe area under the curve (AUC) for the latency to reach the hidden platform was also smaller in APP/PS1 mice treated with the Stat3 inhibitor (*P < 0.05, Mann–Whitney test).CThe swimming velocity was not affected by the treatment (Mann–Whitney test).DIn the probe trial test, APP/PS1 mice treated with the Stat3 inhibitor spent significantly more time in the target quadrant (TQ) compared to the mean of all other quadrants (AO), whereas APP/PS1 mice treated with vehicle spent equal times in the target and all other quadrants (*P < 0.05, Wilcoxon matched‐pairs signed rank test for all comparisons).ETo verify target engagement in the brain, the same mice assessed in the Morris Water Maze were anesthetized and imaged using in vivo two‐photon microscopy of calcium activity. Systemic treatment with the Stat3 inhibitor reduced the hyperactive phenotype of cortical neurons (*P < 0.05, Mann–Whitney test).Data information: Data are represented as mean ± SEM. APP/PS1‐Stat3WT, n = 12 (five females and seven males) mice; APP/PS1‐Stat3KO, n = 12 (four females and eight males) mice; age, 8 months).
Figure 8 The systemic Stat3 inhibitor SH‐4‐54 confers protection from cognitive decline in APP/PS1 mice AAPP/PS1 mice were systemically treated with SH‐4‐54 for 6 weeks and compared to age‐matched APP/PS1 mice treated with vehicle. In the Morris Water Maze test, treatment with SH‐4‐54 led to significantly faster latencies to reach the hidden platform on the last training day (*P < 0.05, two‐way repeated‐measures ANOVA followed by Bonferroni post hoc test).BThe area under the curve (AUC) for the latency to reach the hidden platform was also smaller in APP/PS1 mice treated with the Stat3 inhibitor (*P < 0.05, Mann–Whitney test).CThe swimming velocity was not affected by the treatment (Mann–Whitney test).DIn the probe trial test, APP/PS1 mice treated with the Stat3 inhibitor spent significantly more time in the target quadrant (TQ) compared to the mean of all other quadrants (AO), whereas APP/PS1 mice treated with vehicle spent equal times in the target and all other quadrants (*P < 0.05, Wilcoxon matched‐pairs signed rank test for all comparisons).ETo verify target engagement in the brain, the same mice assessed in the Morris Water Maze were anesthetized and imaged using in vivo two‐photon microscopy of calcium activity. Systemic treatment with the Stat3 inhibitor reduced the hyperactive phenotype of cortical neurons (*P < 0.05, Mann–Whitney test).Data information: Data are represented as mean ± SEM. APP/PS1‐Stat3WT, n = 12 (five females and seven males) mice; APP/PS1‐Stat3KO, n = 12 (four females and eight males) mice; age, 8 months).CC BY · PubMed Central
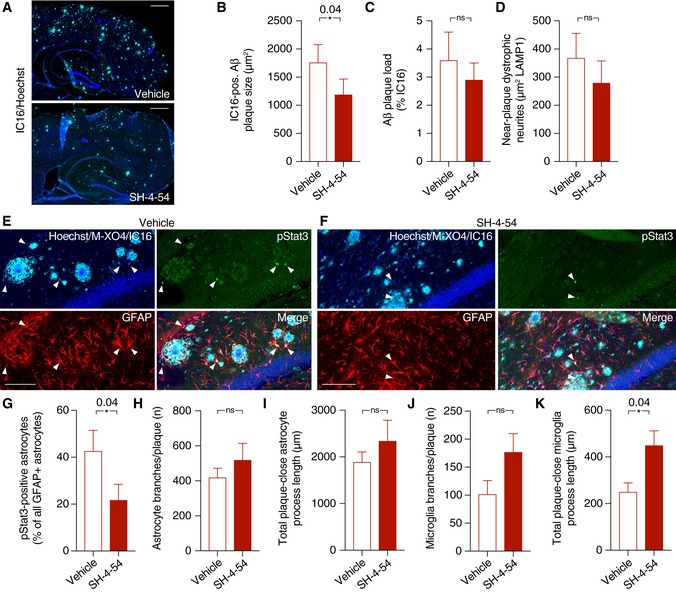
Figure 9 Target engagement of the systemic Stat3 inhibitor in APP/PS1 mice A–DSH‐4‐54 significantly decreased plaque growth, as assessed by IC16 immunohistochemistry, while plaque load remained unchanged. There was also no significant change in dystrophic neurite area during the treatment time (Mann–Whitney test for all comparisons; scale bars, 500 μm).E–GThe fraction of pStat3‐positive astrocytes in the peri‐plaque region was strongly reduced by the treatment with the Stat3 inhibitor (arrowheads indicate pStat3 signals; scale bars, 100 μm; Mann–Whitney test).H–KWhile no changes were seen in morphological parameters of peri‐plaque astrocytes, there was a significant increase in the process length of near‐plaque microglia, indicating higher microglial complexity (Mann–Whitney test for all comparisons).Data information: Data are represented as mean ± SEM. APP/PS1 mice treated with SH‐4‐54, n = 12 (six females and six males) mice; APP/PS1 mice treated with vehicle, n = 12 (7 females and 5 males) mice; age, 8 months.
Figure 9 Target engagement of the systemic Stat3 inhibitor in APP/PS1 mice A–DSH‐4‐54 significantly decreased plaque growth, as assessed by IC16 immunohistochemistry, while plaque load remained unchanged. There was also no significant change in dystrophic neurite area during the treatment time (Mann–Whitney test for all comparisons; scale bars, 500 μm).E–GThe fraction of pStat3‐positive astrocytes in the peri‐plaque region was strongly reduced by the treatment with the Stat3 inhibitor (arrowheads indicate pStat3 signals; scale bars, 100 μm; Mann–Whitney test).H–KWhile no changes were seen in morphological parameters of peri‐plaque astrocytes, there was a significant increase in the process length of near‐plaque microglia, indicating higher microglial complexity (Mann–Whitney test for all comparisons).Data information: Data are represented as mean ± SEM. APP/PS1 mice treated with SH‐4‐54, n = 12 (six females and six males) mice; APP/PS1 mice treated with vehicle, n = 12 (7 females and 5 males) mice; age, 8 months.CC BY · PubMed Central

Verification

Claims the paper makes

The claims and statistics of this paper haven’t been checked yet.

Run the check — free, no account needed. It reads the open-access text and checks the sources it cites.

A few free checks a day · papers already verified open instantly · results are public

Claims other papers make about this one

Each is checked against this paper’s own text: does it say what the citing paper says it does?

Self-check

Percentages, sums and reported differences re-computed from the paper’s own numbers.

The self-check needs the paper’s full text.

Citations

Cites

Cited by

Sorted by citations

See all 351

Metadata

Authors
Reichenbach, N., Delekate, A., Plescher, M., Schmitt, F., Krauss, S., Blank, N., Halle, A., & Petzold, G. C.
Affiliations
  • German Center for Neurodegenerative Diseases (DE)
  • University Hospital Bonn (DE)
Corresponding author
Petzold, Gabor C
Venue
EMBO Molecular Medicine
Published
2019-01-07
Volume
11
Issue
2
ISSN
  • 1757-4676 (ISSN-L)
  • 1757-4684
OpenAlex
W2907017802
Cited by
343
References
42
Citations by year
2026: 36 · 2025: 50 · 2024: 63 · 2023: 47 · 2022: 54 · 2021: 49 · 2020: 34 · 2019: 9
FWCI
25.02
Type
journal article
Language
en
Open access
Locations
  • EMBO Molecular Medicine (publishedVersion, cc-by)
  • Europe PMC (PubMed Central) (publishedVersion, cc-by)
  • PubMed Central (publishedVersion, cc-by)
  • PubMed (publishedVersion)
  • DOAJ (DOAJ: Directory of Open Access Journals) (submittedVersion)
  • DZNE Pub (submittedVersion, other-oa)
Funders
  • European Union (EU) Joint Program, Neurodegenerative Disease Research JPND (643417/DACAPO‐AD)
  • Alzheimer Forschung Initiative
  • Deutsches Zentrum für Neurodegenerative Erkrankungen
  • Deutsche Forschungsgemeinschaft (EXC 1023)
Topics
  • Life Sciences › Neuroscience › Cellular and Molecular Neuroscience › Alzheimer's disease research and treatments
  • Life Sciences › Neuroscience › Neurology › Neuroinflammation and Neurodegeneration Mechanisms
  • Life Sciences › Neuroscience › Cellular and Molecular Neuroscience › Neuroscience and Neuropharmacology Research
Keywords
STAT3, astrocyte activation, Alzheimer's disease, APP/PS1 mice, amyloid-beta, amyloid plaques, microglia, amyloid clearance, neuroinflammation, inflammatory cytokines, dystrophic neurites, spatial learning and memory, STAT3 inhibitor, therapeutic target
MeSH terms
Alzheimer Disease, Animals, Astrocytes, Disease Models, Animal, Humans, Mice, Knockout, Cell Proliferation, STAT3 Transcription Factor, Mice, Gene Knockout Techniques

About these checks

Registry, retraction, Cites and statistics results are computed, not judged, with one exception: a printed reference that no index lists is read once by a model before it counts as a citation error. Claims are extracted by a model and kept only when their quote appears verbatim in the text; each cited source is then checked, with a model’s help, for whether it says what the claim relies on. Those verdicts can be wrong — read the claim’s quote and the cited source before relying on one.

Statistics and arithmetic are recomputed, not judged.

Confidence bands are shown only for fields calibrated on our annotated test set. None is calibrated yet, so no band is shown.

What counts as a claim ›How we measure confidence ›How we check this ›

Are you an author, or do you see a problem with this page? Request a review