

The DOI matches its Crossref record; 85 of the 85 references it cites were found in a registry or an index.
Mutation rates, spectra, and genome-wide distribution of spontaneous mutations in mismatch repair deficient yeast.
Open accessAbstract
DNA mismatch repair is a highly conserved DNA repair pathway. In humans, germline mutations in hMSH2 or hMLH1, key components of mismatch repair, have been associated with Lynch syndrome, a leading cause of inherited cancer mortality. Current estimates of the mutation rate and the mutational spectra in mismatch repair defective cells are primarily limited to a small number of individual reporter loci. Here we use the yeast Saccharomyces cerevisiae to generate a genome-wide view of the rates, spectra, and distribution of mutation in the absence of mismatch repair. We performed mutation accumulation assays and next generation sequencing on 19 strains, including 16 msh2 missense variants implicated in Lynch cancer syndrome. The mutation rate for DNA mismatch repair null strains was approximately 1 mutation per genome per generation, 225-fold greater than the wild-type rate. The mutations were distributed randomly throughout the genome, independent of replication timing. The mutation spectra included insertions/deletions at homopolymeric runs (87.7%) and at larger microsatellites (5.9%), as well as transitions (4.5%) and transversions (1.9%). Additionally, repeat regions with proximal repeats are more likely to be mutated. A bias toward deletions at homopolymers and insertions at (AT)n microsatellites suggests a different mechanism for mismatch generation at these sites. Interestingly, 5% of the single base pair substitutions might represent double-slippage events that occurred at the junction of immediately adjacent repeats, resulting in a shift in the repeat boundary. These data suggest a closer scrutiny of tumor suppressors with homopolymeric runs with proximal repeats as the potential drivers of oncogenesis in mismatch repair defective cells.
Overview
The claims and statistics of this paper haven’t been checked yet.
Run the check — free, no account needed. It reads the open-access text and checks the sources it cites.
Integrity signals
Registry
Cites
Statistics
Figures
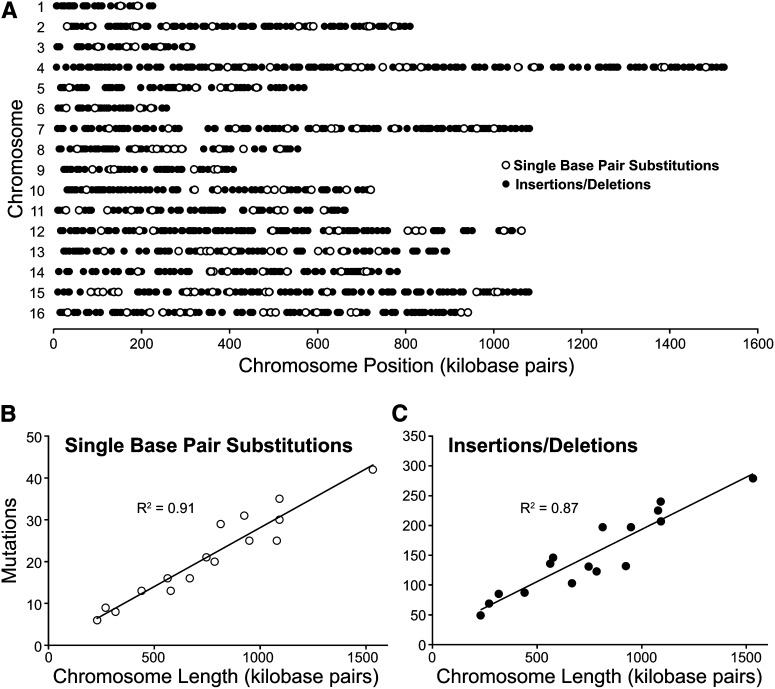
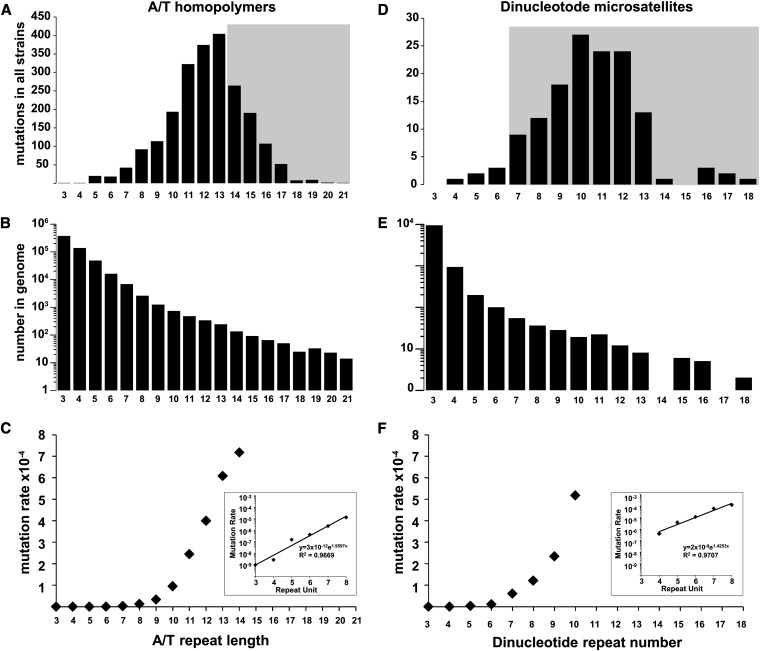
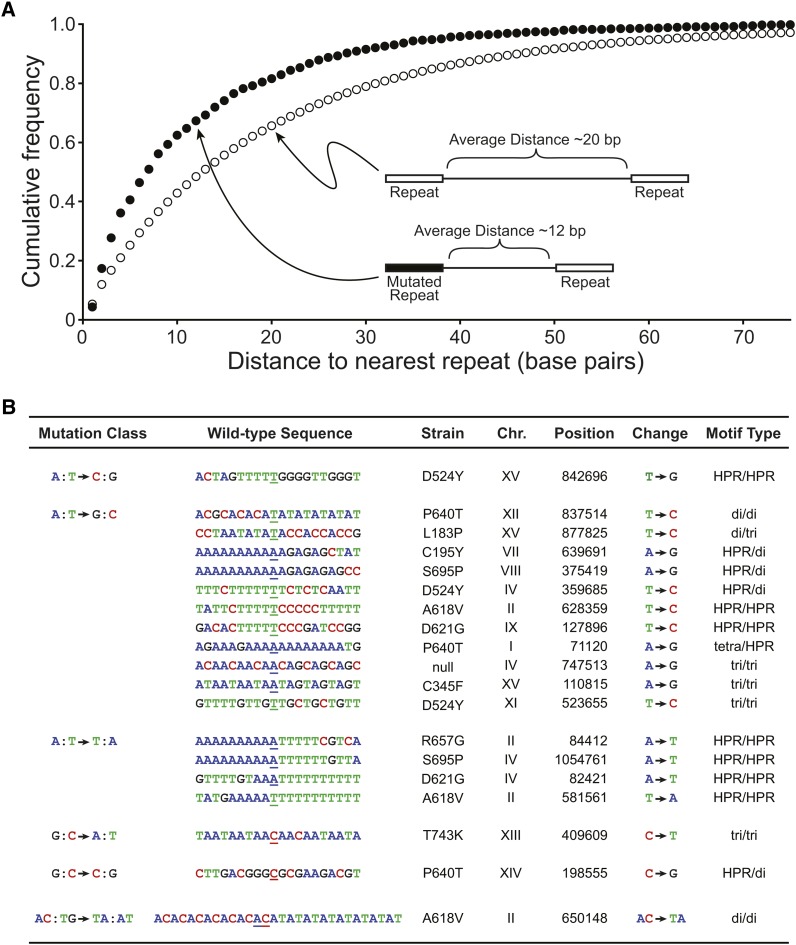
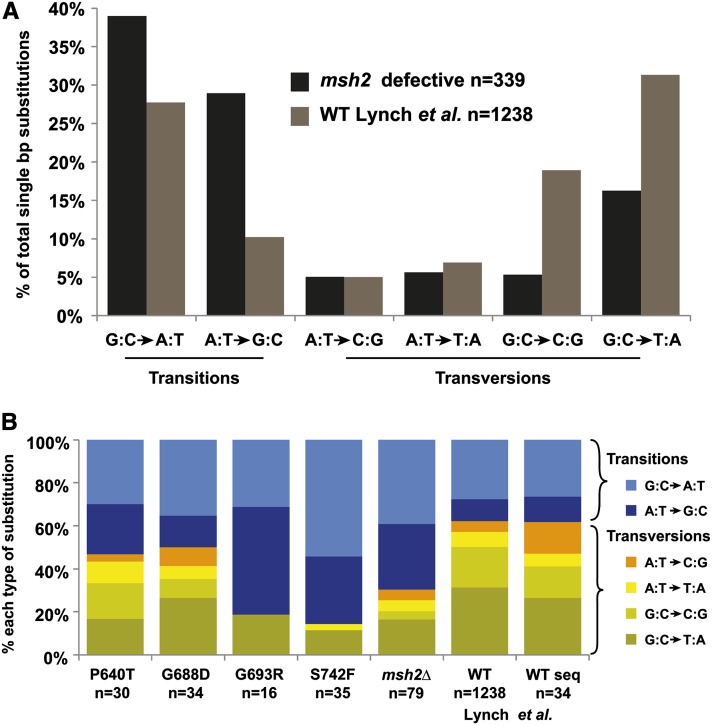
Verification
Claims the paper makes
The claims and statistics of this paper haven’t been checked yet.
Run the check — free, no account needed. It reads the open-access text and checks the sources it cites.
Claims other papers make about this one
Each is checked against this paper’s own text: does it say what the citing paper says it does?
In the citing paper
“The current literature on the effect of DNA mismatch-repair defects also highlighted that the occurrence of mutations is not random: DNA regions with a greater density of repeats are more mutable in mismatch-repair defective cells (Ma et al. 2012; Lang et al. 2013).”
From Comparative Genomics of Two Sequential Candida glabrata Clinical Isolates (2017) · cites this paper as Lang et al. 2013
In the citing paper
“Furthermore, the mutational profile of the C23 genome resembles that of a S. cerevisiae MSH2 mutant (24, 25).”
From Mismatch Repair of DNA Replication Errors Contributes to Microevolution in the Pathogenic Fungus Cryptococcus neoformans (2017) · cites this paper as [24]
In the citing paper
“The msh2Δ mutation rate is equivalent to that observed in msh2Δ mutants in S. cerevisiae (24).”
From Mismatch Repair of DNA Replication Errors Contributes to Microevolution in the Pathogenic Fungus Cryptococcus neoformans (2017) · cites this paper as [24]
In the citing paper
“A similar shift in mutational profile is also observed in S. cerevisiae msh2Δ mutants, in which an equivalent shift to transitions is observed and a large number of single nucleotide variations (−1 to +1) occur within homopolymeric tracts (24, 25).”
From Mismatch Repair of DNA Replication Errors Contributes to Microevolution in the Pathogenic Fungus Cryptococcus neoformans (2017) · cites this paper as [24]
In the citing paper
“None of the missense mutations were in highly conserved amino acids; however, the T182I substitution is located in an equivalent position that, when mutated in S. cerevisiae (L183P), resulted in a 220-fold induction of mutation rate due to a lack of structural integrity (24).”
From Mismatch Repair of DNA Replication Errors Contributes to Microevolution in the Pathogenic Fungus Cryptococcus neoformans (2017) · cites this paper as [24]
In the citing paper
“In S. cerevisiae, single nucleotide variations are also detected within dinucleotide/trinucleotide tracts (microsatellites) (24, 25).”
From Mismatch Repair of DNA Replication Errors Contributes to Microevolution in the Pathogenic Fungus Cryptococcus neoformans (2017) · cites this paper as [24]
Self-check
Percentages, sums and reported differences re-computed from the paper’s own numbers.
The self-check needs the paper’s full text.
Citations
Cites
Fast and accurate short read alignment with Burrows-Wheeler transform
Li, H., & Durbin, R. (2009) · Bioinformatics · doi:10.1093/bioinformatics/btp324 · Cited by 58,607
The Genome Analysis Toolkit: A MapReduce framework for analyzing next-generation DNA sequencing data
McKenna, A., Hanna, M., Banks, E., Sivachenko, A., Cibulskis, K., Kernytsky, A., Garimella, K., Altshuler, D., Gabriel, S., Daly, M., et al. (2010) · Genome Research · doi:10.1101/gr.107524.110 · Cited by 27,895
BEDTools: a flexible suite of utilities for comparing genomic features
Quinlan, A. R., & Hall, I. M. (2010) · Bioinformatics · doi:10.1093/bioinformatics/btq033 · Cited by 27,437
Robinson, J. T., Thorvaldsdóttir, H., Winckler, W., Guttman, M., Lander, E. S., Getz, G., & Mesirov, J. P. (2011) · Nature Biotechnology · doi:10.1038/nbt.1754 · Cited by 15,390
Integrative Genomics Viewer (IGV): high-performance genomics data visualization and exploration
Thorvaldsdottir, H., Robinson, J. T., & Mesirov, J. P. (2013) · Briefings in Bioinformatics · doi:10.1093/bib/bbs017 · Cited by 9,049
Comprehensive molecular characterization of human colon and rectal cancer
The Cancer Genome Atlas Network (2012) · Nature · doi:10.1038/nature11252 · Cited by 8,499
Current protocols in molecular biology
(1988) · Trends in Biochemical Sciences · doi:10.1016/0968-0004(88)90131-4 · Cited by 4,234
Mutations of bacteria from virus sensitivity to virus resistance
Luria, S. E., & Delbrück, M. (1943) · Genetics · doi:10.1093/genetics/28.6.491 · Cited by 3,894
Haplotype-based variant detection from short-read sequencing
Garrison, E., & Marth, G. (2012) · arXiv · doi:10.48550/arxiv.1207.3907 · Cited by 3,700
Goecks, J., Nekrutenko, A., Taylor, J., & The Galaxy Team (2010) · Genome biology · doi:10.1186/gb-2010-11-8-r86 · Cited by 3,539
Research works printed but not linked: 1
- Silva, 2009, Mismatch repair genes in Lynch syndrome: a review., Sao Paulo Med. J., 127, 46, 10.1590/S1516-31802009000100010 · DOI
Cited by
Sorted by citations
Eukaryotic Mismatch Repair in Relation to DNA Replication
Kunkel, T. A., & Erie, D. A. (2015) · Annual Review of Genetics · doi:10.1146/annurev-genet-112414-054722 · Cited by 459
Determinants of Mutation Rate Variation in the Human Germline
Ségurel, L., Wyman, M. J., & Przeworski, M. (2014) · Annual Review of Genomics and Human Genetics · doi:10.1146/annurev-genom-031714-125740 · Cited by 289
Adaptation to High Ethanol Reveals Complex Evolutionary Pathways
Voordeckers, K., Kominek, J., Das, A. J., Espinosa‐Cantú, A., Maeyer, D. D., Arslan, A., Pee, M. V., van der Zande, E., Meert, W., Yang, Y., et al. (2015) · PLoS Genetics · doi:10.1371/journal.pgen.1005635 · Cited by 171
Genome-scale phylogeny and contrasting modes of genome evolution in the fungal phylum Ascomycota
Shen, X., Steenwyk, J. L., LaBella, A. L., Opulente, D. A., Zhou, X., Kominek, J., Li, Y., Groenewald, M., Hittinger, C. T., & Rokas, A. (2020) · Science Advances · doi:10.1126/sciadv.abd0079 · Cited by 157
Mutational signatures of DNA mismatch repair deficiency in C. elegans and human cancersPreprint
Meier, B., Volkova, N. V., Hong, Y., Schofield, P. G., Campbell, P. J., Gerstung, M., & Gartner, A. (2018) · Genome Research · doi:10.1101/gr.226845.117 · Cited by 158
Metadata
- Authors
- Lang, G. I., Parsons, L., & Gammie, A. E.
- Affiliations
- Princeton University (US)
- Corresponding author
- Gammie, Alison E
- Venue
- G3 Genes Genomes Genetics
- Publisher
- Oxford University Press (OUP)
- Published
- 2013-09-01
- Volume
- 3
- Issue
- 9
- Pages
- 1453-1465
- ISSN
- 2160-1836 (ISSN-L)
- PMC
- PMC3755907
- OpenAlex
- W2139160625
- Cited by
- 107
- References
- 85
- Citations by year
- 2026: 3 · 2025: 3 · 2024: 2 · 2023: 12 · 2022: 7 · 2021: 14 · 2020: 9 · 2019: 9 · 2018: 8 · 2017: 12 · 2016: 10 · 2015: 13 · 2014: 5
- FWCI
- 6.86
- Type
- journal article
- Language
- en
- Open access
- gold
- doi.org
- Licence
- Locations
- G3 Genes Genomes Genetics (publishedVersion, cc-by)
- Europe PMC (PubMed Central) (publishedVersion, cc-by)
- PubMed Central (publishedVersion, cc-by)
- PubMed (publishedVersion)
- Funders
- National Cancer Institute (P30CA072720)
- National Institute of General Medical Sciences (P50GM071508)
- Topics
- Health Sciences › Medicine › Pathology and Forensic Medicine › Genetic factors in colorectal cancer
- Life Sciences › Biochemistry, Genetics and Molecular Biology › Molecular Biology › DNA Repair Mechanisms
- Life Sciences › Biochemistry, Genetics and Molecular Biology › Molecular Biology › Fungal and yeast genetics research
- Keywords
- DNA mismatch repair, mutation rate, mutational spectra, Lynch syndrome, MSH2, MLH1, Saccharomyces cerevisiae, microsatellite markers, tumor suppressor, genome-wide mutagenesis, DNA replication timing
- MeSH terms
- Alleles, Chromosomes, Saccharomyces cerevisiae, Mutagenesis, Insertional, Genome, Fungal, Gene Deletion, Microsatellite Repeats, Mutation, Missense, Saccharomyces cerevisiae Proteins, MutS Homolog 2 Protein, DNA Mismatch Repair, High-Throughput Nucleotide Sequencing, Mutation Rate
About these checks
Registry, retraction, Cites and statistics results are computed, not judged, with one exception: a printed reference that no index lists is read once by a model before it counts as a citation error. Claims are extracted by a model and kept only when their quote appears verbatim in the text; each cited source is then checked, with a model’s help, for whether it says what the claim relies on. Those verdicts can be wrong — read the claim’s quote and the cited source before relying on one.
Statistics and arithmetic are recomputed, not judged.
Confidence bands are shown only for fields calibrated on our annotated test set. None is calibrated yet, so no band is shown.
What counts as a claim ›How we measure confidence ›How we check this ›
Are you an author, or do you see a problem with this page? Request a review
