

The DOI matches its Crossref record; 77 of the 78 references it cites were found in a registry or an index.
Exosomal microRNAs derived from colorectal cancer-associated fibroblasts: role in driving cancer progression
Open accessAbstract
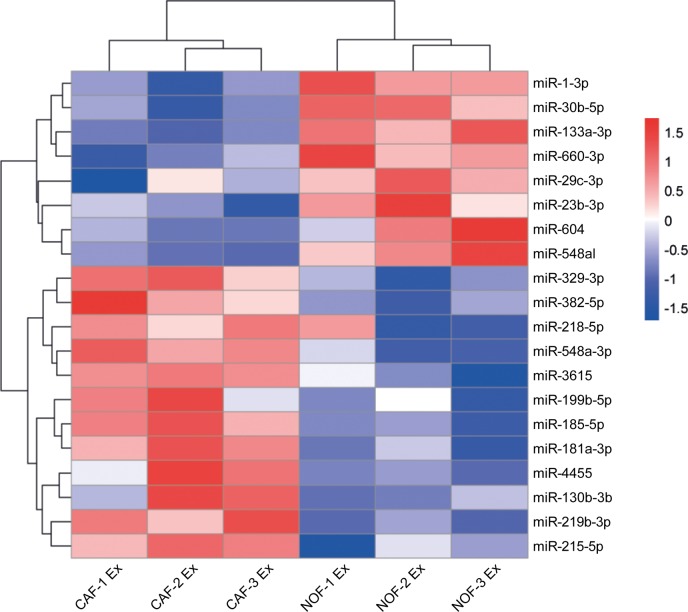
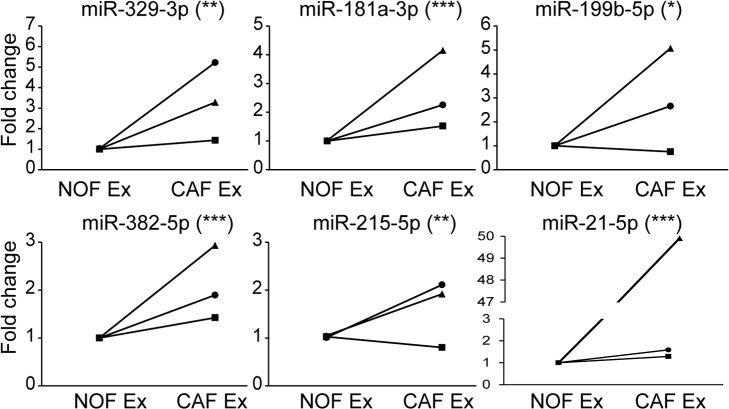
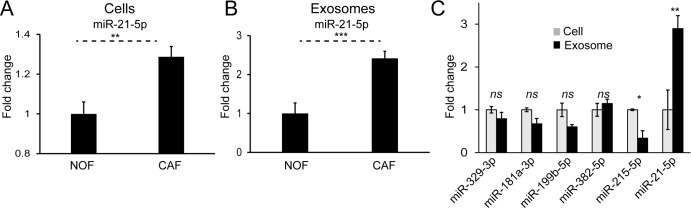
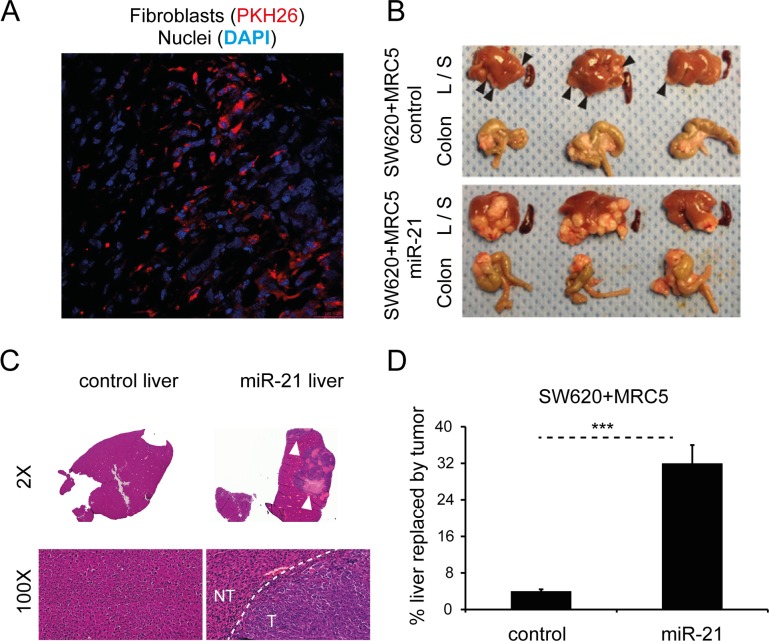
, we demonstrated that fibroblast exosomes are transferred to colorectal cancer cells, with a resultant increase in cellular microRNA levels, impacting proliferation and chemoresistance. To probe this further, exosomal microRNAs were profiled from paired patient-derived normal and cancer-associated fibroblasts, from an ongoing prospective biomarker study. An exosomal cancer-associated fibroblast signature consisting of microRNAs 329, 181a, 199b, 382, 215 and 21 was identified. Of these, miR-21 had highest abundance and was enriched in exosomes. Orthotopic xenografts established with miR-21-overexpressing fibroblasts and CRC cells led to increased liver metastases compared to those established with control fibroblasts. Our data provide a novel stromal exosome signature in colorectal cancer, which has potential for biomarker validation. Furthermore, we confirmed the importance of stromal miR-21 in colorectal cancer progression using an orthotopic model, and propose that exosomes are a vehicle for miR-21 transfer between stromal fibroblasts and cancer cells.
Overview
The claims and statistics of this paper haven’t been checked yet.
Run the check — free, no account needed. It reads the open-access text and checks the sources it cites.
Integrity signals
Registry
Cites
Statistics
Figures
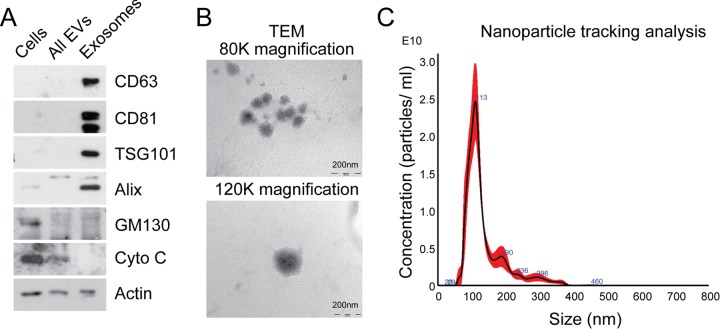
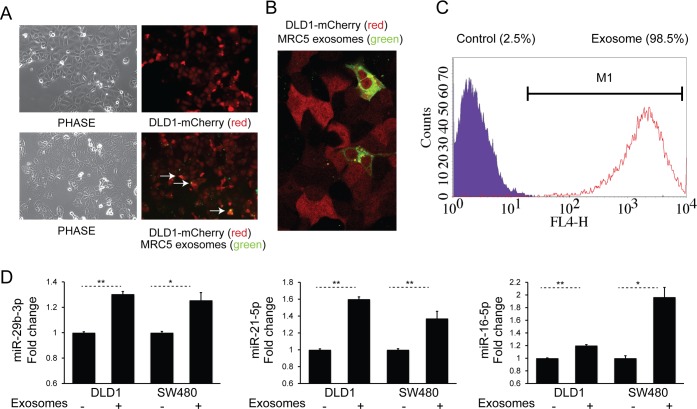
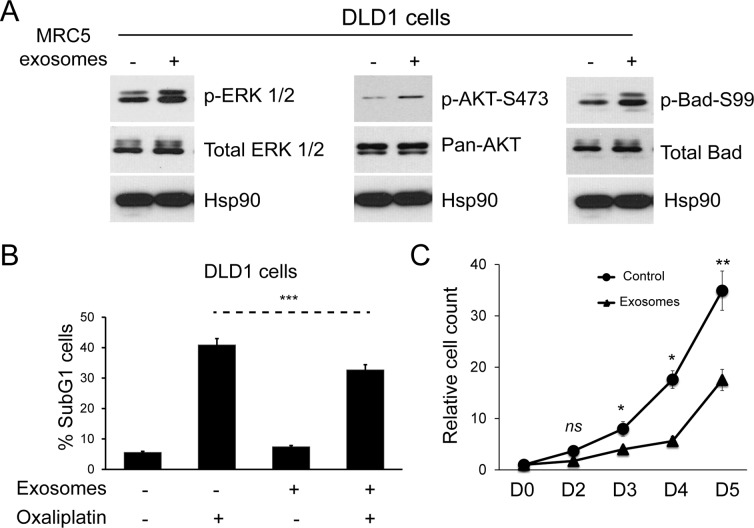
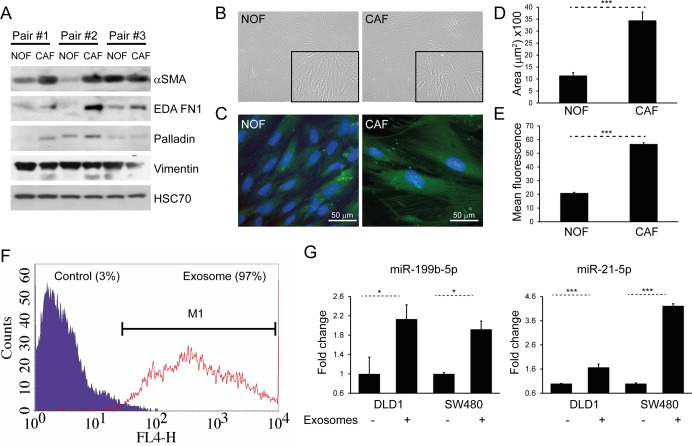
Verification
Claims the paper makes
The claims and statistics of this paper haven’t been checked yet.
Run the check — free, no account needed. It reads the open-access text and checks the sources it cites.
Claims other papers make about this one
Each is checked against this paper’s own text: does it say what the citing paper says it does?
The source backs part of the claim, not all of it — or backs it for a different population, condition or comparison.
In the citing paper
“CAFs are also a substantial source of growth factors, cytokines and exosomes that can promote tumour growth and modulate therapy responses27,106–108.”
From A framework for advancing our understanding of cancer-associated fibroblasts (2020) · cites this paper as [106]
Experimental — accuracy not yet measured
Self-check
Percentages, sums and reported differences re-computed from the paper’s own numbers.
The self-check needs the paper’s full text.
Citations
Cites
Hallmarks of Cancer: The Next Generation
Hanahan, D., & Weinberg, R. A. (2011) · Cell · doi:10.1016/j.cell.2011.02.013 · Cited by 66,590
Valadi, H., Ekström, K., Bossios, A., Sjöstrand, M., Lee, J. J., & Lötvall, J. O. (2007) · Nature Cell Biology · doi:10.1038/ncb1596 · Cited by 12,834
Extracellular vesicles: Exosomes, microvesicles, and friends
Raposo, G., & Stoorvogel, W. (2013) · Journal of Cell Biology · doi:10.1083/jcb.201211138 · Cited by 8,099
Circulating microRNAs as stable blood-based markers for cancer detection
Mitchell, P. S., Parkin, R. K., Kroh, E. M., Fritz, B. R., Wyman, S. K., Pogosova-Agadjanyan, E. L., Peterson, A., Noteboom, J., O'Briant, K. C., Allen, A., et al. (2008) · Proceedings of the National Academy of Sciences · doi:10.1073/pnas.0804549105 · Cited by 7,969
A microRNA expression signature of human solid tumors defines cancer gene targets
Volinia, S., Calin, G. A., Liu, C.-G., Ambs, S., Cimmino, A., Petrocca, F., Visone, R., Iorio, M., Roldo, C., Ferracin, M., et al. (2006) · Proceedings of the National Academy of Sciences · doi:10.1073/pnas.0510565103 · Cited by 5,697
Global patterns and trends in colorectal cancer incidence and mortality
Arnold, M., Sierra, M. S., Laversanne, M., Soerjomataram, I., Jemal, A., & Bray, F. (2016) · Gut · doi:10.1136/gutjnl-2015-310912 · Cited by 5,392
Tumour exosome integrins determine organotropic metastasis
Hoshino, A., Costa-Silva, B., Shen, T.-L., Rodrigues, G., Hashimoto, A., Tesic Mark, M., Molina, H., Kohsaka, S., Di Giannatale, A., Ceder, S., et al. (2015) · Nature · doi:10.1038/nature15756 · Cited by 5,101
de Gramont, A., Figer, A., Seymour, M., Homerin, M., Hmissi, A., Cassidy, J., Boni, C., Cortes-Funes, H., Cervantes, A., Freyer, G., et al. (2000) · Journal of Clinical Oncology · doi:10.1200/jco.2000.18.16.2938 · Cited by 3,815
Orimo, A., Gupta, P. B., Sgroi, D. C., Arenzana-Seisdedos, F., Delaunay, T., Naeem, R., Carey, V. J., Richardson, A. L., & Weinberg, R. A. (2005) · Cell · doi:10.1016/j.cell.2005.02.034 · Cited by 3,759
Melanoma exosomes educate bone marrow progenitor cells toward a pro-metastatic phenotype through MET
Peinado, H., Alečković, M., Lavotshkin, S., Matei, I., Costa-Silva, B., Moreno-Bueno, G., Hergueta-Redondo, M., Williams, C., García-Santos, G., Ghajar, C. M., et al. (2012) · Nature Medicine · doi:10.1038/nm.2753 · Cited by 3,715
Cited by
Sorted by citations
A framework for advancing our understanding of cancer-associated fibroblasts
Sahai, E., Astsaturov, I., Cukierman, E., DeNardo, D. G., Egeblad, M., Evans, R. M., Fearon, D., Greten, F. R., Hingorani, S. R., Hunter, T., et al. (2020) · Nature Reviews Cancer · doi:10.1038/s41568-019-0238-1 · Cited by 3,863
Therapeutic Targeting of the Tumor Microenvironment
Bejarano, L., Jordão, M. J. C., & Joyce, J. A. (2021) · Cancer Discovery · doi:10.1158/2159-8290.cd-20-1808 · Cited by 1,718
CAF secreted miR-522 suppresses ferroptosis and promotes acquired chemo-resistance in gastric cancer
Zhang, H., Deng, T., Liu, R., Ning, T., Yang, H., Liu, D., Zhang, Q., Lin, D., Ge, S., Bai, M., et al. (2020) · Molecular Cancer · doi:10.1186/s12943-020-01168-8 · Cited by 1,029
Cancer-associated adipocytes: key players in breast cancer progression
Wu, Q., Li, B., Li, Z., Li, J., Sun, S., & Sun, S. (2019) · Journal of Hematology & Oncology · doi:10.1186/s13045-019-0778-6 · Cited by 462
Qin, X., Guo, H.-Y., Wang, X.-N., Zhu, X.-Q., Yan, M., Wang, X., Xu, Q., Shi, J.-B., Lu, E., Chen, W., et al. (2019) · Genome Biology · doi:10.1186/s13059-018-1604-0 · Cited by 386
Cancer-Derived Exosomes: Their Role in Cancer Biology and Biomarker Development
Kok, V. C., & Yu, C. (2020) · International Journal of Nanomedicine · doi:10.2147/ijn.s272378 · Cited by 409
The Role of Cancer-Associated Fibroblasts in Cancer Invasion and Metastasis
Asif, P. J., Longobardi, C., Hahne, M., & Medema, J. P. (2021) · Cancers · doi:10.3390/cancers13184720 · Cited by 260
Bhat, A. A., Nisar, S., Singh, M. K., Ashraf, B., Masoodi, T., Prasad, C. P., Sharma, A., Maacha, S., Karedath, T., Hashem, S., et al. (2022) · 癌症:英文版 · doi:10.1002/cac2.12295 · Cited by 251
A Comprehensive Review of Cancer MicroRNA Therapeutic Delivery Strategies
Forterre, A. V., Komuro, H., Aminova, S., & Harada, M. (2020) · Cancers · doi:10.3390/cancers12071852 · Cited by 233
Exosomal microRNAs (exomiRs): Small molecules with a big role in cancer
Bhome, R., Vecchio, F. D., Lee, G.-H., Bullock, M. D., Primrose, J. M., Sayan, E., & Mirnezami, A. H. (2018) · Cancer Letters · doi:10.1016/j.canlet.2018.02.002 · Cited by 235
Self-citationRole of Exosomes in Crosstalk Between Cancer-Associated Fibroblasts and Cancer Cells
Yang, X., Li, Y., Zou, L., & Zhu, Z. (2019) · Frontiers in Oncology · doi:10.3389/fonc.2019.00356 · Cited by 205
Emerging Function and Clinical Values of Exosomal MicroRNAs in Cancer
Wang, M., Yu, F., Ding, H., Wang, Y., Li, P., & Wang, K. (2019) · Molecular Therapy — Nucleic Acids · doi:10.1016/j.omtn.2019.04.027 · Cited by 197
Exosomes as potential sources of biomarkers in colorectal cancer
Xiao, Y., Zhong, J., Zhong, B., Huang, J., Jiang, L., Jiang, Y., Yuan, J., Sun, J. G., Dai, L., Yang, C., et al. (2020) · Cancer Letters · doi:10.1016/j.canlet.2020.01.033 · Cited by 186
Mouse models of colorectal cancer: Past, present and future perspectives
Bürtin, F., Mullins, C. S., & Linnebacher, M. (2020) · World Journal of Gastroenterology · doi:10.3748/wjg.v26.i13.1394 · Cited by 183
Sun, L., Xu, K., Cui, J. R., Yuan, D., Zou, B., Li, J., Liu, J., Li, K., Meng, Z. H., & Zhang, B. (2019) · Oncology Reports · doi:10.3892/or.2019.7255 · Cited by 166
Extracellular vesicles: Critical players during cell migration
Sung, B. H., Parent, C. A., & Weaver, A. M. (2021) · Developmental Cell · doi:10.1016/j.devcel.2021.03.020 · Cited by 166
Emerging microRNA biomarkers for colorectal cancer diagnosis and prognosis
Chen, B., Xia, Z., Deng, Y., Yang, Y., Zhang, P., Zhu, H., Xu, N., & Liang, S. (2019) · Open Biology · doi:10.1098/rsob.180212 · Cited by 156
Falzone, L., Scola, L., Zanghì, A., Biondi, A., Cataldo, A. D., Libra, M., & Candido, S. (2018) · Aging · doi:10.18632/aging.101444 · Cited by 147
Chen, X., Liu, J., Zhang, Q., Liu, B., Cheng, Y., Zhang, Y., Sun, Y., Ge, H., & Liu, Y. (2020) · Journal of Experimental & Clinical Cancer Research · doi:10.1186/s13046-019-1507-2 · Cited by 142
Jena, B. C., Sarkar, S., Rout, L., & Mandal, M. (2021) · Cancer Letters · doi:10.1016/j.canlet.2021.08.002 · Cited by 143
Zhou, L., Li, J., Tang, Y.-P., & Yang, M. (2021) · Journal of Translational Medicine · doi:10.1186/s12967-020-02648-7 · Cited by 113
Cancer-Associated Fibroblasts: Versatile Players in the Tumor Microenvironment
Ganguly, D., Chandra, R., Karalis, J. D., Teke, M. E., Aguilera, T. A., Maddipati, R., Wachsmann, M., Ghersi, D., Siravegna, G., Zeh, H. J., et al. (2020) · Cancers · doi:10.3390/cancers12092652 · Cited by 130
Tumor exosomes: a double-edged sword in cancer therapy
Sun, W., Luo, J., Jiang, H., & Duan, D. D. (2018) · Acta Pharmacologica Sinica · doi:10.1038/aps.2018.17 · Cited by 126
Chen, X., Liu, Y., Zhang, Q., Liu, B., Cheng, Y., Zhang, Y., Sun, Y., & Liu, J. (2020) · Molecular Therapy — Nucleic Acids · doi:10.1016/j.omtn.2020.11.003 · Cited by 104
Circular RNAs in the tumour microenvironment
Ma, Z., Shuai, Y., Gao, X., Wen, X., & Ji, J. (2020) · Molecular Cancer · doi:10.1186/s12943-019-1113-0 · Cited by 96
The Role of the Tumor Microenvironment and Treatment Strategies in Colorectal Cancer
Chen, Y., Zheng, X., & Wu, C. (2021) · Frontiers in Immunology · doi:10.3389/fimmu.2021.792691 · Cited by 104
Exosome-mediated cell-cell communication in tumor progression.
Wan, Z., Gao, X., Dong, Y., Zhao, Y., Chen, X., Yang, G., & Liu, L. (2018) · Europe PMC (PubMed Central) · Cited by 92
The Role of Cancer-Associated Fibroblasts and Extracellular Vesicles in Tumorigenesis
Shoucair, I., Mello, F. W., Jabalee, J., Maleki, S., & Garnis, C. (2020) · International Journal of Molecular Sciences · doi:10.3390/ijms21186837 · Cited by 91
Cancer-associated fibroblasts in colorectal cancer
Zonouzi, S. K., Pezeshki, P. S., Razi, S., & Rezaei, N. (2021) · Clinical & Translational Oncology · doi:10.1007/s12094-021-02734-2 · Cited by 86
Zhang, Y., Zhao, J., Ding, M., Su, Y., Cui, D., Jiang, C., Zhao, S., Jia, G., Wang, X., Ruan, Y., et al. (2020) · Journal of Experimental & Clinical Cancer Research · doi:10.1186/s13046-020-01761-1 · Cited by 84
MiRNAs Derived from Cancer-Associated Fibroblasts in Colorectal Cancer
Savardashtaki, A., Shabaninejad, Z., Movahedpour, A., Sahebnasagh, R., Mirzaei, H., & Hamblin, M. R. (2019) · Epigenomics · doi:10.2217/epi-2019-0110 · Cited by 79
Exosomal MiRNAs in Pediatric Cancers
Galardi, A., Colletti, M., Paolo, V. D., Vitullo, P., Antonetti, L., Russo, I., & Giannatale, A. D. (2019) · International Journal of Molecular Sciences · doi:10.3390/ijms20184600 · Cited by 77
Colorectal cancer: Metabolic interactions reshape the tumor microenvironment
Chen, J., Zhu, H., Yin, Y., Jia, S., & Luo, X. (2022) · Biochimica et Biophysica Acta (BBA) - Reviews on Cancer · doi:10.1016/j.bbcan.2022.188797 · Cited by 75
Revisiting the role of cancer-associated fibroblasts in tumor microenvironment
Lan, X., Li, W., Zhao, K., Wang, J., Li, S., & Hai, Z. (2025) · Frontiers in Immunology · doi:10.3389/fimmu.2025.1582532 · Cited by 75
Zhang, H., Shi, Y., Liu, J., Wang, H., Wang, P., Wu, Z., Li, L., Gu, L., Cao, P., Wang, G., et al. (2021) · Journal of Cellular and Molecular Medicine · doi:10.1111/jcmm.15765 · Cited by 68
A Tale of Two States: Normal and Transformed, With and Without Rigidity Sensing
Sheetz, M. P. (2019) · Annual Review of Cell and Developmental Biology · doi:10.1146/annurev-cellbio-100818-125227 · Cited by 66
Guo, W., Cai, Y., Liu, X., Ji, Y., Zhang, C., Wang, L., Liao, W., Liu, Y., Cui, N., Xiang, J., et al. (2023) · Research · doi:10.34133/research.0041 · Cited by 67
Exosomal Non-coding RNAs-Mediated Crosstalk in the Tumor Microenvironment
Chen, Q., Li, Y., Liu, Y., Xu, W., & Zhu, X. (2021) · Frontiers in Cell and Developmental Biology · doi:10.3389/fcell.2021.646864 · Cited by 65
Gu, C., Lu, H., & Qian, Z. (2020) · Biochemical and Biophysical Research Communications · doi:10.1016/j.bbrc.2020.04.142 · Cited by 59
Su, T., Zhang, P., Zhao, F., & Zhang, S. (2021) · Frontiers in Oncology · doi:10.3389/fonc.2021.631703 · Cited by 52
Angioregulatory microRNAs in Colorectal Cancer
Soheilifar, M. H., Grusch, M., Neghab, H. K., Amini, R., Maadi, H., Saidijam, M., & Wang, Z. (2019) · Cancers · doi:10.3390/cancers12010071 · Cited by 51
Kang, S. H., Oh, S. Y., Lee, K.-Y., Lee, H., Kim, M.-S., Kwon, T., Kim, J., Lee, S., Choi, S., & Hong, S. (2023) · Theranostics · doi:10.7150/thno.87329 · Cited by 50
Bhome, R., Emaduddin, M., James, V. H., House, L. M., Thirdborough, S. M., Mellone, M., Tulkens, J., Primrose, J. N., Thomas, G. J., Wever, O. D., et al. (2022) · Journal of Extracellular Vesicles · doi:10.1002/jev2.12226 · Cited by 52
Self-citationFang, Z., Xu, J., Zhang, B., Wang, W., Liu, J., Liang, C., Hua, J., Meng, Q., Yu, X., & Shi, S. (2020) · Journal of Hematology & Oncology · doi:10.1186/s13045-020-00988-x · Cited by 47
Fotsitzoudis, C., Koulouridi, A., Messaritakis, I., Konstantinidis, T., Gouvas, N., Tsiaoussis, J., & Souglakos, J. (2022) · Cancers · doi:10.3390/cancers14184394 · Cited by 46
Revisiting the Role of Exosomes in Colorectal Cancer: Where Are We Now?
Mannavola, F., Salerno, T., Passarelli, A. M., Tucci, M., Internò, V., & Silvestris, F. (2019) · Frontiers in Oncology · doi:10.3389/fonc.2019.00521 · Cited by 49
Liao, F., Lü, X., & Dong, W. (2020) · IUBMB Life · doi:10.1002/iub.2385 · Cited by 47
Exosomal microRNAs and other non-coding RNAs as colorectal cancer biomarkers: a review
Francavilla, A., Turoczi, S., Tarallo, S., Vodička, P., Pardini, B., & Naccarati, A. (2019) · Mutagenesis · doi:10.1093/mutage/gez038 · Cited by 47
Wang, C., Peng, R., Zeng, M., Zhang, Z., Liu, S., Jiang, D., Lu, Y., & Zou, F. (2020) · Cell Death and Disease · doi:10.1038/s41419-020-03265-4 · Cited by 48
A Snapshot of The Tumor Microenvironment in Colorectal Cancer: The Liquid Biopsy
Herrera, M., Galindo-Pumariño, C., García‐Barberán, V., & Peña, C. (2019) · International Journal of Molecular Sciences · doi:10.3390/ijms20236016 · Cited by 45
Exosomal miRNA: Small Molecules, Big Impact in Colorectal Cancer
Vautrot, V., Chanteloup, G., Elmallah, M. I. Y., Cordonnier, M., Aubin, F., Garrido, C., & Gobbo, J. (2019) · Journal of Oncology · doi:10.1155/2019/8585276 · Cited by 43
Rahmati, S., Moeinafshar, A., & Rezaei, N. (2024) · Journal of Translational Medicine · doi:10.1186/s12967-024-05267-8 · Cited by 47
Extracellular vesicle-orchestrated crosstalk between cancer-associated fibroblasts and tumors
He, C., Wang, L., Li, L., & Zhu, G. (2021) · Translational Oncology · doi:10.1016/j.tranon.2021.101231 · Cited by 44
Zhao, J., Lin, H., Huang, K., & Shen, L. (2022) · Cell Death Discovery · doi:10.1038/s41420-022-01116-z · Cited by 41
Kotelevets, L., & Chastre, E. (2023) · Cancers · doi:10.3390/cancers15041107 · Cited by 41
The Interplay between T Cells and Cancer: The Basis of Immunotherapy
Chen, C., Liu, X., Chang, C., Wang, H. Y., & Wang, R. (2023) · Genes · doi:10.3390/genes14051008 · Cited by 42
Naito, Y., Yoshioka, Y., & Ochiya, T. (2022) · Cancer Cell International · doi:10.1186/s12935-022-02784-8 · Cited by 40
Extracellular Vesicles Orchestrate Immune and Tumor Interaction Networks
Yim, K. H. W., Hrout, A. A., Borgoni, S., & Chahwan, R. (2020) · Cancers · doi:10.3390/cancers12123696 · Cited by 33
Zhang, X., Wang, J., Liu, N., Wu, W., Li, H., Chen, J., & Guo, X. Q. (2022) · Annals of Translational Medicine · doi:10.21037/atm-22-4267 · Cited by 37
Yap, T., Pruthi, N., Seers, C. A., Belobrov, S., McCullough, M. J., & Celentano, A. (2020) · International Journal of Molecular Sciences · doi:10.3390/ijms21041197 · Cited by 35
Exosomal microRNAs in colorectal cancer: Overcoming barriers of the metastatic cascade (Review)
Danac, J. M. C., Uy, A., & Garcia, R. L. (2021) · International Journal of Molecular Medicine · doi:10.3892/ijmm.2021.4945 · Cited by 31
The Emerging Role of Exosomal Non-coding RNAs in Musculoskeletal Diseases
Tu, C., He, J., Chen, R., & Li, Z. (2019) · Current Pharmaceutical Design · doi:10.2174/1381612825666191113104946 · Cited by 30
Exosomes derived from cancer-associated fibroblasts mediate response to cancer therapy
Masoudi-Khoram, N., Soheilifar, M. H., Ghorbanifar, S., Nobari, S., Hakimi, M., & Hassani, M. (2023) · Critical Reviews in Oncology/Hematology · doi:10.1016/j.critrevonc.2023.103967 · Cited by 30
Gou, Z., Li, J., Liu, J., & Yang, N. (2024) · Frontiers in Cell and Developmental Biology · doi:10.3389/fcell.2024.1378302 · Cited by 34
Tang, Y. L., Zhang, W., Sheng, T., He, X., & Xiong, X. (2021) · Molecular Medicine Reports · doi:10.3892/mmr.2021.12408 · Cited by 28
Nadal, L., Peissert, F., Elsayed, A., Weiß, T., Look, T., Weller, M., Piro, G., Carbone, C., Tortora, G., Matasci, M., et al. (2022) · Journal for ImmunoTherapy of Cancer · doi:10.1136/jitc-2022-005282 · Cited by 29
Tsujimaru, K., Takanashi, M., Sudo, K., Ishikawa, A., Mineo, S., Ueda, S., Kumagai, K., & Kuroda, M. (2020) · Regenerative Therapy · doi:10.1016/j.reth.2020.08.004 · Cited by 27
Cancer-associated fibroblasts and the tumor microenvironment in non-small cell lung cancer
Suzuki, J., Tsuboi, M., & Ishii, G. (2021) · Expert Review of Anticancer Therapy · doi:10.1080/14737140.2022.2019018 · Cited by 22
Cellular Interactions in the Intestinal Stem Cell Niche
Pastuła, A., & Marcinkiewicz, J. (2018) · Archivum Immunologiae et Therapiae Experimentalis · doi:10.1007/s00005-018-0524-8 · Cited by 27
Nanotechnologies for enhancing cancer immunotherapy
Yang, J., Wang, C., Shi, S., & Dong, C. (2020) · Nano Research · doi:10.1007/s12274-020-2904-8 · Cited by 26
Fibroblast Subsets in Intestinal Homeostasis, Carcinogenesis, Tumor Progression, and Metastasis
Dang, H., Harryvan, T. J., & Hawinkels, L. J. A. C. (2021) · Cancers · doi:10.3390/cancers13020183 · Cited by 26
Ahmadi, M., Jafari, R., Mahmoodi, M., & Rezaie, J. (2021) · Cell Biochemistry and Function · doi:10.1002/cbf.3622 · Cited by 26
Exosomes in Colorectal Cancer: From Physiology to Clinical Applications
Țîțu, Ș., Gâta, V., Decea, R., Mocan, T., Dina, C., Irimie, A., & Lisencu, C. (2023) · International Journal of Molecular Sciences · doi:10.3390/ijms24054382 · Cited by 24
EVs as Potential New Therapeutic Tool/Target in Gastrointestinal Cancer and HCC
Słomka, A., Mocan, T., Wang, B., Nenu, I., Urban, S., Gonzalez-Carmona, M. A., Schmidt‐Wolf, I. G. H., Kornek, M., Strassburg, C., Sparchez, Z. A., et al. (2020) · Cancers · doi:10.3390/cancers12103019 · Cited by 24
Sharpe, B. P., Hayden, A. L., Manousopoulou, A., Cowie, A., Walker, R., Harrington, J., Izadi, F., Breininger, S. P., Gibson, J., Pickering, O. J., et al. (2022) · Cell Reports Medicine · doi:10.1016/j.xcrm.2022.100541 · Cited by 29
Self-citationExosome and Secretion: Action On?
Hu, Y., Zhang, R., & Chen, G. (2020) · Advances in experimental medicine and biology · doi:10.1007/978-981-15-3266-5_19 · Cited by 25
Exosomal noncoding RNAs in colorectal cancer
Wu, Q., Liu, W., Wang, J., Zhu, L., Wang, Z., & Peng, Y. (2020) · Cancer Letters · doi:10.1016/j.canlet.2020.08.037 · Cited by 22
Zarin, B., Rafiee, L., Daneshpajouhnejad, P., & Javanmard, S. H. (2021) · Tumor Biology · doi:10.3233/tub-200075 · Cited by 23
He, X., Zhong, X., Hu, Z., Zhao, S., Wei, P., & Li, D. (2020) · Clinical and Translational Medicine · doi:10.1002/ctm2.249 · Cited by 21
Ren, J., Li, W., Pan, G., Huang, F.-C., Yang, J. H., Zhang, H., Zhou, R., & Xu, N. (2021) · Analytical Cellular Pathology · doi:10.1155/2021/9927720 · Cited by 21
Cui, Y., Zhang, S., Hu, X., & Gao, F. (2022) · Bioengineered · doi:10.1080/21655979.2022.2076008 · Cited by 21
RetractedCrossland, R. E., Albiero, A., Sanjurjo‐Rodríguez, C., Reis, M., Resteu, A., Anderson, A. E., Dickinson, A. M., Pratt, A. G., Birch, M., McCaskie, A. W., et al. (2023) · Journal of Extracellular Biology · doi:10.1002/jex2.72 · Cited by 22
Dougherty, U., Mustafi, R., Zhu, H., Zhu, X., Deb, D. K., Meredith, S. C., Ayaloglu-Butun, F., Fletcher, M. M., Castillo, A. S., Pekow, J. R., et al. (2020) · Epigenetics · doi:10.1080/15592294.2020.1863117 · Cited by 19
Dias, F., Teixeira, A. L., Nogueira, I., Morais, M., Maia, J., Bodo, C., Ferreira, M., Vieira, I., Silva, J., Lobo, J., et al. (2020) · International Journal of Molecular Sciences · doi:10.3390/ijms21134624 · Cited by 19
Unraveling the role of cancer-associated fibroblasts in colorectal cancer
Cui, J., Ma, J., Gao, X., Sheng, Z.-M., Pan, Z., Shi, L., & Zhang, B. (2024) · World Journal of Gastrointestinal Oncology · doi:10.4251/wjgo.v16.i12.4565 · Cited by 19
Exosomal non-coding RNAs: Blueprint in colorectal cancer metastasis and therapeutic targets
Hussen, B. M., Abdullah, S. T., Abdullah, S. R., Younis, Y. M., Hidayat, H. J., Rasul, M. F., & Mohamadtahr, S. (2023) · Non-coding RNA Research · doi:10.1016/j.ncrna.2023.09.001 · Cited by 17
Yan, L., Zheng, J., Wang, Q., & Hao, H. (2023) · Biochemical and Biophysical Research Communications · doi:10.1016/j.bbrc.2023.09.065 · Cited by 17
Feifei, W., Hui, G., Ruiqiang, Z., Qunxiang, J., & Yu’an, X. (2019) · Technology in Cancer Research & Treatment · doi:10.1177/1533033819870777 · Cited by 16
Extracellular vesicles in Inter-Kingdom communication in gastrointestinal cancer.
Chen, Y., Xu, Y., Zhong, H., Yuan, H., Liang, F., Liu, J., & Tang, W. (2021) · PubMed Central · Cited by 16
Paper-Based Devices for Capturing Exosomes and Exosomal Nucleic Acids From Biological Samples
Lai, C.-H., Lee, C.-L., Vu, C.-A., Vu, V., Tsai, Y.-H., Chen, W., & Cheng, C. (2022) · Frontiers in Bioengineering and Biotechnology · doi:10.3389/fbioe.2022.836082 · Cited by 16
Emerging Therapeutic RNAs for the Targeting of Cancer Associated Fibroblasts
Santana-Viera, L., Ibba, M. L., Rotoli, D., Catuogno, S., & Esposito, C. L. (2020) · Cancers · doi:10.3390/cancers12061365 · Cited by 15
Heck, K. A., Lindholm, H. T., Niederdorfer, B., Tsirvouli, E., Kuiper, M. T. R., Flobak, Å., Lægreid, A., & Thommesen, L. (2023) · Proteomes · doi:10.3390/proteomes11010003 · Cited by 15
Prospective Study on Plasma MicroRNA‐4286 and Incident Acute Coronary Syndrome
Shen, M., Xu, X., Liu, X., Wang, Q.-H., Li, W., You, X., Peng, R., Yuan, Y. L., Long, P., Niu, R., et al. (2021) · Journal of the American Heart Association · doi:10.1161/jaha.120.018999 · Cited by 15
Noh, G. T., Kwon, J., Kim, J.-W., Park, M., Choi, D., Cho, K., Woo, S., Oh, B. Y., Lee, K. Y., & Lee, R. (2020) · PLoS ONE · doi:10.1371/journal.pone.0242057 · Cited by 15
Bhome, R., Peppa, N., Karar, S., McDonnell, D., Mirnezami, A. H., & Hamady, Z. Z. R. (2021) · European Journal of Surgical Oncology · doi:10.1016/j.ejso.2020.12.016 · Cited by 15
Self-citationLi, H., Lin, X., Yang, D., Chen, Z., Wang, X., Re, F., Wei, J., & Chen, J. (2020) · Neoplasma · doi:10.4149/neo_2020_200905n951 · Cited by 16
Li, X., Wu, X., & Su, X. (2022) · Letters in Drug Design & Discovery · doi:10.2174/1570180819666220718121827 · Cited by 14
Mammes, A., Pasquier, J., Mammes, O., Conti, M., Douard, R., & Loric, S. (2021) · World Journal of Gastrointestinal Oncology · doi:10.4251/wjgo.v13.i11.1561 · Cited by 16
Exosomes in tumor‐stroma crosstalk: Shaping the immune microenvironment in colorectal cancer
Zhang, Y., Huo, M., Li, W., Zhang, H., Liu, Q., Jiang, J., Fu, Y., & Huang, C. (2024) · The FASEB Journal · doi:10.1096/fj.202302297r · Cited by 13
MiR-566 mediates cell migration and invasion in colon cancer cells by direct targeting of PSKH1
Zhang, Y., Zhang, S., Yin, J. Y., & Xu, R. (2019) · Cancer Cell International · doi:10.1186/s12935-019-1053-1 · Cited by 12
Metadata
- Authors
- Bhome, R., Goh, R. W., Bullock, M. D., Pillar, N., Thirdborough, S. M., Mellone, M., Mirnezami, R., Galea, D., Veselkov, K., Gu, Q., Underwood, T. J., Primrose, J. N., De Wever, O., Shomron, N., Sayan, A. E., & Mirnezami, A. H.
- Affiliations
- Southampton General Hospital (GB)
- Tel Aviv University (IL)
- Imperial College London (GB)
- MRC University of Glasgow Centre for Virus Research (GB)
- Cancer Sciences, University of Southampton, Somers Building, Southampton General Hospital, Southampton, SO16 6YD, UK
- University Surgical Unit, University of Southampton, Southampton General Hospital, Southampton, SO16 6YD, UK
- Department of Experimental Cancer Research, Ghent University, Radiotherapiepark, Ghent, 9000, Belgium
- ORCID
- Venue
- Aging
- Publisher
- Impact Journals, LLC
- Published
- 2017-12-24
- Volume
- 9
- Issue
- 12
- Pages
- 2666-2694
- ISSN
- 1945-4589 (ISSN-L)
- PMC
- PMC5764398
- OpenAlex
- W2781198385
- Cited by
- 155
- References
- 78
- Citations by year
- 2026: 8 · 2025: 8 · 2024: 16 · 2023: 14 · 2022: 15 · 2021: 30 · 2020: 41 · 2019: 17 · 2018: 6
- FWCI
- 7.26
- Type
- journal article
- Language
- en
- Open access
- green
- www.ncbi.nlm.nih.gov
- Licence
- cc-by
- Locations
- Aging (publishedVersion)
- Europe PMC (PubMed Central) (publishedVersion, cc-by)
- PubMed Central (publishedVersion, cc-by)
- PubMed (publishedVersion)
- ENLIGHTEN (Jurnal Bimbingan dan Konseling Islam) (acceptedVersion)
- ePrints Soton (University of Southampton) (acceptedVersion)
- Ghent University Academic Bibliography (Ghent University) (submittedVersion, cc-by)
- Spiral (Imperial College London) (submittedVersion, cc-by)
- Funders
- UK Research and Innovation
- Cancer Research UK (A20526, 23924, 20526, S_3319)
- National Institute for Health and Care Research (CL-2015-26-003, NF-SI-0515-10059, ACF-2012-26-005, CL-2013-21-012, ACF-2007-26-004)
- Research Councils UK
- University of Southampton
- Medical Research Council (MR/R002061/1)
- Biotechnology and Biological Sciences Research Council (BB/L020858/1)
- Topics
- Life Sciences › Biochemistry, Genetics and Molecular Biology › Molecular Biology › Extracellular vesicles in disease
- Life Sciences › Biochemistry, Genetics and Molecular Biology › Cancer Research › MicroRNA in disease regulation
- Health Sciences › Medicine › Oncology › Cancer Cells and Metastasis
- Keywords
- exosomal microRNAs, colorectal cancer, cancer-associated fibroblasts, miR-21, tumor microenvironment, liver metastasis, chemoresistance, tumor cell proliferation, exosome transfer, biomarkers, orthotopic xenograft
- MeSH terms
- Cancer-Associated Fibroblasts, Aged, Animals, Female, Humans, Male, Colorectal Neoplasms, Disease Progression, MicroRNAs, Mice, Exosomes, Heterografts
About these checks
Registry, retraction, Cites and statistics results are computed, not judged, with one exception: a printed reference that no index lists is read once by a model before it counts as a citation error. Claims are extracted by a model and kept only when their quote appears verbatim in the text; each cited source is then checked, with a model’s help, for whether it says what the claim relies on. Those verdicts can be wrong — read the claim’s quote and the cited source before relying on one.
Statistics and arithmetic are recomputed, not judged.
Confidence bands are shown only for fields calibrated on our annotated test set. None is calibrated yet, so no band is shown.
What counts as a claim ›How we measure confidence ›How we check this ›
Are you an author, or do you see a problem with this page? Request a review
