

The DOI matches its Crossref record; 69 of the 69 references it cites were found in a registry or an index.
Age-related DNA methylation changes are sex-specific: a comprehensive assessment
Open accessAbstract
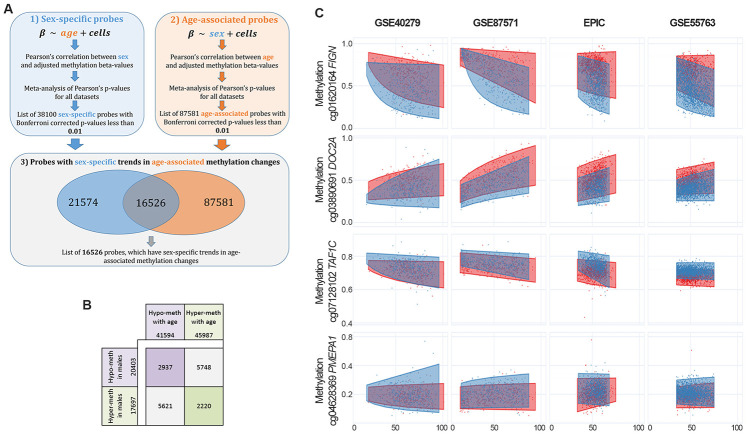
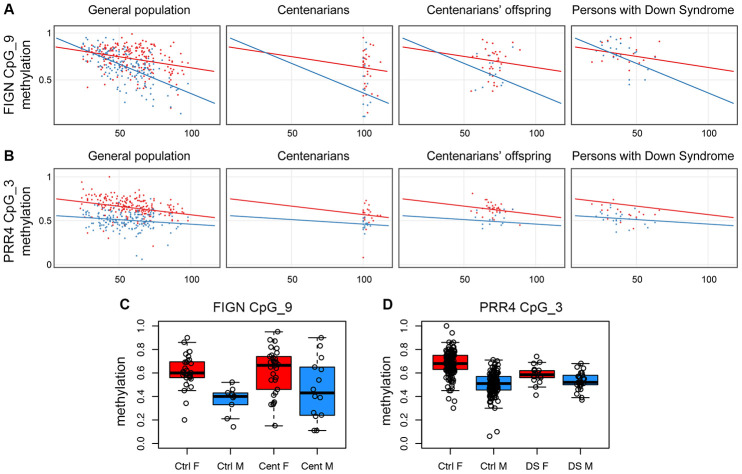
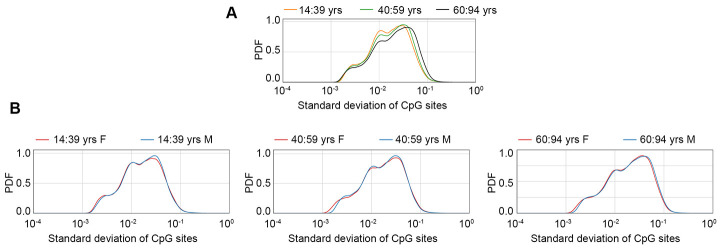
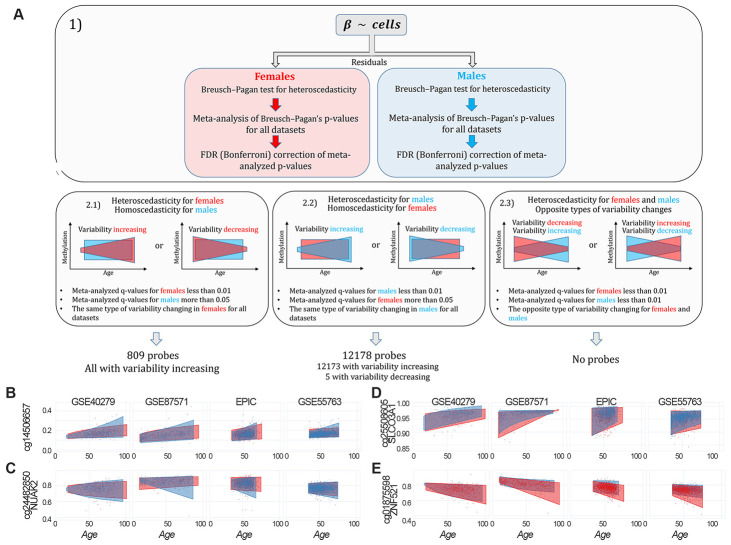
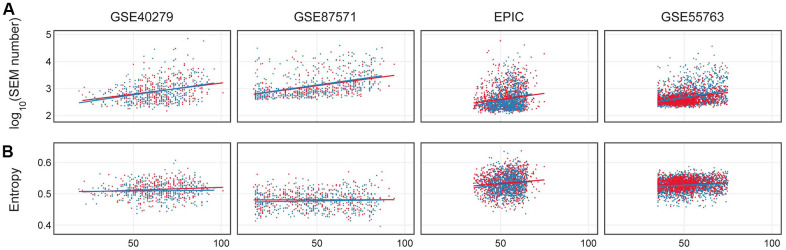
Abstract In humans, females live longer than males but experience a worse longevity, as genome-wide autosomal DNA methylation differences between males and females have been reported. So far, few studies have investigated if DNA methylation is differently affected by aging in males and females. We performed a meta-analysis of 4 large whole blood datasets, comparing 4 aspects of epigenetic age-dependent remodeling between the two sexes: differential methylation, variability, epimutations and entropy. We reported that a large fraction (43%) of sex-associated probes undergoes age-associated DNA methylation changes, and that a limited number of probes shows age-by-sex interaction. We experimentally validated 2 regions mapping in FIGN and PRR4 genes, and showed sex-specific deviations of their methylation patterns in models of decelerated (centenarians) and accelerated (Down syndrome) aging. While we did not find sex differences in the age-associated increase in epimutations and in entropy, we showed that the number of probes showing age-related increase in methylation variability is 15 times higher in males compared to females. Our results can offer new epigenetic tools to study the interaction between aging and sex and can pave the way to the identification of molecular triggers of sex differences in longevity and age-related diseases prevalence.
Overview
The claims and statistics of this paper haven’t been checked yet.
Run the check — free, no account needed. It reads the open-access text and checks the sources it cites.
Integrity signals
Registry
Cites
Statistics
Figures
Verification
Claims the paper makes
The claims and statistics of this paper haven’t been checked yet.
Run the check — free, no account needed. It reads the open-access text and checks the sources it cites.
Claims other papers make about this one
Each is checked against this paper’s own text: does it say what the citing paper says it does?
The cited source says what the claim attributes to it.
In the citing paper
“As advanced aging is the strongest factor for AD, we also compared our results with those from Yusipov et al. [94] and McCartney et al. [35], which identified 8 and 52 autosomal CpGs differentially affected by aging, but we did not find any overlap with these previous studies.”
From Distinct sex-specific DNA methylation differences in Alzheimer’s disease (2022) · cites this paper as [94]
Self-check
Percentages, sums and reported differences re-computed from the paper’s own numbers.
The self-check needs the paper’s full text.
Citations
Cites
NCBI GEO: archive for functional genomics data sets—update
Barrett, T., Wilhite, S. E., Ledoux, P., Evangelista, C., Kim, I. F., Tomashevsky, M., Marshall, K. A., Phillippy, K. H., Sherman, P. M., Holko, M., et al. (2012) · Nucleic Acids Research · doi:10.1093/nar/gks1193 · Cited by 10,418
DNA methylation age of human tissues and cell types
Horvath, S. (2013) · Genome Biology · doi:10.1186/gb-2013-14-10-r115 · Cited by 7,075
A Simple Test for Heteroscedasticity and Random Coefficient Variation
Breusch, T. S., & Pagan, A. R. (1979) · Econometrica · doi:10.2307/1911963 · Cited by 5,647
METAL: fast and efficient meta-analysis of genomewide association scans
Willer, C. J., Li, Y., & Abecasis, G. R. (2010) · Bioinformatics · doi:10.1093/bioinformatics/btq340 · Cited by 5,205
Aryee, M. J., Jaffe, A. E., Bravo, H. C., Ladd‐Acosta, C., Feinberg, A. P., Hansen, K. D., & Irizarry, R. A. (2014) · Bioinformatics · doi:10.1093/bioinformatics/btu049 · Cited by 4,389
Genome-wide methylation profiles reveal quantitative views of human aging rates
Hannum, G., Guinney, J., Zhao, L., Zhang, L., Hughes, G., Sadda, S., Klotzle, B., Bibikova, M., Fan, J.-B., Gao, Y., et al. (2013) · Molecular Cell · doi:10.1016/j.molcel.2012.10.016 · Cited by 4,270
DNA methylation-based biomarkers and the epigenetic clock theory of ageing
Horvath, S., & Raj, K. (2018) · Nature Reviews Genetics · doi:10.1038/s41576-018-0004-3 · Cited by 3,095
Epigenetics and the environment: emerging patterns and implications
Feil, R., & Fraga, M. F. (2012) · Nature Reviews Genetics · doi:10.1038/nrg3142 · Cited by 1,929
DNA methylation aging clocks: challenges and recommendations
Bell, C. G., Lowe, R., Adams, P. D., Baccarelli, A. A., Beck, S., Bell, J. T., Christensen, B. C., Gladyshev, V. N., Heijmans, B. T., Horvath, S., et al. (2019) · Genome Biology · doi:10.1186/s13059-019-1824-y · Cited by 1,025
Undulating changes in human plasma proteome profiles across the lifespan
Lehallier, B., Gate, D., Schaum, N., Nanasi, T., Lee, S. E., Yousef, H., Moran Losada, P., Berdnik, D., Keller, A., Verghese, J., et al. (2019) · Nature Medicine · doi:10.1038/s41591-019-0673-2 · Cited by 981
Self-citationDNA methylation and healthy human aging
Jones, M. J., Goodman, S. J., & Kobor, M. S. (2015) · Aging Cell · doi:10.1111/acel.12349 · Cited by 973
Diagnostics for heteroscedasticity in regression
Cook, R. D., & Weisberg, S. (1983) · Biometrika · doi:10.1093/biomet/70.1.1 · Cited by 887
An epigenetic clock analysis of race/ethnicity, sex, and coronary heart disease
Horvath, S., Gurven, M., Levine, M. E., Trumble, B. C., Kaplan, H. S., Allayee, H., Ritz, B. R., Chen, B. H., Lu, A. T.-H., Rickabaugh, T. M., et al. (2016) · Genome biology · doi:10.1186/s13059-016-1030-0 · Cited by 749
Zhou, W., Laird, P. W., & Shen, H. (2016) · Nucleic Acids Research · doi:10.1093/nar/gkw967 · Cited by 742
Austad, S. N., & Fischer, K. E. (2016) · Cell Metabolism · doi:10.1016/j.cmet.2016.05.019 · Cited by 619
Accelerated epigenetic aging in Down syndrome
Horvath, S., Garagnani, P., Bacalini, M. G., Pirazzini, C., Salvioli, S., Gentilini, D., Blasio, A. M. D., Giuliani, C., Tung, S., Vinters, H. V., et al. (2015) · Aging Cell · doi:10.1111/acel.12325 · Cited by 487
Self-citationReversal of epigenetic aging and immunosenescent trends in humans.
Fahy, G. M., Brooke, R. T., Watson, J. P., Good, Z., Vasanawala, S. S., Maecker, H., Leipold, M. D., Lin, D. T. S., Kobor, M. S., & Horvath, S. (2019) · Aging Cell · doi:10.1111/acel.13028 · Cited by 477
The role of DNA methylation in epigenetics of aging
Unnikrishnan, A., Freeman, W. M., Jackson, J. A., Wren, J. D., Porter, H. L., & Richardson, A. G. (2018) · Pharmacology & Therapeutics · doi:10.1016/j.pharmthera.2018.11.001 · Cited by 394
Li, X., Ploner, A., Wang, Y., Magnusson, P. K., Reynolds, C., Finkel, D., Pedersen, N. L., Jylhävä, J., & Hägg, S. (2020) · eLife · doi:10.7554/elife.51507 · Cited by 390
Continuous Aging of the Human DNA Methylome Throughout the Human Lifespan
Johansson, Å., Enroth, S., & Gyllensten, U. B. (2013) · PLoS ONE · doi:10.1371/journal.pone.0067378 · Cited by 388
Lehne, B., Drong, A. W., Loh, M., Zhang, W., Scott, W. R., Tan, S.-T., Afzal, U., Scott, J., Jarvelin, M.-R., Elliott, P., et al. (2015) · Genome biology · doi:10.1186/s13059-015-0600-x · Cited by 380
Fransquet, P. D., Wrigglesworth, J., Woods, R. L., Ernst, M. E., & Ryan, J. (2019) · Clinical Epigenetics · doi:10.1186/s13148-019-0656-7 · Cited by 369
Court, F., Tayama, C., Romanelli, V., Martín-Trujillo, Á., Iglesias‐Platas, I., Okamura, K., Sugahara, N., Simón, C., Moore, H. D. M., Harness, J. V., et al. (2014) · Genome Research · doi:10.1101/gr.164913.113 · Cited by 365
Decreased epigenetic age of PBMCs from Italian semi-supercentenarians and their offspring
Horvath, S., Pirazzini, C., Bacalini, M. G., Gentilini, D., Di Blasio, A. M., Delledonne, M., Mari, D., Arosio, B., Monti, D., Passarino, G., et al. (2015) · Aging · doi:10.18632/aging.100861 · Cited by 316
Self-citationHeterogeneity in old fibroblasts is linked to variability in reprogramming and wound healing
Mahmoudi, S., Mancini, E., Xu, L., Moore, A., Jahanbani, F., Hebestreit, K., Srinivasan, R., Li, X., Devarajan, K., Prélot, L., et al. (2019) · Nature · doi:10.1038/s41586-019-1658-5 · Cited by 285
Lehne, B. C., Drong, A., Loh, M. C. S., Zhang, W., Scott, W. R., Tan, S.-T., Afzal, U., Schulz, R., Scott, J., Järvelin, M., et al. (2016) · Genome biology · doi:10.1186/s13059-016-0934-z · Cited by 284
Ostan, R., Monti, D., Gueresi, P., Bussolotto, M., Franceschi, C., & Baggio, G. (2016) · Clinical Science · doi:10.1042/cs20160004 · Cited by 270
Self-citationThe landscape of sex-differential transcriptome and its consequent selection in human adults
Gershoni, M., & Pietrokovski, S. (2017) · BMC Biology · doi:10.1186/s12915-017-0352-z · Cited by 268
DNA methylation outliers in normal breast tissue identify field defects that are enriched in cancer
Teschendorff, A. E., Gao, Y., Jones, A., Ruebner, M., Beckmann, M. W., Wachter, D. L., Fasching, P. A., & Widschwendter, M. (2016) · Nature Communications · doi:10.1038/ncomms10478 · Cited by 252
Sex differences in normal age trajectories of functional brain networks
Scheinost, D., Finn, E. S., Tokoglu, F., Shen, X., Papademetris, X., Hampson, M., & Constable, R. T. (2014) · Human Brain Mapping · doi:10.1002/hbm.22720 · Cited by 240
Hernando-Herraez, I., Evano, B., Stubbs, T., Commere, P.-H., Jan Bonder, M., Clark, S., Andrews, S., Tajbakhsh, S., & Reik, W. (2019) · Nature Communications · doi:10.1038/s41467-019-12293-4 · Cited by 236
Characterization of whole-genome autosomal differences of DNA methylation between men and women
Singmann, P., Shem‐Tov, D., Wahl, S., Grallert, H., Fiorito, G., Shin, S.-Y., Schramm, K., Wolf, P., Kunze, S., Baran, Y., et al. (2015) · Epigenetics & Chromatin · doi:10.1186/s13072-015-0035-3 · Cited by 224
Self-citationDoc2 Is a Ca2+ Sensor Required for Asynchronous Neurotransmitter Release
Yao, J., Gaffaney, J. D., Kwon, S. E., & Chapman, E. R. (2011) · Cell · doi:10.1016/j.cell.2011.09.046 · Cited by 218
Slieker, R. C., Relton, C. L., Gaunt, T. R., Slagboom, P. E., & Heijmans, B. T. (2018) · Epigenetics & Chromatin · doi:10.1186/s13072-018-0191-3 · Cited by 207
Sex differences in DNA methylation assessed by 450 K BeadChip in newborns
Yousefi, P., Huen, K., Davé, V., Barcellos, L., Eskenazi, B., & Holland, N. (2015) · BMC Genomics · doi:10.1186/s12864-015-2034-y · Cited by 205
Ren, X., & Kuan, P. F. (2018) · Bioinformatics · doi:10.1093/bioinformatics/bty892 · Cited by 203
Sexually divergent induction of microglial-associated neuroinflammation with hippocampal aging
Mangold, C. A., Wronowski, B., Du, M., Masser, D. R., Hadad, N., Bixler, G. V., Brucklacher, R. M., Ford, M. M., Sonntag, W. E., & Freeman, W. M. (2017) · Journal of Neuroinflammation · doi:10.1186/s12974-017-0920-8 · Cited by 203
Yang, Y., & Kozloski, M. (2011) · The Journals of Gerontology: Series A · doi:10.1093/gerona/glr003 · Cited by 202
Microtubule-severing enzymes: From cellular functions to molecular mechanism
McNally, F. J., & Roll‐Mecak, A. (2018) · The Journal of Cell Biology · doi:10.1083/jcb.201612104 · Cited by 199
Age-Associated Activation of Epigenetically Repressed Genes in the Mouse
Bennett‐Baker, P. E., Wilkowski, J. M., & Burke, D. (2003) · Genetics · doi:10.1093/genetics/165.4.2055 · Cited by 198
DNA methylation dynamics in aging: how far are we from understanding the mechanisms?
Ciccarone, F., Tagliatesta, S., Caiafa, P., & Zampieri, M. (2017) · Mechanisms of Ageing and Development · doi:10.1016/j.mad.2017.12.002 · Cited by 191
Age-related accrual of methylomic variability is linked to fundamental ageing mechanisms
Slieker, R. C., van Iterson, M., Luijk, R., Beekman, M., Zhernakova, D. V., Moed, M. H., Mei, H., van Galen, M., Deelen, P., Bonder, M. J., et al. (2016) · Genome biology · doi:10.1186/s13059-016-1053-6 · Cited by 171
Identification and Application of Gene Expression Signatures Associated with Lifespan Extension
Tyshkovskiy, A., Bozaykut, P., Borodinova, A. A., Gerashchenko, M. V., Ables, G. P., Garratt, M., Khaitovich, P., Clish, C. B., Miller, R. A., & Gladyshev, V. N. (2019) · Cell Metabolism · doi:10.1016/j.cmet.2019.06.018 · Cited by 167
Palli, D., Berrino, F., Vineis, P., Tumino, R., Panico, S., Masala, G., Saieva, C., Salvini, S., Cerati, M., Pala, V. M., et al. (2003) · Tumori Journal · doi:10.1177/030089160308900602 · Cited by 160
An epigenome-wide association study of sex-specific chronological ageing
McCartney, D. L., Zhang, F., Hillary, R. F., Zhang, Q., Stevenson, A. J., Walker, R. M., Bermingham, M. L., Boutin, T., Morris, S. W., Campbell, A., et al. (2020) · Genome Medicine · doi:10.1186/s13073-019-0693-z · Cited by 152
Ochsner, S. A., Abraham, D., Martin, K. A., Ding, W., McOwiti, A., Kankanamge, W. H., Wang, Z., Andreano, K. J., Hamilton, R. A., Chen, Y., et al. (2019) · Scientific Data · doi:10.1038/s41597-019-0193-4 · Cited by 119
Age-dependent changes in mean and variance of gene expression across tissues in a twin cohort
Viñuela, A., Brown, A. A., Buil, A., Tsai, P.-C., Davies, M. N., Bell, J. T., Dermitzakis, E. T., Spector, T. D., & Small, K. S. (2017) · Human Molecular Genetics · doi:10.1093/hmg/ddx424 · Cited by 115
Tajuddin, S. M., Hernandez, D. G., Chen, B. H., Hooten, N. N., Mode, N. A., Nalls, M. A., Singleton, A., Ejiogu, N., Chitrala, K. N., Zonderman, A. B., et al. (2019) · Clinical Epigenetics · doi:10.1186/s13148-019-0722-1 · Cited by 102
Genetics of human longevity within an eco-evolutionary nature-nurture framework
Giuliani, C., Garagnani, P., & Franceschi, C. (2018) · Circulation Research · doi:10.1161/circresaha.118.312562 · Cited by 92
Self-citationEstep, P. W., Warner, J. B., & Bulyk, M. L. (2009) · PLoS ONE · doi:10.1371/journal.pone.0005242 · Cited by 91
Sex Differences in Genetic Associations With Longevity
Zeng, Y., Nie, C., Min, J., Chen, H., Liu, X., Ye, R., Chen, Z., Bai, C., Xie, E., Yin, Z., et al. (2018) · JAMA Network Open · doi:10.1001/jamanetworkopen.2018.1670 · Cited by 91
Self-citationGentilini, D., Garagnani, P., Pisoni, S., Bacalini, M., Calzari, L., Mari, D., Vitale, G., Franceschi, C., & di Blasio, A. D. (2015) · Aging · doi:10.18632/aging.100792 · Cited by 89
Self-citationFu, V. X., Dobosy, J. R., Desotelle, J. A., Almassi, N., Ewald, J. A., Srinivasan, R., Berres, M. E., Svaren, J. P., Weindruch, R. H., & Jarrard, D. F. (2008) · Cancer Research · doi:10.1158/0008-5472.can-08-1714 · Cited by 85
Franceschi, C., Garagnani, P., Gensous, N., Bacalini, M. G., Conte, M., & Salvioli, S. (2019) · Aging Cell · doi:10.1111/acel.12903 · Cited by 82
Self-citationSex differences of leukocytes DNA methylation adjusted for estimated cellular proportions
Inoshita, M., Numata, S., Tajima, A., Kinoshita, M., Umehara, H., Yamamori, H., Hashimoto, R., Imoto, I., & Ohmori, T. (2015) · Biology of Sex Differences · doi:10.1186/s13293-015-0029-7 · Cited by 71
Sexually divergent DNA methylation patterns with hippocampal aging
Masser, D. R., Hadad, N., Porter, H. L., Mangold, C. A., Unnikrishnan, A., Ford, M. M., Giles, C. B., Georgescu, C., Dozmorov, M. G., Wren, J. D., et al. (2017) · Aging Cell · doi:10.1111/acel.12681 · Cited by 70
Cell and tissue type independent age-associated DNA methylation changes are not rare but common
Zhu, T., Zheng, S., Paul, D. S., Horvath, S., & Teschendorff, A. E. (2018) · Aging · doi:10.18632/aging.101666 · Cited by 66
Adjusting for Cell Type Composition in DNA Methylation Data Using a Regression-Based Approach
Jones, M. J., Islam, S. A., Edgar, R. D., & Kobor, M. S. (2015) · Methods in molecular biology · doi:10.1007/7651_2015_262 · Cited by 64
Transcriptional Analysis Reveals Gender-Specific Changes in the Aging of the Human Immune System
Marttila, S., Jylhävä, J., Nevalainen, T., Nykter, M., Jylhä, M. K., Hervonen, A., Tserel, L., Peterson, P., & Hurme, M. (2013) · PLoS ONE · doi:10.1371/journal.pone.0066229 · Cited by 63
Age‐dependent DNA methylation patterns on the Y chromosome in elderly males
Lund, J., Li, S., Christensen, K., Mengel‐From, J., Soerensen, M., Marioni, R. E., Starr, J. M., Pattie, A., Deary, I. J., Baumbach, J., et al. (2019) · Aging Cell · doi:10.1111/acel.12907 · Cited by 43
Li, S., Lund, J., Christensen, K., Baumbach, J., Mengel‐From, J., Kruse, T. A., Li, W., Mohammadnejad, A., Pattie, A., Marioni, R. E., et al. (2020) · Genome Medicine · doi:10.1186/s13073-020-00736-3 · Cited by 42
Epigenetic Clock: Just a Convenient Marker or an Active Driver of Aging?
Ashapkin, V. V., Kutueva, L. I., & Vanyushin, B. F. (2019) · Advances in experimental medicine and biology · doi:10.1007/978-3-030-25650-0_10 · Cited by 41
Pirazzini, C., Giuliani, C., Bacalini, M. G., Boattini, A., Capri, M., Fontanesi, E., Marasco, E., Mantovani, V., Pierini, M., Pini, E., et al. (2012) · Aging · doi:10.18632/aging.100476 · Cited by 39
Self-citationThe methylation of nuclear and mitochondrial DNA in ageing phenotypes and longevity
Bacalini, M. G., D’Aquila, P., Marasco, E., Nardini, C., Montesanto, A., Franceschi, C., Passarino, G., Garagnani, P., & Bellizzi, D. (2017) · Mechanisms of Ageing and Development · doi:10.1016/j.mad.2017.01.006 · Cited by 38
Self-citationEpigenetic signatures of internal migration in Italy
Campanella, G., Polidoro, S., Gaetano, C. D., Fiorito, G., Guarrera, S., Krogh, V., Palli, D., Panico, S., Sacerdote, C., Tumino, R., et al. (2014) · International Journal of Epidemiology · doi:10.1093/ije/dyu198 · Cited by 36
Self-citationCharacterization of lacrimal proline‐rich protein 4 ( PRR 4) in human tear proteome
Perumal, N., Funke, S., Pfeiffer, N., & Grus, F. H. (2014) · PROTEOMICS · doi:10.1002/pmic.201300039 · Cited by 34
Comprehensive longitudinal study of epigenetic mutations in aging
Wang, Y., Karlsson, R., Jylhävä, J., Hedman, Å. K., Almqvist, C., Karlsson, I., Pedersen, N. L., Almgren, M., & Hägg, S. (2019) · Clinical Epigenetics · doi:10.1186/s13148-019-0788-9 · Cited by 29
Seeboth, A., McCartney, D. L., Wang, Y., Hillary, R. F., Stevenson, A. J., Walker, R. M., Campbell, A., Evans, K. L., McIntosh, A. M., Hägg, S., et al. (2020) · Clinical Epigenetics · doi:10.1186/s13148-020-00838-0 · Cited by 21
Gu, X., Li, H., Chen, X., Zhang, X., Mei, F., Jia, M., & Xiong, C. (2019) · Journal of Assisted Reproduction and Genetics · doi:10.1007/s10815-019-01417-w · Cited by 20
Research works printed but not linked: 1
- Weisberg, 1983, Biometrika, 70, 1, 10.2307/2335938 · DOI
Cited by
Sorted by citations
Sex differences in biological aging with a focus on human studies
Hägg, S., & Jylhävä, J. (2021) · eLife · doi:10.7554/elife.63425 · Cited by 442
Inflammation, Aging, and Cardiovascular Disease
Liberale, L., Badimón, L., Montecucco, F., Lüscher, T. F., Libby, P., & Camici, G. G. (2022) · Journal of the American College of Cardiology · doi:10.1016/j.jacc.2021.12.017 · Cited by 481
Mechanisms of sex differences in Alzheimer’s disease
Lopez-Lee, C., Torres, E. R. S., Carling, G., & Gan, L. (2024) · Neuron · doi:10.1016/j.neuron.2024.01.024 · Cited by 376
Making sense of the ageing methylome
Seale, K., Horvath, S., Teschendorff, A., Eynon, N., & Voisin, S. (2022) · Nature Reviews Genetics · doi:10.1038/s41576-022-00477-6 · Cited by 274
Grant, O. A., Wang, Y., Meena Kumari, B., Zabet, N. R., & Schalkwyk, L. C. (2022) · Clinical Epigenetics · doi:10.1186/s13148-022-01279-7 · Cited by 101
Metadata
- Authors
- Yusipov, I., Bacalini, M. G., Kalyakulina, A., Krivonosov, M., Pirazzini, C., Gensous, N., Ravaioli, F., Milazzo, M., Giuliani, C., Vedunova, M., Fiorito, G., Gagliardi, A., Polidoro, S., Garagnani, P., Ivanchenko, M., & Franceschi, C.
- Affiliations
- N. I. Lobachevsky State University of Nizhny Novgorod (RU)
- Istituto delle Scienze Neurologiche di Bologna (IT)
- University of Bologna (IT)
- University of Oxford (GB)
- University of Sassari (IT)
- Italian institute for Genomic Medicine (IT)
- Karolinska University Hospital (SE)
- Corresponding author
- Bacalini, Maria Giulia
- ORCID
- Venue
- Aging
- Publisher
- Impact Journals, LLC
- Published
- 2020-12-03
- Volume
- 12
- Issue
- 23
- Pages
- 24057-24080
- ISSN
- 1945-4589 (ISSN-L)
- PMC
- PMC7762479
- OpenAlex
- W3108393015
- Cited by
- 148
- References
- 69
- Citations by year
- 2026: 13 · 2025: 27 · 2024: 37 · 2023: 19 · 2022: 41 · 2021: 11
- FWCI
- 1.84
- Type
- journal article
- Language
- en
- Open access
- green
- doi.org
- Locations
- Aging (publishedVersion)
- bioRxiv (Cold Spring Harbor Laboratory) (acceptedVersion)
- Europe PMC (PubMed Central) (publishedVersion, cc-by)
- PubMed Central (publishedVersion, cc-by)
- PubMed (publishedVersion)
- Archivio istituzionale della ricerca (Alma Mater Studiorum Università di Bologna) (submittedVersion, cc-by)
- UnissResearch (Università degli Studi di Sassari) (submittedVersion)
- Funders
- EU Joint Programme – Neurodegenerative Disease Research
- European Commission (H2020, 634821)
- Ministry of Education and Science of the Russian Federation (075-15-2019-871)
- Horizon 2020 Framework Programme (634821)
- Topics
- Life Sciences › Biochemistry, Genetics and Molecular Biology › Molecular Biology › Epigenetics and DNA Methylation
- Life Sciences › Biochemistry, Genetics and Molecular Biology › Aging › Genetics, Aging, and Longevity in Model Organisms
- Life Sciences › Biochemistry, Genetics and Molecular Biology › Genetics › Genetic Syndromes and Imprinting
- Keywords
- DNA methylation, sex differences, epigenetics, centenarians, Down syndrome, epimutations, longevity, age-related diseases
- MeSH terms
- ATPases Associated with Diverse Cellular Activities, Adolescent, Adult, Age Factors, Aged, Aged, 80 and over, Aging, Down Syndrome, Female, Humans, Longevity, Male, Microtubule-Associated Proteins, Middle Aged, Sex Factors, CpG Islands, DNA Methylation, Databases, Genetic, Epigenesis, Genetic, Proline-Rich Protein Domains, Young Adult
About these checks
Registry, retraction, Cites and statistics results are computed, not judged, with one exception: a printed reference that no index lists is read once by a model before it counts as a citation error. Claims are extracted by a model and kept only when their quote appears verbatim in the text; each cited source is then checked, with a model’s help, for whether it says what the claim relies on. Those verdicts can be wrong — read the claim’s quote and the cited source before relying on one.
Statistics and arithmetic are recomputed, not judged.
Confidence bands are shown only for fields calibrated on our annotated test set. None is calibrated yet, so no band is shown.
What counts as a claim ›How we measure confidence ›How we check this ›
Are you an author, or do you see a problem with this page? Request a review
