

The DOI matches its Crossref record; 8 of the 8 references it cites were found in a registry or an index.
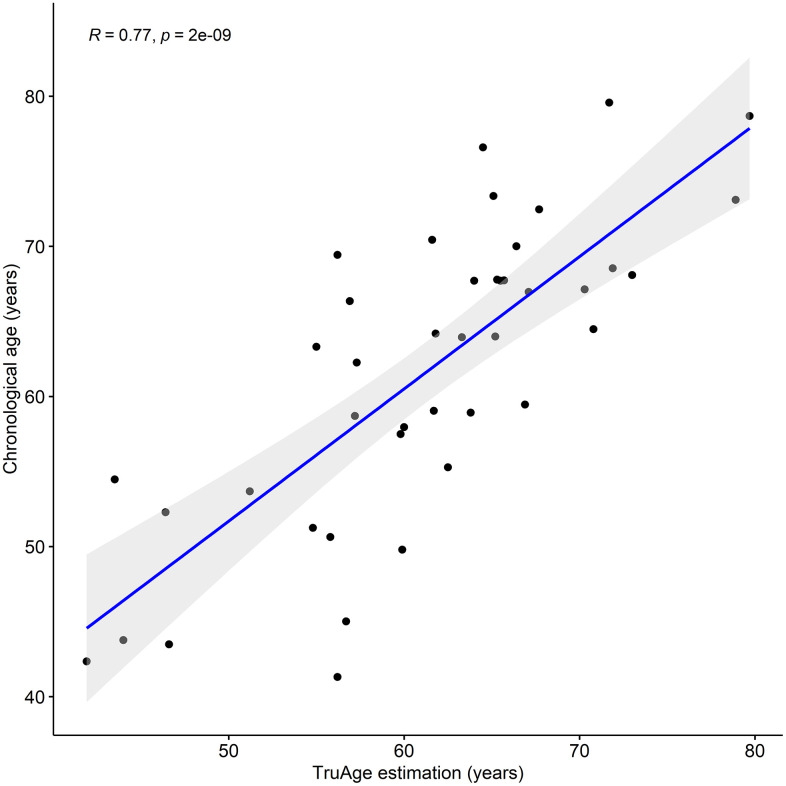
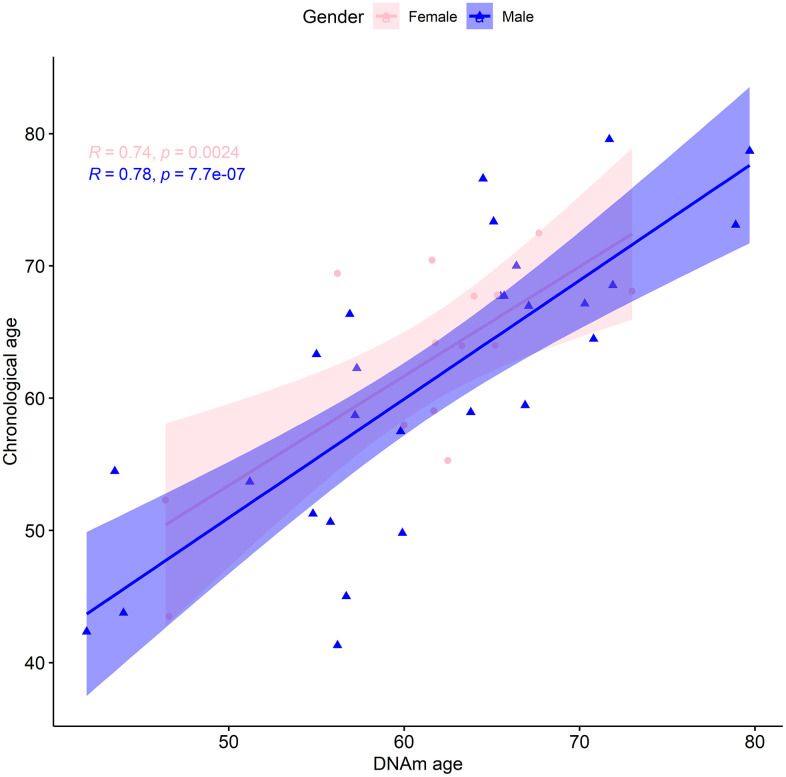
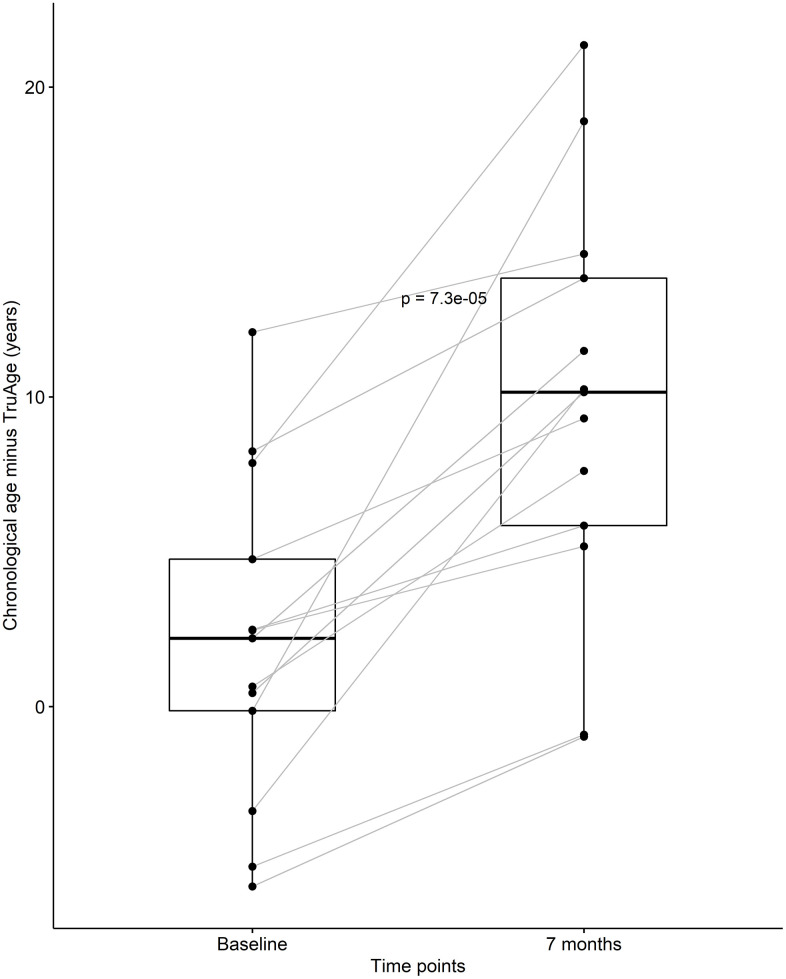
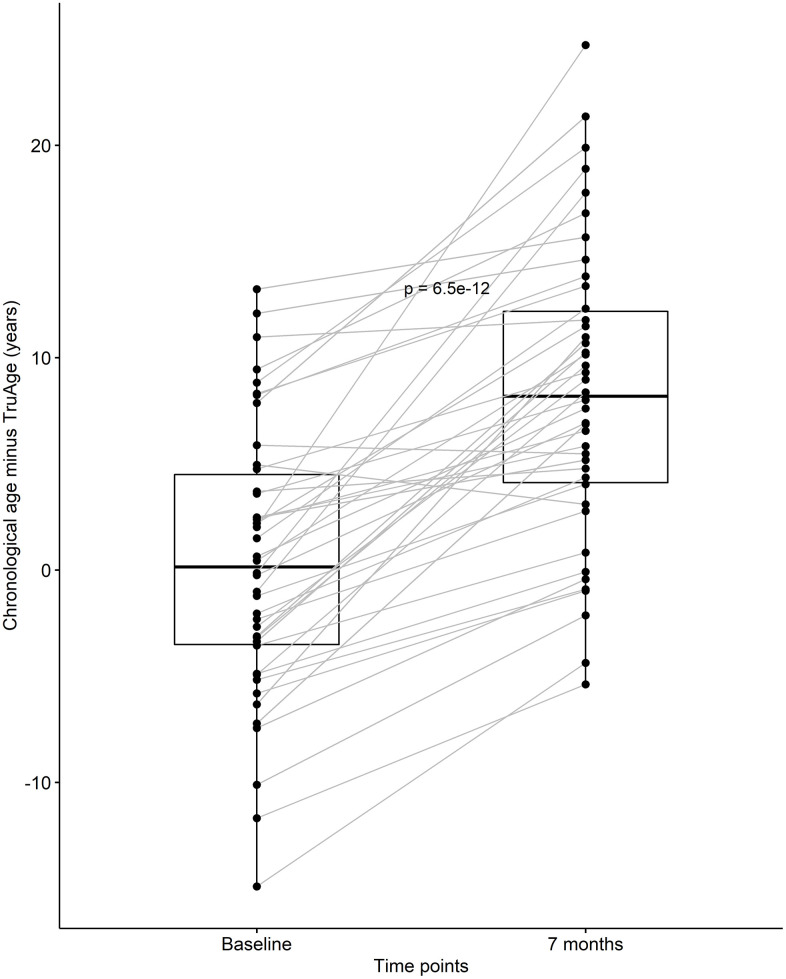
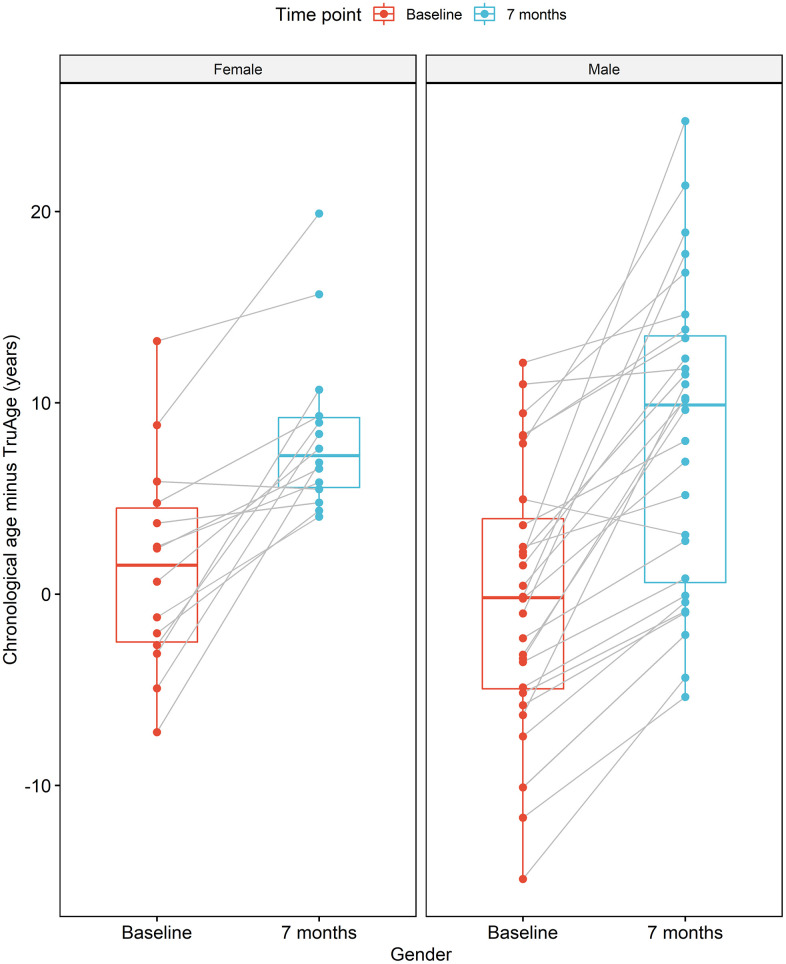
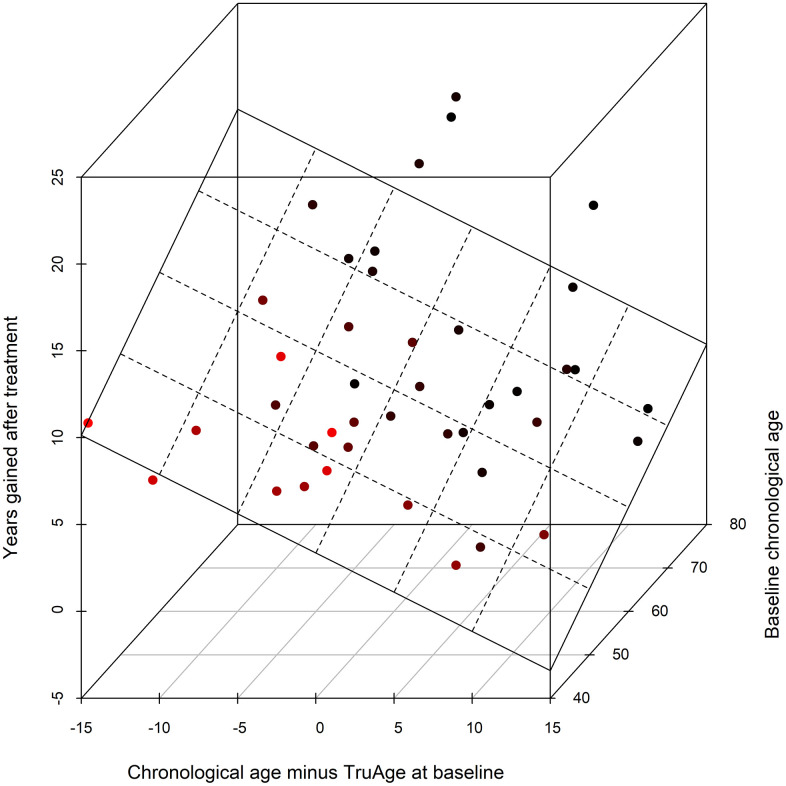
Rejuvant®, a potential life-extending compound formulation with alpha-ketoglutarate and vitamins, conferred an average 8 year reduction in biological aging, after an average of 7 months of use, in the TruAge DNA methylation test
Overview
The claims and statistics of this paper haven’t been checked yet.
Run the check — free, no account needed. It reads the open-access text and checks the sources it cites.
Integrity signals
Registry
Cites
Statistics
Figures
Verification
Claims the paper makes
The claims and statistics of this paper haven’t been checked yet.
Run the check — free, no account needed. It reads the open-access text and checks the sources it cites.
Claims other papers make about this one
Each is checked against this paper’s own text: does it say what the citing paper says it does?
The source backs part of the claim, not all of it — or backs it for a different population, condition or comparison.
In the citing paper
“Likewise, α -ketoglutarate supplementation for 7 months turned back the epigenetic clock by 8 years 51 .”
From Hallmarks of aging: An expanding universe (2023) · cites this paper as [51]
Experimental — accuracy not yet measured
Self-check
Percentages, sums and reported differences re-computed from the paper’s own numbers.
The self-check needs the paper’s full text.
Citations
Cites
López-Otín, C., Blasco, M. A., Partridge, L., Serrano, M., & Kroemer, G. (2013) · Cell · doi:10.1016/j.cell.2013.05.039 · Cited by 14,982
DNA methylation age of human tissues and cell types
Horvath, S. (2013) · Genome Biology · doi:10.1186/gb-2013-14-10-r115 · Cited by 7,075
Geroscience: Linking Aging to Chronic Disease
Kennedy, B. K., Berger, S. L., Brunet, A., Campisi, J., Cuervo, A. M., Epel, E. S., Franceschi, C., Lithgow, G. J., Morimoto, R. I., Pessin, J. E., et al. (2014) · Cell · doi:10.1016/j.cell.2014.10.039 · Cited by 2,764
Self-citationBocklandt, S., Lin, W., Sehl, M. E., Sánchez, F. J., Sinsheimer, J. S., Horvath, S., & Vilain, E. (2011) · PLoS ONE · doi:10.1371/journal.pone.0014821 · Cited by 1,012
Zannas, A. S., Arloth, J., Carrillo-Roa, T., Iurato, S., Röh, S., Ressler, K. J., Nemeroff, C. B., Smith, A. K., Bradley, B., Heim, C., et al. (2015) · Genome Biology · doi:10.1186/s13059-015-0828-5 · Cited by 469
Levine, M. E., Lu, A. T., Bennett, D. A., & Horvath, S. (2015) · Aging · doi:10.18632/aging.100864 · Cited by 455
Pyrkov, T. V., Avchaciov, K., Tarkhov, A. E., Menshikov, L. I., Gudkov, A. V., & Fedichev, P. O. (2021) · Nature Communications · doi:10.1038/s41467-021-23014-1 · Cited by 139
Drugs that modulate aging: the promising yet difficult path ahead
Kennedy, B. K., & Pennypacker, J. K. (2014) · Translational research · doi:10.1016/j.trsl.2013.11.007 · Cited by 127
Self-citation
Research works printed but not linked: 25
- Franzke, 2016, Biomarkers of Aging: From Function to Molecular Biology., Nutrients, 8, 338, 10.3390/nu8060338 · DOI
- Kuchel, 2018, A framework for selection of blood-based biomarkers for geroscience-guided clinical trials: report from the TAME Biomarkers Workgroup., Geroscience, 4, 419, 10.1007/s11357-018-0042-y · DOI · Paper page
- Kennedy, 2020, Aging Biomarkers: From Functional Tests to Multi-Omics Approaches., Proteomics, 2, e1900408, 10.1002/pmic.201900408 · DOI
- Heard, 2019, Advances in epigenetics link genetics to the environment and disease., Nature, 57, 489, 10.1038/s41586-019-1411-0 · DOI · Paper page
- Richardson, 2019, The role of DNA methylation in epigenetics of aging., Pharmacol Ther, 19, 172, 10.1016/j.pharmthera.2018.11.001 · DOI
- Rajapakse, 2013, Genome-wide methylation profiles reveal quantitative views of human aging rates., Mol Cell, 4, 359, 10.1016/j.molcel.2012.10.016 · DOI · Paper page
- Robertson, 2011, DNA methylation: superior or subordinate in the epigenetic hierarchy?, Genes Cancer, 2, 607, 10.1177/1947601910393957 · DOI
- Beck, 2013, Age-associated epigenetic drift: implications, and a case of epigenetic thrift?, Hum Mol Genet, 2, R7, 10.1093/hmg/ddt375 · DOI
- Brenner, 2016, Frailty is associated with the epigenetic clock but not with telomere length in a German cohort., Clin Epigenetics, 8, 21, 10.1186/s13148-016-0186-5 · DOI
- Murphy, 2015, The epigenetic clock is correlated with physical and cognitive fitness in the Lothian Birth Cohort 1936., Int J Epidemiol, 4, 1388, 10.1093/ije/dyu277 · DOI
- Sipos, 2014, Obesity accelerates epigenetic aging of human liver., Proc Natl Acad Sci USA, 11, 15538, 10.1073/pnas.1412759111 · DOI
- Franceschi, 2015, Accelerated epigenetic aging in Down syndrome., Aging Cell, 1, 491, 10.1111/acel.12325 · DOI
- Pinti, 2017, Basic science and pathogenesis of ageing with HIV: potential mechanisms and biomarkers., AIDS, 3, S105, 10.1097/QAD.0000000000001441 · DOI
- Ritz, 2015, Increased epigenetic age and granulocyte counts in the blood of Parkinson’s disease patients., Aging (Albany NY), 7, 1130, 10.18632/aging.100859 · DOI
- Overvad, 2017, DNA methylome analysis identifies accelerated epigenetic ageing associated with postmenopausal breast cancer susceptibility., Eur J Cancer, 7, 299, 10.1016/j.ejca.2017.01.014 · DOI
- Bhaumik, 2020, Alpha-Ketoglutarate, an Endogenous Metabolite, Extends Lifespan and Compresses Morbidity in Aging Mice., Cell Metab, 3, 447, 10.1016/j.cmet.2020.08.004 · DOI
- Yin, 2016, The glutamine-alpha-ketoglutarate (AKG) metabolism and its nutritional implications., Amino Acids, 4, 2067, 10.1007/s00726-016-2254-8 · DOI
- Li, 2016, Alpha-Ketoglutarate: Physiological Functions and Applications., Biomol Ther (Seoul), 2, 1, 10.4062/biomolther.2015.078 · DOI · Paper page
- Kandefer-Szerszeń, 2017, Alpha-Ketoglutarate as a Molecule with Pleiotropic Activity: Well-Known and Novel Possibilities of Therapeutic Use., Arch Immunol Ther Exp (Warsz), 6, 21, 10.1007/s00005-016-0406-x · DOI · Paper page
- Pierzynowski, 2008, Biological effects of 2-oxoglutarate with particular emphasis on the regulation of protein, mineral and lipid absorption/metabolism, muscle performance, kidney function, bone formation and cancerogenesis, all viewed from a healthy ageing perspective state of the art--review article., J Physiol Pharmacol, 5, 91
- Wang, 2014, The metabolite α-ketoglutarate extends lifespan by inhibiting ATP synthase and TOR., Nature, 51, 397, 10.1038/nature13264 · DOI
- Kennedy, 2014, Mouse models and aging: longevity and progeria., Curr Top Dev Biol, 10, 249, 10.1016/B978-0-12-397920-9.00003-2 · DOI
- Kaarniranta, 2014, Krebs cycle intermediates regulate DNA and histone methylation: epigenetic impact on the aging process., Ageing Res Rev, 1, 45, 10.1016/j.arr.2014.05.004 · DOI
- Runyon, 1977, Nonparametric statistics: a contemporary approach.
- Maechler, 2003, scatterplot3d - An R Package for Visualizing Multivariate Data., J Stat Softw, 8, 1, 10.18637/jss.v008.i11 · DOI
Cited by
Sorted by citations
Hallmarks of aging: An expanding universe
López-Otín, C., Blasco, M. A., Partridge, L., Serrano, M., & Kroemer, G. (2023) · Cell · doi:10.1016/j.cell.2022.11.001 · Cited by 6,549
Meta-hallmarks of aging and cancer
López-Otín, C., Pietrocola, F., Roiz-Valle, D., Galluzzi, L., & Kroemer, G. (2023) · Cell Metabolism · doi:10.1016/j.cmet.2022.11.001 · Cited by 529
Making sense of the ageing methylome
Seale, K., Horvath, S., Teschendorff, A., Eynon, N., & Voisin, S. (2022) · Nature Reviews Genetics · doi:10.1038/s41576-022-00477-6 · Cited by 274
The Information Theory of Aging
Lu, Y. R., Tian, X., & Sinclair, D. A. (2023) · Nature Aging · doi:10.1038/s43587-023-00527-6 · Cited by 141
Metadata
- Authors
- Demidenko, O., Barardo, D., Budovskii, V., Finnemore, R., Palmer, F. R., Kennedy, B. K., & Budovskaya, Y. V.
- Affiliations
- TruMe Inc., Alameda, CA 94502, USA
- Healthy Longevity Translational Research Programme, Yong Loo Lin School of Medicine, National University Singapore, Singapore 117456, Singapore
- Ponce de Leon Health, Fernandina, FL 32034, USA
- Venue
- Aging
- Publisher
- Impact Journals, LLC
- Published
- 2021-11-30
- Volume
- 13
- Issue
- 22
- Pages
- 24485-24499
- ISSN
- 1945-4589
- PMC
- PMC8660611
- Cited by
- 80
- References
- 8
- Language
- en
About these checks
Registry, retraction, Cites and statistics results are computed, not judged, with one exception: a printed reference that no index lists is read once by a model before it counts as a citation error. Claims are extracted by a model and kept only when their quote appears verbatim in the text; each cited source is then checked, with a model’s help, for whether it says what the claim relies on. Those verdicts can be wrong — read the claim’s quote and the cited source before relying on one.
Statistics and arithmetic are recomputed, not judged.
Confidence bands are shown only for fields calibrated on our annotated test set. None is calibrated yet, so no band is shown.
What counts as a claim ›How we measure confidence ›How we check this ›
Are you an author, or do you see a problem with this page? Request a review
