

The DOI matches its Crossref record; 10 of the 10 references it cites were found in a registry or an index.
Atg7- and Keap1-dependent autophagy protects breast cancer cell lines against mitoquinone-induced oxidative stress
Overview
The claims and statistics of this paper haven’t been checked yet.
Run the check — free, no account needed. It reads the open-access text and checks the sources it cites.
Integrity signals
Registry
Cites
Statistics
Figures
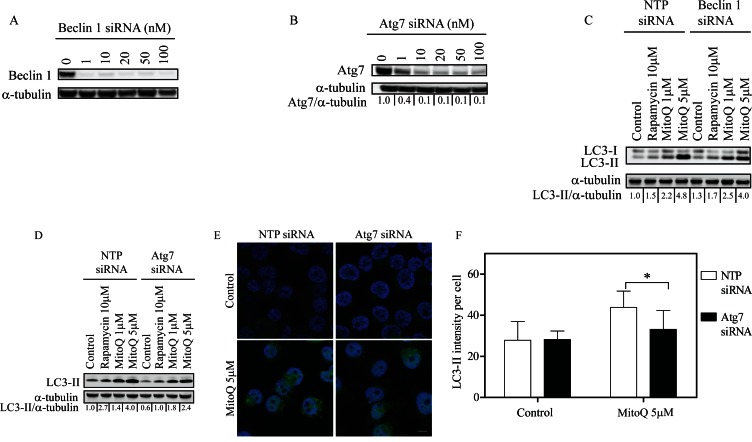
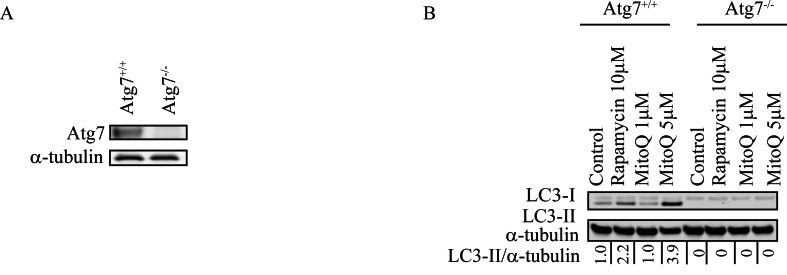
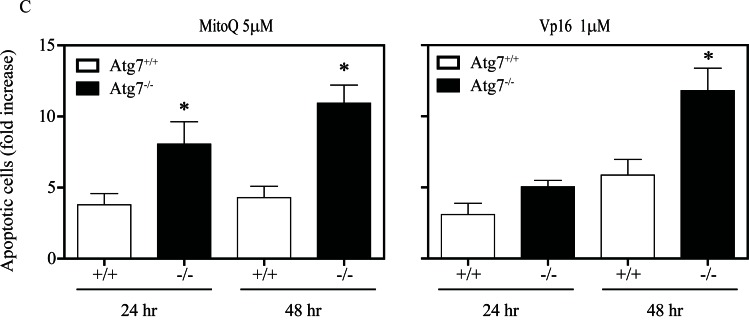
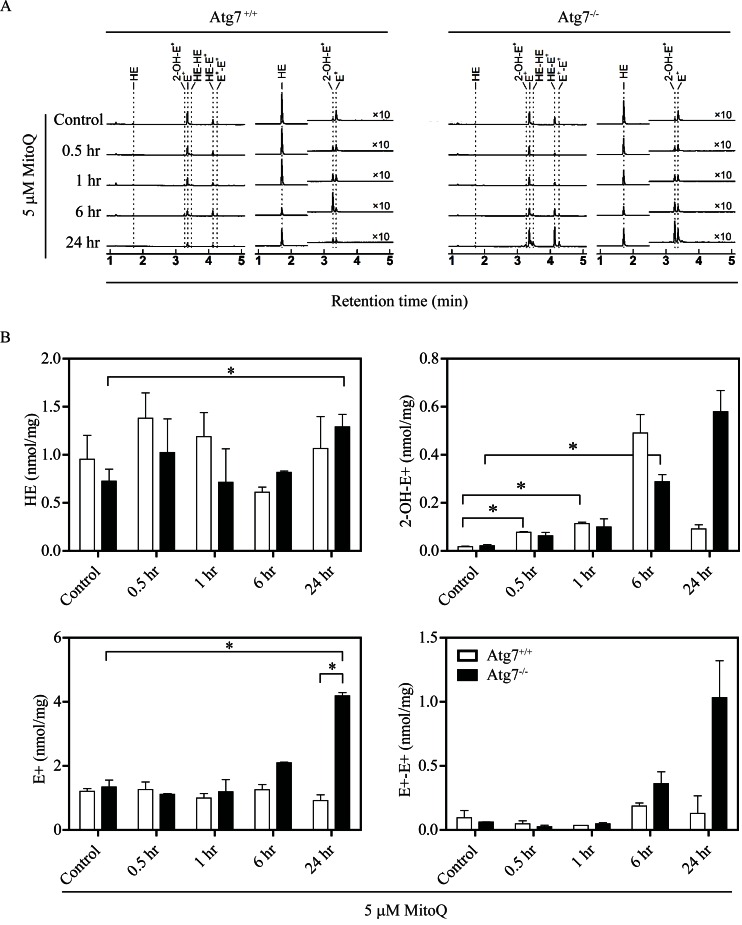
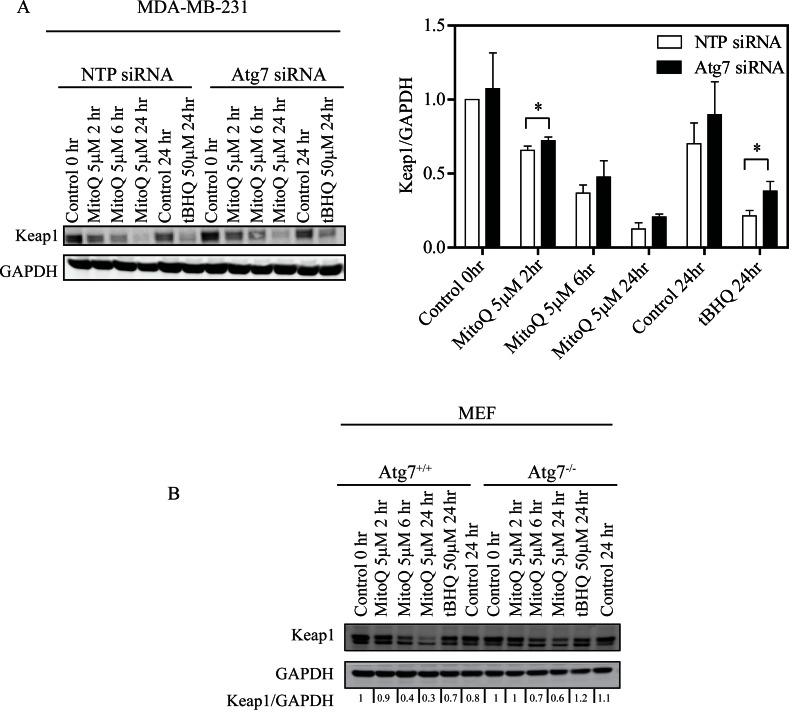
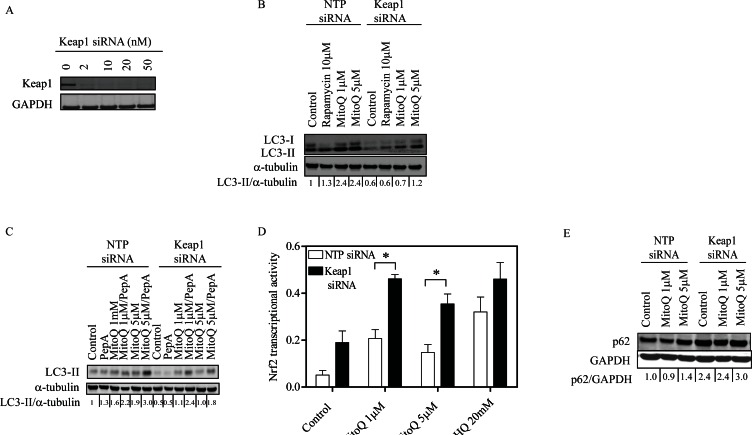
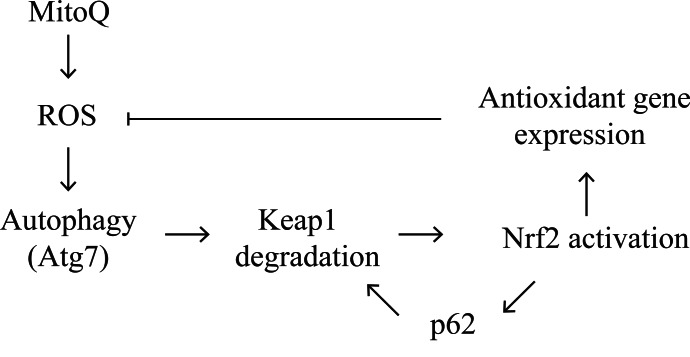
Verification
Claims the paper makes
The claims and statistics of this paper haven’t been checked yet.
Run the check — free, no account needed. It reads the open-access text and checks the sources it cites.
Claims other papers make about this one
Each is checked against this paper’s own text: does it say what the citing paper says it does?
The source backs part of the claim, not all of it — or backs it for a different population, condition or comparison.
In the citing paper
“Indeed, there is a reciprocal crosstalk between the UPS and autophagy, with SQSTM1 being a key link between them [595,596].”
From Guidelines for the use and interpretation of assays for monitoring autophagy (4th edition) 1 (2021) · cites this paper as [595]
Experimental — accuracy not yet measured
Self-check
Percentages, sums and reported differences re-computed from the paper’s own numbers.
The self-check needs the paper’s full text.
Citations
Cites
Guidelines for the use and interpretation of assays for monitoring autophagy (3rd edition).
Klionsky, D. J., Abdelmohsen, K., Abe, A., Abedin, M. J., Abeliovich, H., Acevedo Arozena, A., Adachi, H., Adams, C. M., Adams, P. D., Adeli, K., et al. (2016) · Autophagy · doi:10.1080/15548627.2015.1100356 · Cited by 5,894
Self-citationGuidelines for the use and interpretation of assays for monitoring autophagy
Klionsky, D. J., Abdalla, F. C., Abeliovich, H., Abraham, R. T., Acevedo-Arozena, A., Adeli, K., Agholme, L., Agnello, M., Agostinis, P., Aguirre-Ghiso, J. A., et al. (2012) · Autophagy · doi:10.4161/auto.19496 · Cited by 3,996 · cited 5×
“MitoQ was synthesized as described previously [23]. tert-Butylhydroquinone (tBHQ), Etoposide (Vp-16), Rapamycin, Pepstatin A, and E64d were purchased from Sigma-Aldrich (St. Louis, MO).”
InfluentialSelf-citationYue, Z., Jin, S., Yang, C., Levine, A. J., & Heintz, N. (2003) · Proceedings of the National Academy of Sciences · doi:10.1073/pnas.2436255100 · Cited by 2,116
Reactive oxygen species are essential for autophagy and specifically regulate the activity of Atg4
Scherz‐Shouval, R., Shvets, E., Fass, E., Shorer, H., Gil, L., & Elazar, Z. (2007) · The EMBO Journal · doi:10.1038/sj.emboj.7601623 · Cited by 2,101 · cited 1×
“Previous studies have shown that ROS stimulates autophagy by modifying autophagy related proteins [40, 41].”
BackgroundJain, A., Lamark, T., Sjøttem, E., Bowitz Larsen, K., Atesoh Awuh, J., Øvervatn, A., McMahon, M., Hayes, J. D., & Johansen, T. (2010) · Journal of Biological Chemistry · doi:10.1074/jbc.m110.118976 · Cited by 1,472
Autophagy, mitochondria and oxidative stress: cross-talk and redox signalling.
Lee, J., Giordano, S., & Zhang, J. (2012) · Biochemical Journal · doi:10.1042/bj20111451 · Cited by 1,438
Selective Targeting of a Redox-active Ubiquinone to Mitochondria within Cells
Kelso, G. F., Porteous, C. M., Coulter, C. V., Hughes, G., Porteous, W. K., Ledgerwood, E. C., Smith, R. A. J., & Murphy, M. P. (2001) · Journal of Biological Chemistry · doi:10.1074/jbc.m009093200 · Cited by 1,091
Mitochondrial Redox Cycling of Mitoquinone Leads to Superoxide Production and Cellular Apoptosis
Doughan, A. K., & Dikalov, S. I. (2007) · Antioxidants & Redox Signaling · doi:10.1089/ars.2007.1693 · Cited by 172
Rao, V. A., Klein, S. R., Bonar, S. J., Zielonka, J., Mizuno, N., Dickey, J. S., Keller, P. W., Joseph, J., Kalyanaraman, B., & Shacter, E. (2010) · Journal of Biological Chemistry · doi:10.1074/jbc.m110.133579 · Cited by 139
Self-citationAlternative Macroautophagic Pathways
Juenemann, K., & Reits, E. A. (2012) · International Journal of Cell Biology · doi:10.1155/2012/189794 · Cited by 58
Research works printed but not linked: 34
- Gibson, 2012, Reactive oxygen species regulation of autophagy in cancer: implications for cancer treatment, Free Radic Biol Med, 53, 1399, 10.1016/j.freeradbiomed.2012.07.011 · DOI
- Kimmelman, 2011, The dynamic nature of autophagy in cancer, Genes Dev, 25, 1999, 10.1101/gad.17558811 · DOI
- White, 2011, Principles and current strategies for targeting autophagy for cancer treatment, Clin Cancer Res, 17, 654, 10.1158/1078-0432.CCR-10-2634 · DOI
- Schulman, 2011, Atg8 transfer from Atg7 to Atg3: a distinctive E1-E2 architecture and mechanism in the autophagy pathway, Mol Cell, 44, 451, 10.1016/j.molcel.2011.08.034 · DOI
- Stenmark, 2012, p62 at the interface of autophagy, oxidative stress signaling, and cancer, Antioxid Redox Signal, 17, 786, 10.1089/ars.2011.4394 · DOI
- Johansen, 2007, p62/SQSTM1 binds directly to Atg8/LC3 to facilitate degradation of ubiquitinated protein aggregates by autophagy, The Journal of biological chemistry, 282, 24131, 10.1074/jbc.M702824200 · DOI · Paper page
- Johansen, 2005, p62/SQSTM1 forms protein aggregates degraded by autophagy and has a protective effect on huntingtin-induced cell death, J Cell Biol, 171, 603, 10.1083/jcb.200507002 · DOI · Paper page
- Yamamoto, 2011, Molecular mechanisms of the Keap1-Nrf2 pathway in stress response and cancer evolution, Genes Cells, 16, 123, 10.1111/j.1365-2443.2010.01473.x · DOI · Paper page
- Kominami, 2010, The selective autophagy substrate p62 activates the stress responsive transcription factor Nrf2 through inactivation of Keap1, Nat Cell Biol, 12, 213, 10.1038/ncb2021 · DOI · Paper page
- McMahon, 2009, NRF2 and KEAP1 mutations: permanent activation of an adaptive response in cancer, Trends Biochem Sci, 34, 176, 10.1016/j.tibs.2008.12.008 · DOI
- Diaz-Meco, 2009, p62 at the crossroads of autophagy, apoptosis, and cancer, Cell, 137, 1001, 10.1016/j.cell.2009.05.023 · DOI · Paper page
- Komatsu, 2011, Persistent activation of Nrf2 through p62 in hepatocellular carcinoma cells, J Cell Biol, 193, 275, 10.1083/jcb.201102031 · DOI
- Ichimura, 2012, p62/SQSTM1/A170: physiology and pathology, Pharmacol Res, 66, 457, 10.1016/j.phrs.2012.07.004 · DOI
- Lee, 2013, Phosphorylation of p62 activates the Keap1-Nrf2 pathway during selective autophagy, Mol Cell, 51, 618, 10.1016/j.molcel.2013.08.003 · DOI
- Garcia-Manero, 2013, Oncogenic functions of the transcription factor Nrf2, Free radical biology & medicine
- Zhong, 2010, Keap1 facilitates p62-mediated ubiquitin aggregate clearance via autophagy, Autophagy, 6, 614, 10.4161/auto.6.5.12189 · DOI · Paper page
- Zhu, 2012, Hydrogen sulfide as an endogenous modulator in mitochondria and mitochondria dysfunction, Oxid Med Cell Longev, 2012, 878052
- Rhee, 2013, Sestrins activate Nrf2 by promoting p62-dependent autophagic degradation of Keap1 and prevent oxidative liver damage, Cell metabolism, 17, 73, 10.1016/j.cmet.2012.12.002 · DOI · Paper page
- Murphy, 1997, Selective targeting of bioactive compounds to mitochondria, Trends Biotechnol, 15, 326, 10.1016/S0167-7799(97)01068-8 · DOI · Paper page
- Kalyanaraman, 2012, Mitochondria-targeted drugs synergize with 2-deoxyglucose to trigger breast cancer cell death, Cancer Res, 72, 2634, 10.1158/0008-5472.CAN-11-3928 · DOI
- Srinivasula, 2011, Nrf2-mediated induction of p62 controls Toll-like receptor-4-driven aggresome-like induced structure formation and autophagic degradation, Proceedings of the National Academy of Sciences of the United States of America, 108, 1427, 10.1073/pnas.1014156108 · DOI
- Codogno, 2010, Autophagy in health and disease. 1. Regulation and significance of autophagy: an overview, Am J Physiol Cell Physiol, 298, C776, 10.1152/ajpcell.00507.2009 · DOI
- Yamamoto, 2012, Keap1 degradation by autophagy for the maintenance of redox homeostasis, Proceedings of the National Academy of Sciences of the United States of America, 109, 13561, 10.1073/pnas.1121572109 · DOI · Paper page
- Ghidoni, 2008, Role of non-canonical Beclin 1-independent autophagy in cell death induced by resveratrol in human breast cancer cells, Cell Death Differ, 15, 1318, 10.1038/cdd.2008.51 · DOI · Paper page
- Puyal, 2011, Beclin 1-independent autophagy contributes to apoptosis in cortical neurons, Autophagy, 7, 1115, 10.4161/auto.7.10.16608 · DOI
- Nanjundan, 2010, Arsenic trioxide induces a beclin-1-independent autophagic pathway via modulation of SnoN/SkiL expression in ovarian carcinoma cells, Cell Death Differ, 17, 1867, 10.1038/cdd.2010.53 · DOI
- Proikas-Cezanne, 2012, Canonical and non-canonical autophagy: variations on a common theme of self-eating?, Nat Rev Mol Cell Biol, 13, 7, 10.1038/nrm3249 · DOI
- He, 2009, Autophagy is essential for mitochondrial clearance in mature T lymphocytes, Journal of immunology, 182, 4046, 10.4049/jimmunol.0801143 · DOI
- Finkel, 2009, Mitochondrial dysfunction and oxidative stress mediate the physiological impairment induced by the disruption of autophagy, Aging, 1, 425, 10.18632/aging.100038 · DOI
- Zhang, 2010, A noncanonical mechanism of Nrf2 activation by autophagy deficiency: direct interaction between Keap1 and p62, Mol Cell Biol, 30, 3275, 10.1128/MCB.00248-10 · DOI
- Shin, 2012, Assurance of mitochondrial integrity and mammalian longevity by the p62-Keap1-Nrf2-Nqo1 cascade, EMBO Rep, 13, 150, 10.1038/embor.2011.246 · DOI
- Hannink, 2005, Ubiquitination of Keap1, a BTB-Kelch substrate adaptor protein for Cul3, targets Keap1 for degradation by a proteasome-independent pathway, The Journal of biological chemistry, 280, 30091, 10.1074/jbc.M501279200 · DOI
- Kalyanaraman, 2008, Detection of 2-hydroxyethidium in cellular systems: a unique marker product of superoxide and hydroethidine, Nat Protoc, 3, 8, 10.1038/nprot.2007.473 · DOI
- Kalyanaraman, 2012, Global profiling of reactive oxygen and nitrogen species in biological systems: high-throughput real-time analyses, The Journal of biological chemistry, 287, 2984, 10.1074/jbc.M111.309062 · DOI
Cited by
Sorted by citations
Guidelines for the use and interpretation of assays for monitoring autophagy (3rd edition).
Klionsky, D. J., Abdelmohsen, K., Abe, A., Abedin, M. J., Abeliovich, H., Acevedo Arozena, A., Adachi, H., Adams, C. M., Adams, P. D., Adeli, K., et al. (2016) · Autophagy · doi:10.1080/15548627.2015.1100356 · Cited by 5,894
Self-citationGuidelines for the use and interpretation of assays for monitoring autophagy (4th edition) 1
Klionsky, D. J., Abdel-Aziz, A. K., Abdelfatah, S., Abdellatif, M., Abdoli, A., Abel, S., Abeliovich, H., Abildgaard, M. H., Abudu, Y. P., Acevedo-Arozena, A., et al. (2021) · Autophagy · doi:10.1080/15548627.2020.1797280 · Cited by 2,897
Interplay between ROS and autophagy in cancer cells, from tumor initiation to cancer therapy
Poillet-Perez, L., Despouy, G., Delage-Mourroux, R., & Boyer-Guittaut, M. (2015) · Redox Biology · doi:10.1016/j.redox.2014.12.003 · Cited by 503
Metadata
- Authors
- Gonzalez, Y., Aryal, B., Chehab, L., & Rao, V. A.
- Venue
- Oncotarget
- Publisher
- Impact Journals, LLC
- Published
- 2014-03-12
- Volume
- 5
- Issue
- 6
- Pages
- 1526-1537
- ISSN
- 1949-2553
- PMC
- PMC4039229
- Cited by
- 60
- References
- 10
- Language
- en
About these checks
Registry, retraction, Cites and statistics results are computed, not judged, with one exception: a printed reference that no index lists is read once by a model before it counts as a citation error. Claims are extracted by a model and kept only when their quote appears verbatim in the text; each cited source is then checked, with a model’s help, for whether it says what the claim relies on. Those verdicts can be wrong — read the claim’s quote and the cited source before relying on one.
Statistics and arithmetic are recomputed, not judged.
Confidence bands are shown only for fields calibrated on our annotated test set. None is calibrated yet, so no band is shown.
What counts as a claim ›How we measure confidence ›How we check this ›
Are you an author, or do you see a problem with this page? Request a review
