Cited by 21

The DOI matches its Crossref record; 5 of the 5 references it cites were found in a registry or an index.

cAMP-mediated autophagy inhibits DNA damage-induced death of leukemia cells independent of p53

Skah, Seham, Richartz, Nina, Duthil, Eva, Gilljam, Karin M., Bindesbøll, Christian, Naderi, Elin Hallan, Eriksen, Agnete B., Ruud, Ellen, Dirdal, Marta M., Simonsen, Anne, Blomhoff, Heidi Kiil·2018·Oncotarget

Overview

The claims and statistics of this paper haven’t been checked yet.

Run the check — free, no account needed. It reads the open-access text and checks the sources it cites.

A few free checks a day · papers already verified open instantly · results are public

Integrity signals

Registry

Crossref · 10.18632/oncotarget.25758

Cites

5 of 5 references verified0 citation errors · 0 not checkable

Statistics

Figures

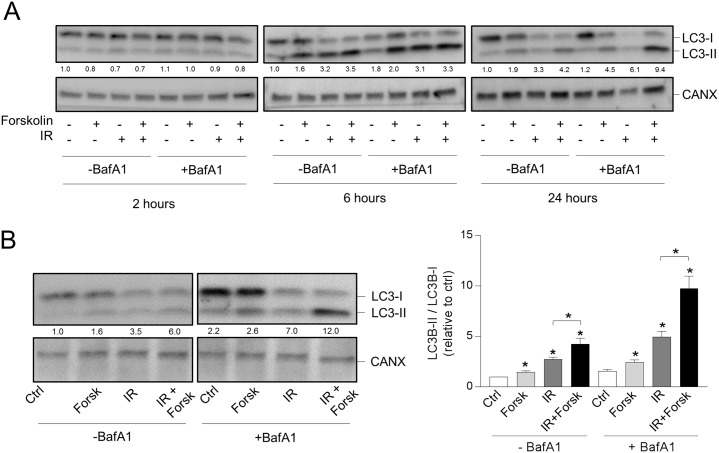
Figure 1 cAMP signaling enhances the DNA damage-induced LC3-II/LC3-I ratio (A and B) REH cells (0.6×10⁶ cells/ml) were incubated in the presence or absence of forskolin (Forsk, 60 μM) for 45 min prior to irradiation (IR, 10Gy), and total lysates were subjected to immunoblot analyses with antibodies against LC3B or calnexin (CANX). The numbers indicated below the LC3 images represent the LC3-II/LC3-I signal ratios relative to the CANX signals, normalized to the ratio in untreated (Ctrl) cells. (A) When indicated, BafA1 (2 nM) was added from the start of the cultures. The cells were harvested at the indicated time points after IR, and one representative Western blot of three is shown. (B) Left panel: The cells were harvested 24 hours after IR, and BafA1 (2 nM) was added for the last 4 hours, as indicated. One representative Western blot of 8 is shown. Right panel: Ratios of the LC3-II/LC3-I signal intensities relative to the CANX signals, normalized to ratio in untreated (Ctrl) cells. The data represent the mean +/- SEM, n=8. *p< 0.05 (paired t test).
Figure 1 cAMP signaling enhances the DNA damage-induced LC3-II/LC3-I ratio (A and B) REH cells (0.6×10⁶ cells/ml) were incubated in the presence or absence of forskolin (Forsk, 60 μM) for 45 min prior to irradiation (IR, 10Gy), and total lysates were subjected to immunoblot analyses with antibodies against LC3B or calnexin (CANX). The numbers indicated below the LC3 images represent the LC3-II/LC3-I signal ratios relative to the CANX signals, normalized to the ratio in untreated (Ctrl) cells. (A) When indicated, BafA1 (2 nM) was added from the start of the cultures. The cells were harvested at the indicated time points after IR, and one representative Western blot of three is shown. (B) Left panel: The cells were harvested 24 hours after IR, and BafA1 (2 nM) was added for the last 4 hours, as indicated. One representative Western blot of 8 is shown. Right panel: Ratios of the LC3-II/LC3-I signal intensities relative to the CANX signals, normalized to ratio in untreated (Ctrl) cells. The data represent the mean +/- SEM, n=8. *p< 0.05 (paired t test).CC BY · PubMed Central
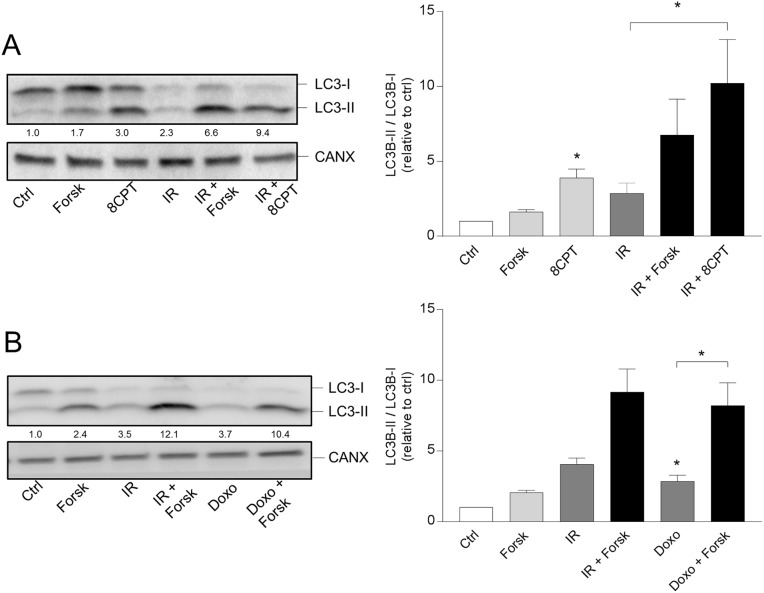
Figure 2 PKA- and doxorubicin-mediated autophagy (A and B) REH cells were treated with or without forskolin, IR and BafA1 as described in Figure 1B. When indicated, the cells were treated with or without 8CPT-cAMP (8CPT, 200μM) 45 min prior to IR (panel A) or with 150 nM doxorubicin (Doxo) 45 min after adding forskolin (panel B). Left panels: One representative Western blot of three independent experiments is shown. The numbers indicated below the LC3 images represent the LC3-II/LC3-I signal ratios relative to the CANX signals, normalized to the ratio in untreated (Ctrl) cells. Right panels: Ratios of the LC3-II/LC3-I signal intensities relative to the CANX signals, normalized to the ratio in untreated (Ctrl) cells. The data represent the mean +/- SEM, n=3. *p<0.05 (paired t test).
Figure 2 PKA- and doxorubicin-mediated autophagy (A and B) REH cells were treated with or without forskolin, IR and BafA1 as described in Figure 1B. When indicated, the cells were treated with or without 8CPT-cAMP (8CPT, 200μM) 45 min prior to IR (panel A) or with 150 nM doxorubicin (Doxo) 45 min after adding forskolin (panel B). Left panels: One representative Western blot of three independent experiments is shown. The numbers indicated below the LC3 images represent the LC3-II/LC3-I signal ratios relative to the CANX signals, normalized to the ratio in untreated (Ctrl) cells. Right panels: Ratios of the LC3-II/LC3-I signal intensities relative to the CANX signals, normalized to the ratio in untreated (Ctrl) cells. The data represent the mean +/- SEM, n=3. *p<0.05 (paired t test).CC BY · PubMed Central
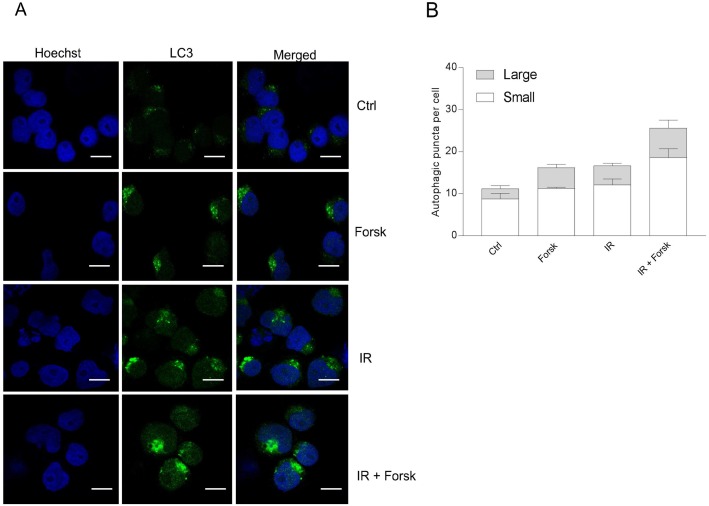
Figure 3 Immunocytochemistry of LC3-puncta (A and B) REH cells were treated with or without forskolin, IR and BafA1 as described in Figure 1B, with addition of BafA1 to all samples. The cells were subjected to immunocytochemistry for the detection of LC3 puncta by confocal microscopy, and the cells were co-stained with Hoechst for visualization of the nuclei. (A) One representative of three independent experiments is shown. Scale bars = 10μm. (B) The number of LC3 puncta per cell from three independent experiments were quantified, counting at least 30 cells. The data represent the mean +/- SEM, n = 30. The numbers of small and large puncta are indicated.
Figure 3 Immunocytochemistry of LC3-puncta (A and B) REH cells were treated with or without forskolin, IR and BafA1 as described in Figure 1B, with addition of BafA1 to all samples. The cells were subjected to immunocytochemistry for the detection of LC3 puncta by confocal microscopy, and the cells were co-stained with Hoechst for visualization of the nuclei. (A) One representative of three independent experiments is shown. Scale bars = 10μm. (B) The number of LC3 puncta per cell from three independent experiments were quantified, counting at least 30 cells. The data represent the mean +/- SEM, n = 30. The numbers of small and large puncta are indicated.CC BY · PubMed Central
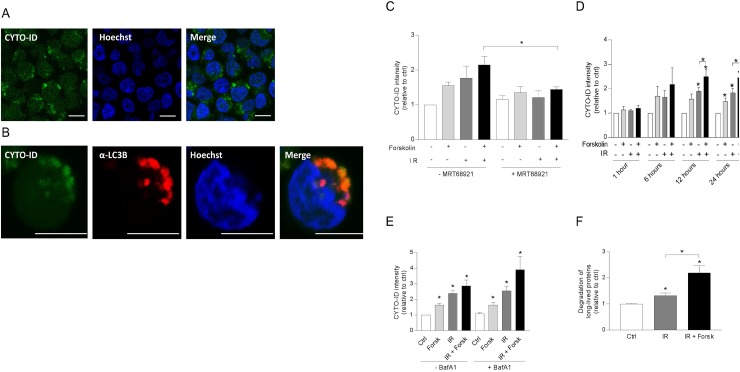
Figure 4 cAMP signaling enhances autophagic flux in REH cells (A-E) REH cells were treated with or without forskolin, IR and BafA1 as described in Figure 1B. CYTO-ID staining was performed 24 hours after IR – if not otherwise indicated, and the staining intensity was analyzed by flow cytometry and normalized to untreated (Ctrl) cells. (A) Confocal images of IR/forskolin-treated cells stained with CYTO-ID, (B) The co-localization between the autophagosomal marker CYTO-ID and LC3-puncta was analyzed by confocal imaging of IR/forskolin-treated cells. (C) The cells were pretreated with the ULK1 inhibitor MRT68921 (100 nM) for 30 min prior to adding forskolin, and the cells were irradiated after another 45 min. The data represent the mean CYTO-ID fluorescence intensity +/- SEM, n=3. *p=0.05 (paired t test). (D) The cells were stained with CYTO-ID at the indicated time points, and the fluorescence intensity was analyzed by flow cytometry. The data represent the mean CYTO-ID fluorescence intensity +/- SEM, n=5. *p<0.05 (paired t test). (E) Cells were treated with or without 2 nM BafA1for the last 4 hours of the 24 hours incubation. The data represent the mean CYTO-ID fluorescence intensity +/- SEM, n=5. *p<0.05 (paired t test). (F) The effect of IR and forskolin on relative autophagic flux was quantified by measuring the degradation of long-lived proteins as described in Materials and Methods. The data represent the mean +/- SEM, n=3, and the values are normalized to the degradation in untreated (Ctrl) cells. *p<0.05 (paired t test).
Figure 4 cAMP signaling enhances autophagic flux in REH cells (A-E) REH cells were treated with or without forskolin, IR and BafA1 as described in Figure 1B. CYTO-ID staining was performed 24 hours after IR – if not otherwise indicated, and the staining intensity was analyzed by flow cytometry and normalized to untreated (Ctrl) cells. (A) Confocal images of IR/forskolin-treated cells stained with CYTO-ID, (B) The co-localization between the autophagosomal marker CYTO-ID and LC3-puncta was analyzed by confocal imaging of IR/forskolin-treated cells. (C) The cells were pretreated with the ULK1 inhibitor MRT68921 (100 nM) for 30 min prior to adding forskolin, and the cells were irradiated after another 45 min. The data represent the mean CYTO-ID fluorescence intensity +/- SEM, n=3. *p=0.05 (paired t test). (D) The cells were stained with CYTO-ID at the indicated time points, and the fluorescence intensity was analyzed by flow cytometry. The data represent the mean CYTO-ID fluorescence intensity +/- SEM, n=5. *p<0.05 (paired t test). (E) Cells were treated with or without 2 nM BafA1for the last 4 hours of the 24 hours incubation. The data represent the mean CYTO-ID fluorescence intensity +/- SEM, n=5. *p<0.05 (paired t test). (F) The effect of IR and forskolin on relative autophagic flux was quantified by measuring the degradation of long-lived proteins as described in Materials and Methods. The data represent the mean +/- SEM, n=3, and the values are normalized to the degradation in untreated (Ctrl) cells. *p<0.05 (paired t test).CC BY · PubMed Central
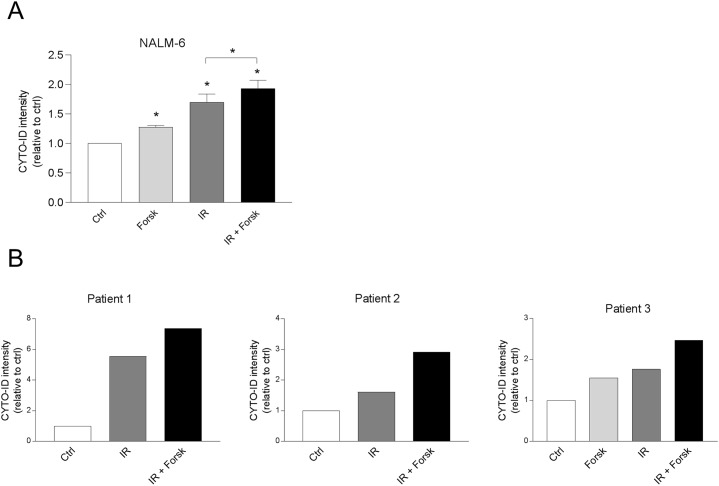
Figure 5 cAMP signaling enhances CYTO-ID staining in NALM-6 and in primary BCP-ALL cells (A) NALM-6 cells (0.6×10⁶ cells/ml) were treated with or without forskolin (Forsk, 60μM) for 45 min prior to irradiation (IR, 5Gy). BafA1 (2 nM) was added to the cell cultures for the last 4 hours of the 24 hours incubation, before the cells were stained with CYTO-ID and analyzed for fluorescence intensity by flow cytometry. The data represent the mean CYTO-ID fluorescence intensity ± SEM, n=4. *p<0.05 (paired t test). (B) Primary leukemic blasts (0.6 x10⁶ cells/ml) from three patients diagnosed with BCP-ALL were treated with or without Forsk, IR and BafA1 as described in panel A.
Figure 5 cAMP signaling enhances CYTO-ID staining in NALM-6 and in primary BCP-ALL cells (A) NALM-6 cells (0.6×10⁶ cells/ml) were treated with or without forskolin (Forsk, 60μM) for 45 min prior to irradiation (IR, 5Gy). BafA1 (2 nM) was added to the cell cultures for the last 4 hours of the 24 hours incubation, before the cells were stained with CYTO-ID and analyzed for fluorescence intensity by flow cytometry. The data represent the mean CYTO-ID fluorescence intensity ± SEM, n=4. *p<0.05 (paired t test). (B) Primary leukemic blasts (0.6 x10⁶ cells/ml) from three patients diagnosed with BCP-ALL were treated with or without Forsk, IR and BafA1 as described in panel A.CC BY · PubMed Central
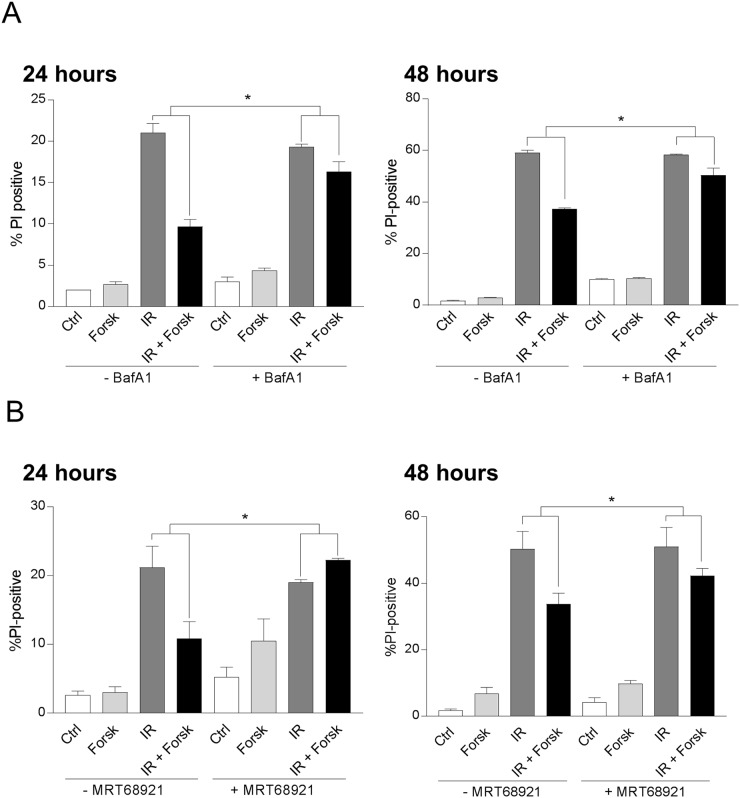
Figure 6 cAMP-mediated inhibition of DNA damage-induced cell death involves autophagy REH cells were treated with or without forskolin and irradiation as described in Figure 1. When indicated, BafA1 (2 nM) (A) or the ULK1 inhibitor MRT68921 (100 nM) (B) was present in the cell cultures throughout the experiments to block autophagy. The percentage of PI-positive cells was analyzed by flow cytometry 24 hours or 48 hours after IR, as indicated. The results are presented as the mean ± SEM, n=6. *p<0.05 (paired t test).
Figure 6 cAMP-mediated inhibition of DNA damage-induced cell death involves autophagy REH cells were treated with or without forskolin and irradiation as described in Figure 1. When indicated, BafA1 (2 nM) (A) or the ULK1 inhibitor MRT68921 (100 nM) (B) was present in the cell cultures throughout the experiments to block autophagy. The percentage of PI-positive cells was analyzed by flow cytometry 24 hours or 48 hours after IR, as indicated. The results are presented as the mean ± SEM, n=6. *p<0.05 (paired t test).CC BY · PubMed Central
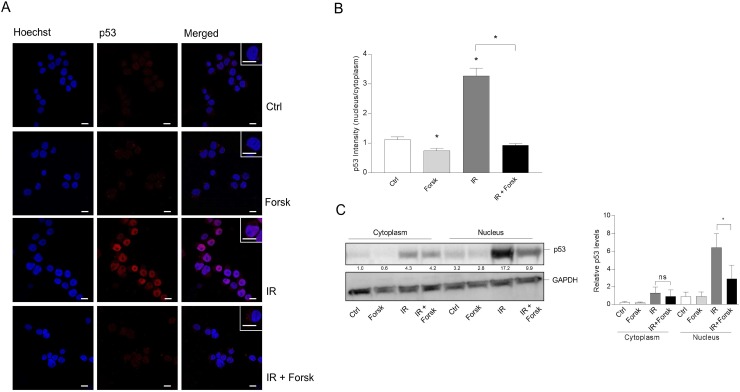
Figure 7 The effects of IR and cAMP signaling on the subcellular localization of p53 REH cells were treated with or without forskolin and IR as described in Figure 1. (A) 4 hours after IR, the cells were subjected to immunocytochemistry for the detection of the subcellular localization of p53 by confocal microscopy, and the cells were co-stained with Hoechst for the visualization of nuclei. One representative of three independent experiments is shown. Scale bars = 10μm. (B) Quantification of the p53 fluorescence intensity of cells from three experiments, analyzing at least 30 cells. The data represent the mean +/-SEM, n=30. *p<0.05, (paired t test). (C) Subcellular fractionation of REH cells (20×106) was performed as described in Materials and Methods 4 hours after IR. The cytoplasmic and nuclear fractions were each subjected to immunoblot analyses of p53 expression. The numbers indicated below the p53 image represents the p53 signal intensity relative to the CANX signal, normalized to the ratio in untreated (Ctrl) cells. Left panel: One of three representative Western blots. Right panel: Quantification of the p53 signal in Western blots, normalized to the loading control GAPDH. The data represent the mean +/-SEM, n=3. *p<0.05 (paired t test).
Figure 7 The effects of IR and cAMP signaling on the subcellular localization of p53 REH cells were treated with or without forskolin and IR as described in Figure 1. (A) 4 hours after IR, the cells were subjected to immunocytochemistry for the detection of the subcellular localization of p53 by confocal microscopy, and the cells were co-stained with Hoechst for the visualization of nuclei. One representative of three independent experiments is shown. Scale bars = 10μm. (B) Quantification of the p53 fluorescence intensity of cells from three experiments, analyzing at least 30 cells. The data represent the mean +/-SEM, n=30. *p<0.05, (paired t test). (C) Subcellular fractionation of REH cells (20×106) was performed as described in Materials and Methods 4 hours after IR. The cytoplasmic and nuclear fractions were each subjected to immunoblot analyses of p53 expression. The numbers indicated below the p53 image represents the p53 signal intensity relative to the CANX signal, normalized to the ratio in untreated (Ctrl) cells. Left panel: One of three representative Western blots. Right panel: Quantification of the p53 signal in Western blots, normalized to the loading control GAPDH. The data represent the mean +/-SEM, n=3. *p<0.05 (paired t test).CC BY · PubMed Central
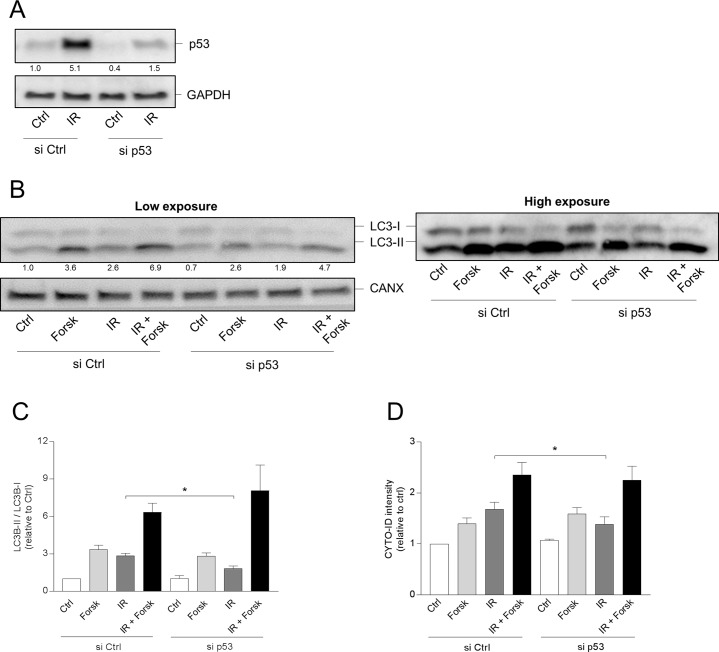
Figure 8 p53 is involved in IR-, but not in cAMP-induced autophagy (A-D) REH cells (4×10⁶ cells) were transfected with siRNA against p53 (or with scrambled siRNA as control) as described in Materials and Methods, and after 12 hours the cells were treated with or without forskolin and IR as described in Figure 1. (A) Knock-down of p53 by siRNA demonstrated by Western blot analyses of untreated (Ctrl) and irradiated (IR) cells. Signal intensities of p53 relative to GAPDH, normalized to Ctrl, are indicated as numbers below the p53 images. (B-D) BafA1 (2 nM) was added for the last 4 hours of the 24 hours incubations. (B) 24 hours after IR, the cells were harvested for Western blot analyses of LC3-II/I ratios, and one representative of 4 independent experiments is shown. The numbers indicated below the LC3 images represent the LC3-II/LC3-I signal ratios relative to the CANX signals, normalized to the ratio in untreated (Ctrl) cells. (C) Quantifications of the Western blots in panel B, presented as the ratios of LC3-II/LC3-I signal intensities relative to the CANX signals, normalized to the ratio in untreated (Ctrl) cells. The data represent the mean +/- SEM, n=4. *p<0.05 (paired t test). (D) The same cells as in panel A were subjected to CYTO-ID staining, and the fluorescence intensity was analysed by flow cytometry 24 hours after IR. The data represent the mean CYTO-ID fluorescence intensity +/- SEM, n=4. *p<0.05 (paired t test).
Figure 8 p53 is involved in IR-, but not in cAMP-induced autophagy (A-D) REH cells (4×10⁶ cells) were transfected with siRNA against p53 (or with scrambled siRNA as control) as described in Materials and Methods, and after 12 hours the cells were treated with or without forskolin and IR as described in Figure 1. (A) Knock-down of p53 by siRNA demonstrated by Western blot analyses of untreated (Ctrl) and irradiated (IR) cells. Signal intensities of p53 relative to GAPDH, normalized to Ctrl, are indicated as numbers below the p53 images. (B-D) BafA1 (2 nM) was added for the last 4 hours of the 24 hours incubations. (B) 24 hours after IR, the cells were harvested for Western blot analyses of LC3-II/I ratios, and one representative of 4 independent experiments is shown. The numbers indicated below the LC3 images represent the LC3-II/LC3-I signal ratios relative to the CANX signals, normalized to the ratio in untreated (Ctrl) cells. (C) Quantifications of the Western blots in panel B, presented as the ratios of LC3-II/LC3-I signal intensities relative to the CANX signals, normalized to the ratio in untreated (Ctrl) cells. The data represent the mean +/- SEM, n=4. *p<0.05 (paired t test). (D) The same cells as in panel A were subjected to CYTO-ID staining, and the fluorescence intensity was analysed by flow cytometry 24 hours after IR. The data represent the mean CYTO-ID fluorescence intensity +/- SEM, n=4. *p<0.05 (paired t test).CC BY · PubMed Central
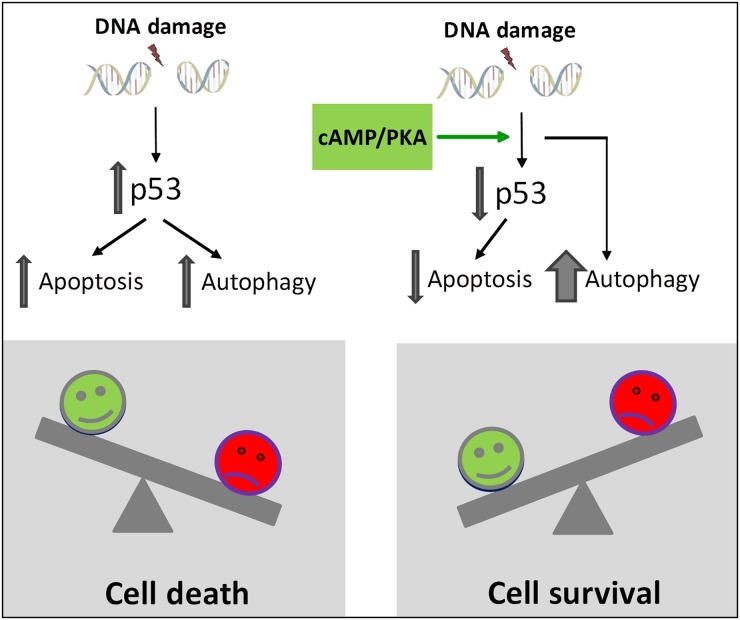
Figure 9 Proposed model for cAMP-mediated survival of DNA damage-induced BCP-ALL cells According to the model, cAMP-mediated survival of BCP-ALL cells exposed to DNA damage involves reduced p53-mediated apoptosis as well as p53-independent enhancement of autophagy. We suggest that autophagy needs to exceed a certain threshold in order to let the cells survive exposure to DNA damaging agents.
Figure 9 Proposed model for cAMP-mediated survival of DNA damage-induced BCP-ALL cells According to the model, cAMP-mediated survival of BCP-ALL cells exposed to DNA damage involves reduced p53-mediated apoptosis as well as p53-independent enhancement of autophagy. We suggest that autophagy needs to exceed a certain threshold in order to let the cells survive exposure to DNA damaging agents.CC BY · PubMed Central

Verification

Claims the paper makes

The claims and statistics of this paper haven’t been checked yet.

Run the check — free, no account needed. It reads the open-access text and checks the sources it cites.

A few free checks a day · papers already verified open instantly · results are public

Claims other papers make about this one

Each is checked against this paper’s own text: does it say what the citing paper says it does?

Self-check

Percentages, sums and reported differences re-computed from the paper’s own numbers.

The self-check needs the paper’s full text.

Citations

Cites

Show all 5 references

Research works printed but not linked: 49

  1. Levine, 2015, Autophagy in malignant transformation and cancer progression, EMBO J, 34, 856, 10.15252/embj.201490784 · DOI · Paper page
  2. White, 2016, Recent insights into the function of autophagy in cancer, Genes Dev, 30, 1913, 10.1101/gad.287524.116 · DOI
  3. Kroemer, 2016, Defective Autophagy Initiates Malignant Transformation, Mol Cell, 62, 473, 10.1016/j.molcel.2016.05.001 · DOI
  4. Deng, 2018, Autophagy and doxorubicin resistance in cancer, Anticancer Drugs, 29, 1, 10.1097/CAD.0000000000000572 · DOI
  5. Klionsky, 2007, Autophagy: from phenomenology to molecular understanding in less than a decade, Nat Rev Mol Cell Biol, 8, 931, 10.1038/nrm2245 · DOI
  6. Ohsumi, 2011, The role of Atg proteins in autophagosome formation, Annu Rev Cell Dev Biol, 27, 107, 10.1146/annurev-cellbio-092910-154005 · DOI · Paper page
  7. Kimchi, 2009, Life and death partners: apoptosis, autophagy and the cross-talk between them, Cell Death Differ, 16, 966, 10.1038/cdd.2009.33 · DOI
  8. Fulda, 2012, Autophagy and cell death, Autophagy, 8, 1250, 10.4161/auto.20669 · DOI
  9. Kogel, 2015, Cell death by autophagy: emerging molecular mechanisms and implications for cancer therapy, Oncogene, 34, 5105, 10.1038/onc.2014.458 · DOI
  10. Lenz, 2013, Autophagy and genomic integrity, Cell Death Differ, 20, 1444, 10.1038/cdd.2013.103 · DOI
  11. Pui, 2015, Biology of childhood acute lymphoblastic leukemia, Pediatr Clin North Am, 62, 47, 10.1016/j.pcl.2014.09.004 · DOI
  12. Martelli, 2015, Autophagy in acute leukemias: a double-edged sword with important therapeutic implications, Biochim Biophys Acta, 1853, 14, 10.1016/j.bbamcr.2014.09.023 · DOI
  13. Young, 2012, The TP53 tumor suppressor and autophagy in malignant lymphoma, Autophagy, 8, 842, 10.4161/auto.19703 · DOI
  14. Puissant, 2017, Autophagy, a key mechanism of oncogenesis and resistance in leukemia, Blood, 129, 547, 10.1182/blood-2016-07-692707 · DOI
  15. Sharma, 2016, Radiation-induced autophagy: mechanisms and consequences, Free Radic Res, 50, 273, 10.3109/10715762.2015.1129534 · DOI
  16. Abrams, 2008, p53: The Janus of autophagy?, Nat Cell Biol, 10, 637, 10.1038/ncb0608-637 · DOI
  17. Kroemer, 2010, Autophagy regulation by p53, Curr Opin Cell Biol, 22, 181, 10.1016/j.ceb.2009.12.001 · DOI
  18. Weinberg, 2012, Cancer-stimulated mesenchymal stem cells create a carcinoma stem cell niche via prostaglandin E2 signaling, Cancer Discov, 2, 840, 10.1158/2159-8290.cd-12-0101 · DOI
  19. Denizot, 2006, PGE(2) receptor subtype functionality on immature forms of human leukemic blasts, Leuk Res, 30, 1309, 10.1016/j.leukres.2005.12.017 · DOI
  20. Naderi, 2009, Activation of cAMP signaling inhibits DNA damage-induced apoptosis in BCP-ALL cells through abrogation of p53 accumulation, Blood, 114, 608, 10.1182/blood-2009-02-204883 · DOI
  21. Naderi, 2011, Activation of cAMP signaling interferes with stress-induced p53 accumulation in ALL-derived cells by promoting the interaction between p53 and HDM2, Neoplasia, 13, 653, 10.1593/neo.11542 · DOI
  22. Blomhoff, 2013, Selective inhibition of cell death in malignant vs normal B-cell precursors: implications for cAMP in development and treatment of BCP-ALL, Blood, 121, 1805, 10.1182/blood-2012-08-452698 · DOI
  23. Blomhoff, 2015, Bone marrow stroma-derived PGE2 protects BCP-ALL cells from DNA damage-induced p53 accumulation and cell death, Mol Cancer, 14, 14, 10.1186/s12943-014-0278-9 · DOI
  24. Wang, 2015, Bafilomycin A1 targets both autophagy and apoptosis pathways in pediatric B-cell acute lymphoblastic leukemia, Haematologica, 100, 345, 10.3324/haematol.2014.113324 · DOI
  25. Brunton, 2002, Cyclic nucleotide research -- still expanding after half a century, Nat Rev Mol Cell Biol, 3, 710, 10.1038/nrm911 · DOI
  26. Sheng, 2016, Detecting Autophagy and Autophagy Flux in Chronic Myeloid Leukemia Cells Using a Cyto-ID Fluorescence Spectrophotometric Assay, Methods Mol Biol, 1465, 95, 10.1007/978-1-4939-4011-0_9 · DOI
  27. Klionsky, 2015, How to control self-digestion: transcriptional, post-transcriptional, and post-translational regulation of autophagy, Trends Cell Biol, 25, 354, 10.1016/j.tcb.2015.02.002 · DOI · Paper page
  28. Mergen, 2014, Assessment of ER Stress and autophagy induced by ionizing radiation in both radiotherapy patients and ex vivo irradiated samples, J Biochem Mol Toxicol, 28, 413, 10.1002/jbt.21579 · DOI
  29. Kroemer, 2008, A dual role of p53 in the control of autophagy, Autophagy, 4, 810, 10.4161/auto.6486 · DOI
  30. Evan, 2009, p53--a Jack of all trades but master of none, Nat Rev Cancer, 9, 821, 10.1038/nrc2728 · DOI
  31. Schumacher, 2012, The p53 network: cellular and systemic DNA damage responses in aging and cancer, Trends Genet, 28, 128, 10.1016/j.tig.2011.12.002 · DOI · Paper page
  32. Kerckaert, 1992, Mutations of the p53 gene in B-cell lymphoblastic acute leukemia: a report on 60 cases, Leukemia, 6, 42
  33. Kapuy, 2015, A Comprehensive Systems Biological Study of Autophagy-Apoptosis Crosstalk during Endoplasmic Reticulum Stress, Biomed Res Int, 2015, 319589, 10.1155/2015/319589 · DOI
  34. Liu, 2015, Inhibition of autophagy enhances the anticancer activity of bortezomib in B-cell acute lymphoblastic leukemia cells, Am J Cancer Res, 5, 639
  35. Johansen, 2009, Monitoring autophagic degradation of p62/SQSTM1, Methods Enzymol, 452, 181, 10.1016/s0076-6879(08)03612-4 · DOI · Paper page
  36. Zheng, 2015, p53-mediated autophagic regulation: A prospective strategy for cancer therapy, Cancer Lett, 363, 101, 10.1016/j.canlet.2015.04.014 · DOI
  37. Eliopoulos, Havaki, Gorgoulis. DNA Damage Response and Autophagy: A Meaningful Partnership. Front Genet. 2016; 7:204. https://doi.org/10.3389/fgene.2016.00204. · DOI · Paper page
  38. Prokesch, 2017, Downregulation of p53 drives autophagy during human trophoblast differentiation, Cell Mol Life Sci, 75, 1839, 10.1007/s00018-017-2695-6 · DOI
  39. Foa, 2013, TP53 mutations are frequent in adult acute lymphoblastic leukemia cases negative for recurrent fusion genes and correlate with poor response to induction therapy, Haematologica, 98, e59, 10.3324/haematol.2012.076786 · DOI
  40. Eckert, 2011, Mutations and deletions of the TP53 gene predict nonresponse to treatment and poor outcome in first relapse of childhood acute lymphoblastic leukemia, J Clin Oncol, 29, 3185, 10.1200/jco.2011.34.8144 · DOI
  41. Eckert, 2013, Prognostic value of genetic alterations in children with first bone marrow relapse of childhood B-cell precursor acute lymphoblastic leukemia, Leukemia, 27, 295, 10.1038/leu.2012.155 · DOI
  42. Haferlach, 2014, TP53 mutations occur in 15.7% of ALL and are associated with MYC-rearrangement, low hypodiploidy, and a poor prognosis, Blood, 124, 251, 10.1182/blood-2014-02-558833 · DOI
  43. Ganley, 2015, Pharmacological inhibition of ULK1 kinase blocks mammalian target of rapamycin (mTOR)-dependent autophagy, J Biol Chem, 290, 11376, 10.1074/jbc.C114.627778 · DOI
  44. Turk, 2015, Small Molecule Inhibition of the Autophagy Kinase ULK1 and Identification of ULK1 Substrates, Mol Cell, 59, 285, 10.1016/j.molcel.2015.05.031 · DOI · Paper page
  45. De The, 1977, An effect human leukaemic cell line: Reh, Eur J Cancer, 13, 377, 10.1016/0014-2964(77)90085-8 · DOI
  46. Kersey, 1979, Characterization of a leukemic cell line of the pre-B phenotype, Int J Cancer, 23, 174, 10.1002/ijc.2910230206 · DOI
  47. Blomhoff, 2005, cAMP-mediated inhibition of DNA replication and S phase progression: involvement of Rb, p21Cip1, and PCNA, Mol Biol Cell, 16, 1527, 10.1091/mbc.E04-06-0501 · DOI
  48. Carlsson, 2016, HS1BP3 negatively regulates autophagy by modulation of phosphatidic acid levels, Nat Commun, 7, 13889, 10.1038/ncomms13889 · DOI
  49. Blomhoff, 2015, Retinoic acid-induced IgG production in TLR-activated human primary B cells involves ULK1-mediated autophagy, Autophagy, 11, 460, 10.1080/15548627.2015.1009797 · DOI

Cited by

Sorted by citations

Metadata

Authors
Skah, S., Richartz, N., Duthil, E., Gilljam, K. M., Bindesbøll, C., Naderi, E. H., Eriksen, A. B., Ruud, E., Dirdal, M. M., Simonsen, A., & Blomhoff, H. K.
Affiliations
  • Department of Molecular Medicine, Institute of Basic Medical Sciences, University of Oslo, Oslo, Norway
  • Department of Oncology, Section for Head and Neck Oncology, Oslo University Hospital, Oslo, Norway
  • Department of Hematology and Oncology, Division of Pediatric and Adolescent Medicine, Oslo University Hospital, Oslo, Norway
Venue
Oncotarget
Published
2018-07-13
Volume
9
Issue
54
Pages
30434-30449
ISSN
1949-2553
Cited by
21
References
5
Language
en

About these checks

Registry, retraction, Cites and statistics results are computed, not judged, with one exception: a printed reference that no index lists is read once by a model before it counts as a citation error. Claims are extracted by a model and kept only when their quote appears verbatim in the text; each cited source is then checked, with a model’s help, for whether it says what the claim relies on. Those verdicts can be wrong — read the claim’s quote and the cited source before relying on one.

Statistics and arithmetic are recomputed, not judged.

Confidence bands are shown only for fields calibrated on our annotated test set. None is calibrated yet, so no band is shown.

What counts as a claim ›How we measure confidence ›How we check this ›

Are you an author, or do you see a problem with this page? Request a review