

The DOI matches its Crossref record; 60 of the 60 references it cites were found in a registry or an index.
MicroRNA-138 promotes acquired alkylator resistance in glioblastoma by targeting the Bcl-2-interacting mediator BIM
Abstract
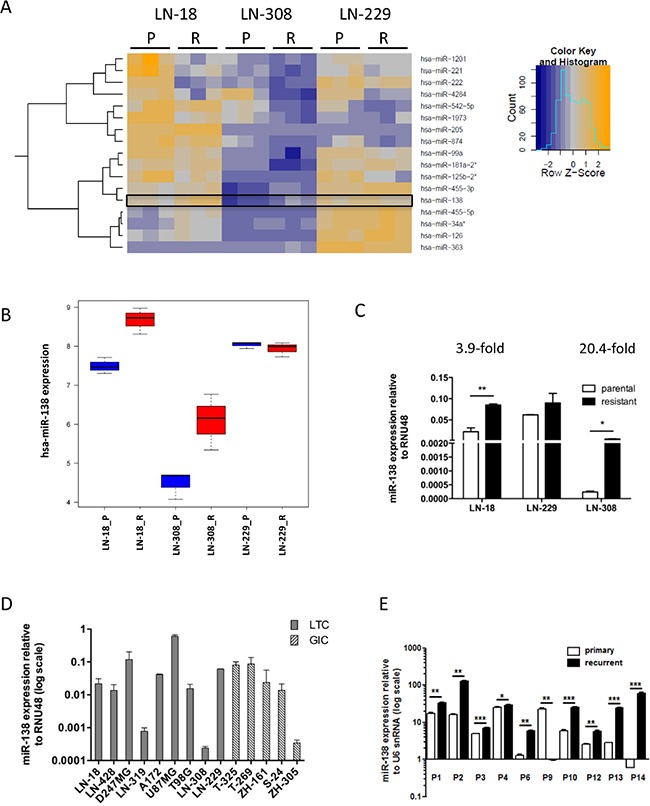
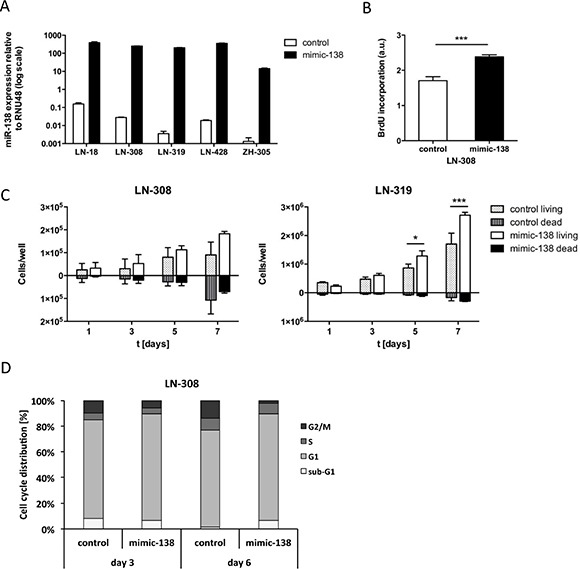
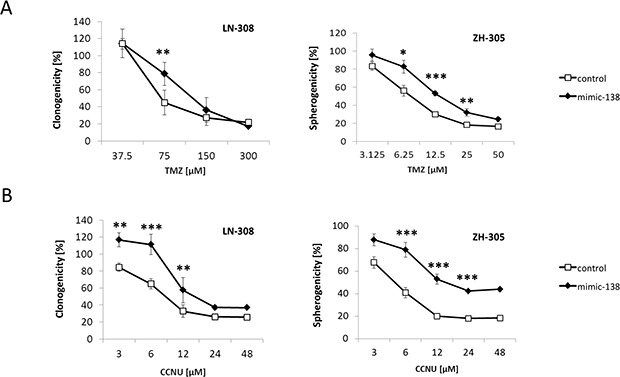
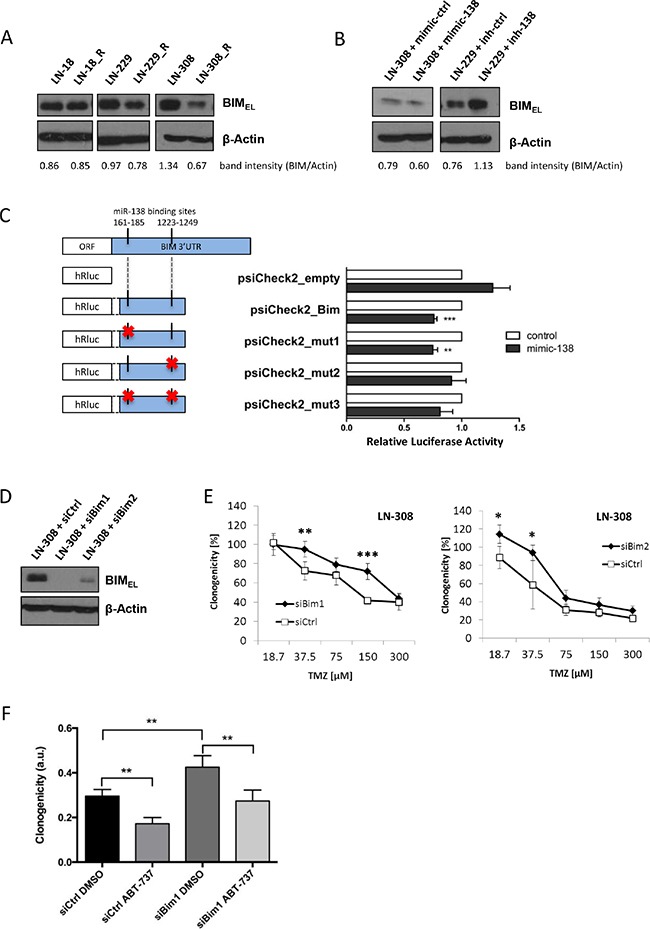
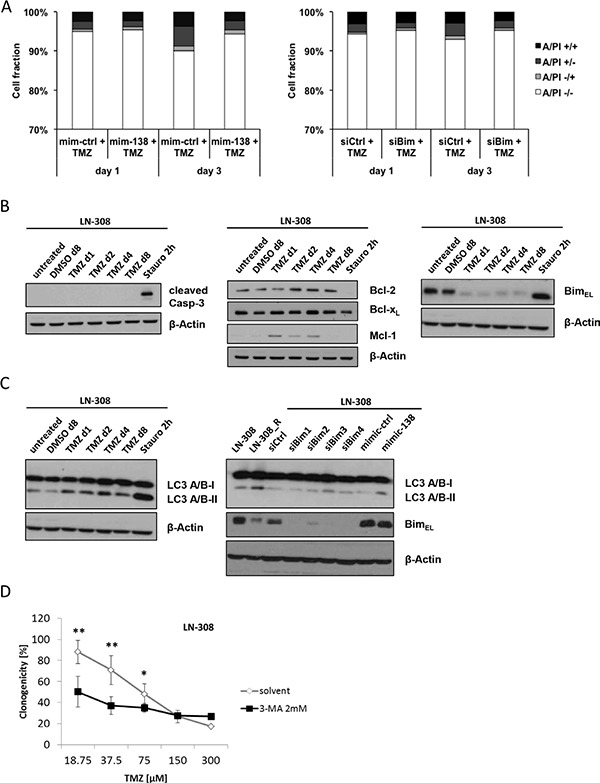
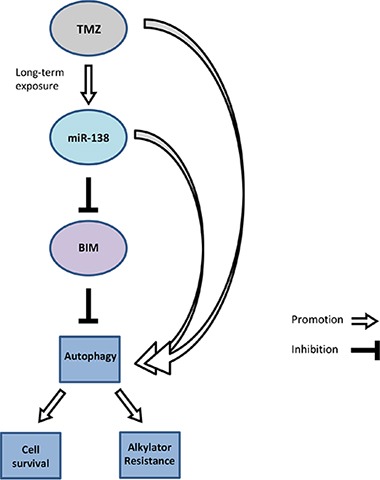
// Nina Stojcheva 1, 2 , Gennadi Schechtmann 3 , Steffen Sass 4 , Patrick Roth 1, 2 , Ana-Maria Florea 3 , Anja Stefanski 5 , Kai Stühler 5 , Marietta Wolter 3 , Nikola S. Müller 4 , Fabian J. Theis 4, 6 , Michael Weller 1, 2 , Guido Reifenberger 3, 7 , Caroline Happold 1, 2 1 Laboratory of Molecular Neuro-Oncology, Department of Neurology, University Hospital and University of Zurich, Zurich, Switzerland 2 Neuroscience Center Zurich, University of Zurich, Zurich, Switzerland 3 Department of Neuropathology, Heinrich Heine University Düsseldorf, Düsseldorf, Germany 4 Institute of Computational Biology, Helmholtz Center Munich, German Research Center for Environmental Health, Neuherberg, Germany 5 Molecular Proteomics Laboratory, Biological and Medical Research Center (BMFZ), Heinrich Heine University Düsseldorf, Düsseldorf, Germany 6 Department of Mathematics, Technische Universität München, Garching, Germany 7 German Cancer Consortium (DKTK), German Cancer Research Center (DKFZ) Heidelberg, partner site Essen/Düsseldorf, Germany Correspondence to: Caroline Happold, e-mail: caroline.happold@usz.ch Keywords: chemoresistance, temozolomide, glioblastoma, miR-138, BIM Received: December 11, 2015 Accepted: January 26, 2016 Published: February 12, 2016 ABSTRACT Glioblastoma is the most aggressive brain tumor in adults with a median survival below 12 months in population-based studies. The main reason for tumor recurrence and progression is constitutive or acquired resistance to the standard of care of surgical resection followed by radiotherapy with concomitant and adjuvant temozolomide (TMZ/RT→TMZ). Here, we investigated the role of microRNA (miRNA) alterations as mediators of alkylator resistance in glioblastoma cells. Using microarray-based miRNA expression profiling of parental and TMZ-resistant cultures of three human glioma cell lines, we identified a set of differentially expressed miRNA candidates. From these, we selected miR-138 for further functional analyses as this miRNA was not only upregulated in TMZ-resistant versus parental cells, but also showed increased expression in vivo in recurrent glioblastoma tissue samples after TMZ/RT→TMZ treatment. Transient transfection of miR-138 mimics in glioma cells with low basal miR-138 expression increased glioma cell proliferation. Moreover, miR-138 overexpression increased TMZ resistance in long-term glioblastoma cell lines and glioma initiating cell cultures. The apoptosis regulator BIM was identified as a direct target of miR-138, and its silencing mediated the induced TMZ resistance phenotype. Altered sensitivity to apoptosis played only a minor role in this resistance mechanism. Instead, we identified the induction of autophagy to be regulated downstream of the miR-138/BIM axis and to promote cell survival following TMZ exposure. Our data thus define miR-138 as a glioblastoma cell survival-promoting miRNA associated with resistance to TMZ therapy in vitro and with tumor progression in vivo .
Overview
The claims and statistics of this paper haven’t been checked yet.
Run the check — free, no account needed. It reads the open-access text and checks the sources it cites.
Integrity signals
Registry
Cites
Statistics
Figures
Verification
Claims the paper makes
The claims and statistics of this paper haven’t been checked yet.
Run the check — free, no account needed. It reads the open-access text and checks the sources it cites.
Claims other papers make about this one
Each is checked against this paper’s own text: does it say what the citing paper says it does?
The cited source says what the claim attributes to it.
In the citing paper
“The scenario becomes even more complex when we consider the targeting of miR-138-5p on other cell death-related genes, such as BLCAP and MXD1 [25], LCN2 [78,79], BIM [80], Mst-1 [81], and Mlk3 [82,83], or even in the inhibition of the JNK and p38MAPK pathways [84].”
From MicroRNA-138-5p Targets Pro-Apoptotic Factors and Favors Neural Cell Survival: Analysis in the Injured Spinal Cord (2022) · cites this paper as [80]
Self-check
Percentages, sums and reported differences re-computed from the paper’s own numbers.
The self-check needs the paper’s full text.
Citations
Cites
R: A Language and Environment for Statistical Computing
R Core Team (2025) · doi:10.32614/r.manuals · Cited by 352,181
Analysis of Relative Gene Expression Data Using Real-Time Quantitative PCR and the 2−ΔΔCT Method
Livak, K. J., & Schmittgen, T. D. (2001) · Methods · doi:10.1006/meth.2001.1262 · Cited by 180,860
Controlling the False Discovery Rate: A Practical and Powerful Approach to Multiple Testing
Benjamini, Y., & Hochberg, Y. (1995) · Journal of the Royal Statistical Society Series B: Statistical Methodology · doi:10.1111/j.2517-6161.1995.tb02031.x · Cited by 109,482
Radiotherapy Plus Concomitant and Adjuvant Temozolomide for Glioblastoma
Stupp, R., Mason, W. P., van den Bent, M. J., Weller, M., Fisher, B., Taphoorn, M. J. B., Belanger, K., Brandes, A. A., Marosi, C., Bogdahn, U., et al. (2005) · New England Journal of Medicine · doi:10.1056/nejmoa043330 · Cited by 21,807
Self-citationComprehensive genomic characterization defines human glioblastoma genes and core pathways
The Cancer Genome Atlas Research Network (2008) · Nature · doi:10.1038/nature07385 · Cited by 7,735
MicroRNA signatures in human cancers
Calin, G. A., & Croce, C. M. (2006) · Nature reviews. Cancer · doi:10.1038/nrc1997 · Cited by 7,723
LC3, a mammalian homologue of yeast Apg8p, is localized in autophagosome membranes after processing.
Kabeya, Y., Mizushima, N., Ueno, T., Yamamoto, A., Kirisako, T., Noda, T., Kominami, E., Ohsumi, Y., & Yoshimori, T. (2000) · The EMBO Journal · doi:10.1093/emboj/19.21.5720 · Cited by 6,605
affy—analysis of Affymetrix GeneChip data at the probe level
Gautier, L., Cope, L., Bolstad, B. M., & Irizarry, R. A. (2004) · Bioinformatics · doi:10.1093/bioinformatics/btg405 · Cited by 5,282
Cui, C., Cui, J., Jin, F., Cui, Y., Li, R., Jiang, X., Tian, Y., Wang, R. C., Jiang, P., & Gao, J. (2017) · Cellular Physiology and Biochemistry · doi:10.1159/000479571 · Cited by 5,214
Mutation of the mouse klotho gene leads to a syndrome resembling ageing
Kuro-o, M., Matsumura, Y., Aizawa, H., Kawaguchi, H., Suga, T., Utsugi, T., Ohyama, Y., Kurabayashi, M., Kaname, T., Kume, E., et al. (1997) · Nature · doi:10.1038/36285 · Cited by 3,837
An inhibitor of Bcl-2 family proteins induces regression of solid tumours
Oltersdorf, T., Elmore, S. W., Shoemaker, A. R., Armstrong, R. C., Augeri, D. J., Belli, B. A., Bruncko, M., Deckwerth, T. L., Dinges, J., Hajduk, P. J., et al. (2005) · Nature · doi:10.1038/nature03579 · Cited by 3,416
The Versatile Role of microRNA-30a in Human Cancer
Wang, C., Yang, X., Chen, Y., & Chen, L. (2017) · Cellular Physiology and Biochemistry · doi:10.1159/000471111 · Cited by 3,409
Leva, G. D., Garofalo, M., & Croce, C. M. (2013) · Annual Review of Pathology Mechanisms of Disease · doi:10.1146/annurev-pathol-012513-104715 · Cited by 1,720
Dweep, H., Sticht, C., Pandey, P., & Gretz, N. (2011) · Journal of Biomedical Informatics · doi:10.1016/j.jbi.2011.05.002 · Cited by 1,711
Use of within-array replicate spots for assessing differential expression in microarray experiments
Smyth, G. K., Michaud, J., & Scott, H. S. (2005) · Bioinformatics · doi:10.1093/bioinformatics/bti270 · Cited by 1,405
Autophagy in malignant transformation and cancer progression
Galluzzi, L., Pietrocola, F., Bravo‐San Pedro, J. M., Amaravadi, R. K., Baehrecke, E. H., Cecconi, F., Codogno, P., Debnath, J., Gewirtz, D. A., Karantza, V., et al. (2015) · The EMBO Journal · doi:10.15252/embj.201490784 · Cited by 1,182
Role of autophagy in temozolomide-induced cytotoxicity for malignant glioma cells
Kanzawa, T., Germano, I. M., Komata, T., Ito, H., Kondo, Y., & Kondo, S. (2004) · Cell Death & Differentiation · doi:10.1038/sj.cdd.4401359 · Cited by 986
EANO guideline for the diagnosis and treatment of anaplastic gliomas and glioblastoma
Weller, M., van den Bent, M., Hopkins, K., Tonn, J. C., Stupp, R., Falini, A., Cohen-Jonathan-Moyal, E., Frappaz, D., Henriksson, R., Balana, C., et al. (2014) · The Lancet Oncology · doi:10.1016/s1470-2045(14)70011-7 · Cited by 750
Self-citationGlioblastoma survival in the United States before and during the temozolomide era
Johnson, D. R., & O’Neill, B. P. (2012) · Journal of Neuro-Oncology · doi:10.1007/s11060-011-0749-4 · Cited by 720
Deciphering the rules of programmed cell death to improve therapy of cancer and other diseases
Strasser, A., Cory, S., & Adams, J. M. (2011) · The EMBO Journal · doi:10.1038/emboj.2011.307 · Cited by 532
Roos, W. P., Batista, L. F. Z., Naumann, S. C., Wick, W., Weller, M., Menck, C. F. M., & Kaina, B. (2006) · Oncogene · doi:10.1038/sj.onc.1209785 · Cited by 513
Self-citationExploiting and antagonizing microRNA regulation for therapeutic and experimental applications
Brown, B. D., & Naldini, L. (2009) · Nature Reviews Genetics · doi:10.1038/nrg2628 · Cited by 336
Hermisson, M., Klumpp, A., Wick, W., Wischhusen, J., Nagel, G., Roos, W., Kaina, B., & Weller, M. (2006) · Journal of Neurochemistry · doi:10.1111/j.1471-4159.2005.03583.x · Cited by 311
Self-citationStable knockdown of microRNA in vivo by lentiviral vectors
Gentner, B., Schira, G., Giustacchini, A., Amendola, M., Brown, B. D., Ponzoni, M., & Naldini, L. (2008) · Nature Methods · doi:10.1038/nmeth.1277 · Cited by 309
Knizhnik, A. V., Roos, W. P., Nikolova, T., Quiros, S., Tomaszowski, K.-H., Christmann, M., & Kaina, B. (2013) · PLoS ONE · doi:10.1371/journal.pone.0055665 · Cited by 273
Møller, H. G., Rasmussen, A. P., Andersen, H. H., Johnsen, K. B., Henriksen, M., & Duroux, M. C. (2012) · Molecular Neurobiology · doi:10.1007/s12035-012-8349-7 · Cited by 273
MicroRNA‐138 suppresses ovarian cancer cell invasion and metastasis by targeting SOX4 and HIF‐1α
Yeh, Y.-M., Chuang, C.-M., Chao, K.-C., & Wang, L. (2013) · International Journal of Cancer · doi:10.1002/ijc.28086 · Cited by 236
O’Reilly, L. A., Cullen, L., Visvader, J. E., Lindeman, G. J., Print, C. G., Bath, M. L., Huang, D. C. S., & Strasser, A. (2000) · American Journal Of Pathology · doi:10.1016/s0002-9440(10)64557-9 · Cited by 235
Ujifuku, K., Mitsutake, N., Takakura, S., Matsuse, M., Saenko, V., Suzuki, K., Hayashi, K., Matsuo, T., Kamada, K., Nagata, I., et al. (2010) · Cancer Letters · doi:10.1016/j.canlet.2010.04.013 · Cited by 230
Bim Inhibits Autophagy by Recruiting Beclin 1 to Microtubules
Luo, S., García-Arencibia, M., Zhao, R., Puri, C., Toh, P. P. C., Sadiq, O., & Rubinsztein, D. C. (2012) · Molecular Cell · doi:10.1016/j.molcel.2012.05.040 · Cited by 209
MicroRNAs as therapeutic targets in chemoresistance
Garofalo, M., & Croce, C. M. (2013) · Drug Resistance Updates · doi:10.1016/j.drup.2013.05.001 · Cited by 158
Wan, G., Mathur, R., Hu, X., Zhang, X., & Lu, X. (2011) · Trends in Biochemical Sciences · doi:10.1016/j.tibs.2011.06.002 · Cited by 158
Distinct molecular mechanisms of acquired resistance to temozolomide in glioblastoma cells
Hertler, C., Roth, P., Wick, W., Schmidt, N., Florea, A., Silginer, M., Reifenberger, G., & Weller, M. (2012) · Journal of Neurochemistry · doi:10.1111/j.1471-4159.2012.07781.x · Cited by 144
Self-citationKim, J., Zhang, Y., Skalski, M., Hayes, J. L., Kefas, B. A., Schiff, D., Purow, B. W., Parsons, S. J., Lawler, S. E., & Abounader, R. (2014) · Cancer Research · doi:10.1158/0008-5472.can-13-1449 · Cited by 128
Shi, L. (2011) · International Journal of Oncology · doi:10.3892/ijo.2011.1179 · Cited by 122
Lin, C., Lee, C.-C., Shih, Y., Lin, C., Wang, S.-H., Chen, T.-H., & Shih, C.-M. (2012) · PLoS ONE · doi:10.1371/journal.pone.0038706 · Cited by 121
Multilevel Whole-Genome Analysis Reveals Candidate Biomarkers in Clear Cell Renal Cell Carcinoma
Girgis, A. H., Iakovlev, V. V., Beheshti, B., Bayani, J., Squire, J. A., Bui, A., Mankaruos, M., Youssef, Y., Khalil, B., Khella, H. W. Z., et al. (2012) · Cancer Research · doi:10.1158/0008-5472.can-12-0656 · Cited by 109
miR-221/222 Target the DNA Methyltransferase MGMT in Glioma Cells
Quintavalle, C., Mangani, D., Roscigno, G., Romano, G., Díaz‐Lagares, Á., Iaboni, M., Donnarumma, E., Fiore, D., Marinis, P. D., Soini, Y., et al. (2013) · PLoS ONE · doi:10.1371/journal.pone.0074466 · Cited by 105
Munoz, J. L., Rodriguez‐Cruz, V., Ramkissoon, S. H., Ligon, K. L., Greco, S. J., & Rameshwar, P. (2015) · Oncotarget · doi:10.18632/oncotarget.2778 · Cited by 98
MicroRNA-mediated down-regulation of NKG2D ligands contributes to glioma immune escape
Codó, P., Weller, M., Meister, G., Szabó, E., Steinle, A., Wolter, M., Reifenberger, G., & Roth, P. (2014) · Oncotarget · doi:10.18632/oncotarget.2287 · Cited by 95
Self-citationChakrabarti, M., Banik, N. L., & Ray, S. K. (2013) · Experimental Cell Research · doi:10.1016/j.yexcr.2013.02.025 · Cited by 94
Qiu, S., Huang, D., Yin, D., Li, F., Li, X., Kung, H.-F., & Peng, Y. (2013) · Biochimica et Biophysica Acta (BBA) - Molecular Basis of Disease · doi:10.1016/j.bbadis.2013.05.015 · Cited by 87
Chan, X. H. D., Nama, S., Gopal, F., Rizk, P., Ramasamy, S., Sundaram, G., Ow, G. S., Vladimirovna, I. A., Tanavde, V., Haybaeck, J., et al. (2012) · Cell Reports · doi:10.1016/j.celrep.2012.07.012 · Cited by 84
Caspase cleavage of Bim EL triggers a positive feedback amplification of apoptotic signaling
Chen, D., & Zhou, Q. (2004) · Proceedings of the National Academy of Sciences · doi:10.1073/pnas.0308050100 · Cited by 80
Harder, L. M., Bunkenborg, J., & Andersen, J. (2013) · Autophagy · doi:10.4161/auto.26863 · Cited by 80
Weng, H., Huang, H., Dong, B., Zhao, P., Zhou, H., & Qu, L. (2014) · Cancer Research · doi:10.1158/0008-5472.can-13-1748 · Cited by 79
Autophagy-dependent senescence in response to DNA damage and chronic apoptotic stress
Singh, K., Matsuyama, S., Drazba, J. A., & Almasan, A. (2012) · Autophagy · doi:10.4161/auto.8.2.18600 · Cited by 78
MicroRNAs: master regulators of drug resistance, stemness, and metastasis
Raza, U., Zhang, J. D., & Şahin, Ö. (2014) · Journal of Molecular Medicine · doi:10.1007/s00109-014-1129-2 · Cited by 67
Induction of autophagy in temozolomide treated malignant gliomas
Natsumeda, M., Aoki, H., Miyahara, H., Yajima, N., Uzuka, T., Toyoshima, Y., Kakita, A., Takahashi, H., & Fujii, Y. (2011) · Neuropathology · doi:10.1111/j.1440-1789.2010.01197.x · Cited by 61
Primary glioblastoma cultures: can profiling of stem cell markers predict radiotherapy sensitivity?
Lemke, D., Weiler, M., Blaes, J., Wiestler, B., Jestaedt, L., Klein, A., Löw, S., Eisele, G., Radlwimmer, B., Capper, D., et al. (2014) · Journal of Neurochemistry · doi:10.1111/jnc.12802 · Cited by 57
Self-citationKijima, N., Hosen, N., Kagawa, N., Hashimoto, N., Nakano, A., Fujimoto, Y., Kinoshita, M., Sugiyama, H., & Yoshimine, T. (2011) · Neuro-Oncology · doi:10.1093/neuonc/nor202 · Cited by 56
Integrin inhibition promotes atypical anoikis in glioma cells
Silginer, M., Weller, M., Ziegler, U., & Roth, P. (2014) · Cell Death and Disease · doi:10.1038/cddis.2013.543 · Cited by 55
Self-citationSignaling-Mediated Regulation of MicroRNA Processing
Shen, J., & Hung, M. (2015) · Cancer Research · doi:10.1158/0008-5472.can-14-2568 · Cited by 53
Role of microRNA-138 as a Potential Tumor Suppressor in Head and Neck Squamous Cell Carcinoma
Jin, Y., Chen, D., Cabay, R. J., Wang, A., Crowe, D. L., & Zhou, X. C. (2013) · International review of cytology · doi:10.1016/b978-0-12-407697-6.00009-x · Cited by 51
ALCAM is associated with chemoresistance and tumor cell adhesion in pancreatic cancer
Hong, X., Michalski, C. W., Kong, B., Zhang, W., Raggi, M. C., Sauliunaite, D., Oliveira, T. D., Friess, H., & Kleeff, J. H. (2010) · Journal of Surgical Oncology · doi:10.1002/jso.21538 · Cited by 50
MiR-136 modulates glioma cell sensitivity to temozolomide by targeting astrocyte elevated gene-1
Wu, H., Liu, Q., Cai, T., Chen, Y.-D., Liao, F., & Wang, Z. (2014) · Diagnostic Pathology · doi:10.1186/s13000-014-0173-0 · Cited by 50
Hertler, C., Roth, P., Silginer, M., Florea, A., Lamszus, K., Frei, K., Deenen, R., Reifenberger, G., & Weller, M. (2014) · Molecular Cancer Therapeutics · doi:10.1158/1535-7163.mct-13-0772 · Cited by 49
Self-citationMicroRNA as potential modulators in chemoresistant high-grade gliomas
Low, S. Y. Y., Ho, Y. K., Too, H., Yap, C. T., & Ng, W. H. (2013) · Journal of Clinical Neuroscience · doi:10.1016/j.jocn.2013.07.033 · Cited by 46
Li, P., Lu, X., Wang, Y., Sun, L., Qian, C., Yan, W., Liu, N., You, Y., & Fu, Z. (2010) · Journal of Biomedical Research · doi:10.1016/s1674-8301(10)60058-9 · Cited by 41
Micro-masters of glioblastoma biology and therapy: increasingly recognized roles for microRNAs
Floyd, D. N., & Purow, B. W. (2014) · Neuro-Oncology · doi:10.1093/neuonc/nou049 · Cited by 41
Cited by
Yang, Y., Liu, X., Cheng, L., Li, L., Wei, Z., Wang, Z., Han, G., Wan, X., Wang, Z., Zhang, J., et al. (2020) · OncoTargets and Therapy · doi:10.2147/ott.s232795 · Cited by 35
Maza, R. M., Barreda-Manso, M. A., Reigada, D., Silván, Á., Muñoz-Galdeano, T., Soto, A., del Águila, Á., & Nieto-Díaz, M. (2022) · Biomedicines · doi:10.3390/biomedicines10071559 · Cited by 12
Metadata
- Authors
- Stojcheva, N., Schechtmann, G., Sass, S., Roth, P., Florea, A.-M., Stefanski, A., Stühler, K., Wolter, M., Müller, N. S., Theis, F. J., Weller, M., Reifenberger, G., & Happold, C.
- Affiliations
- Laboratory of Molecular Neuro-Oncology, Department of Neurology, University Hospital and University of Zurich, Zurich, Switzerland
- Department of Neuropathology, Heinrich Heine University Düsseldorf, Düsseldorf, Germany
- Institute of Computational Biology, Helmholtz Center Munich, German Research Center for Environmental Health, Neuherberg, Germany
- Molecular Proteomics Laboratory, Biological and Medical Research Center (BMFZ), Heinrich Heine University Düsseldorf, Düsseldorf, Germany
- Venue
- Oncotarget
- Publisher
- Impact Journals, LLC
- Published
- 2016-02-12
- Volume
- 7
- Issue
- 11
- Pages
- 12937-12950
- ISSN
- 1949-2553
- PMC
- PMC4914333
- Cited by
- 50
- References
- 60
- Language
- en
About these checks
Registry, retraction, Cites and statistics results are computed, not judged, with one exception: a printed reference that no index lists is read once by a model before it counts as a citation error. Claims are extracted by a model and kept only when their quote appears verbatim in the text; each cited source is then checked, with a model’s help, for whether it says what the claim relies on. Those verdicts can be wrong — read the claim’s quote and the cited source before relying on one.
Statistics and arithmetic are recomputed, not judged.
Confidence bands are shown only for fields calibrated on our annotated test set. None is calibrated yet, so no band is shown.
What counts as a claim ›How we measure confidence ›How we check this ›
Are you an author, or do you see a problem with this page? Request a review
Data sources
Bibliographic data: Semantic Scholar, OpenAlex, Crossref.
Contains information from the Semantic Scholar Academic Graph Datasets, made available under the ODC Attribution License (ODC-BY 1.0).
Semantic Scholar’s data is described in: Kinney, R., et al. (2023). The Semantic Scholar Open Data Platform. arXiv:2301.10140.
