

The DOI matches its Crossref record; 93 of the 93 references it cites were found in a registry or an index.
Clinical Text Summarization: Adapting Large Language Models Can Outperform Human Experts
Open accessPreprint — published as 10.1038/s41591-024-02855-5 · Paper page
Abstract
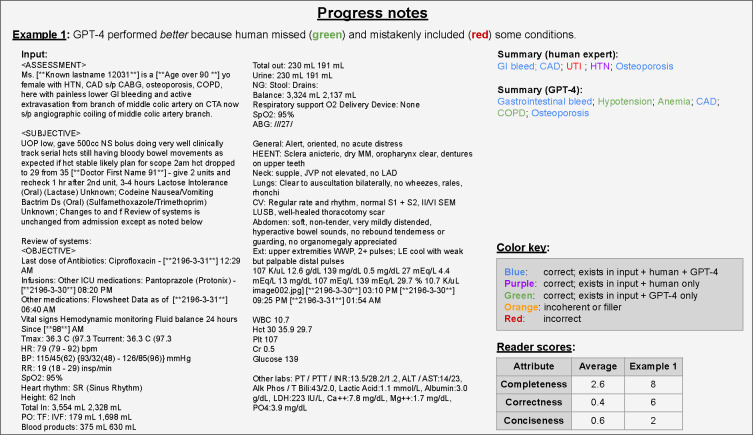
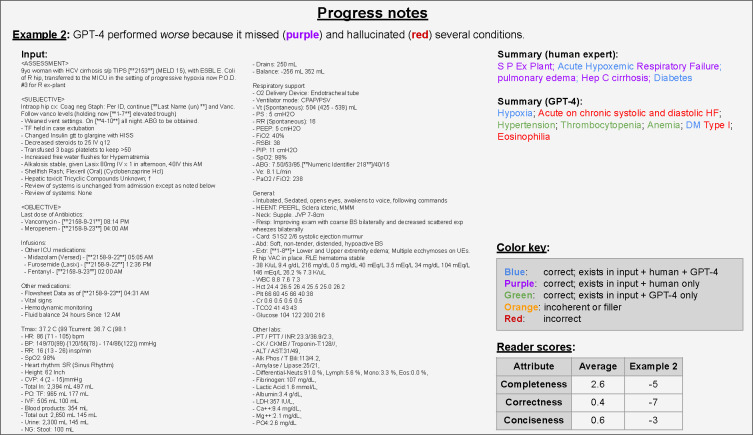
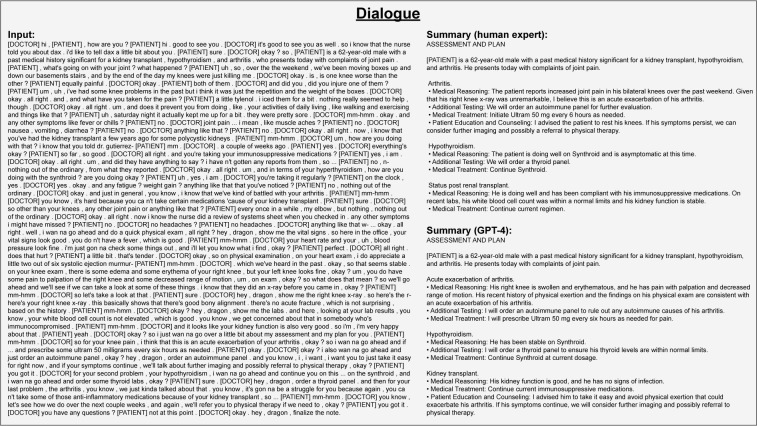
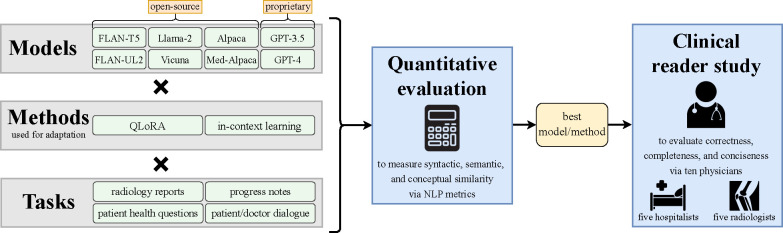
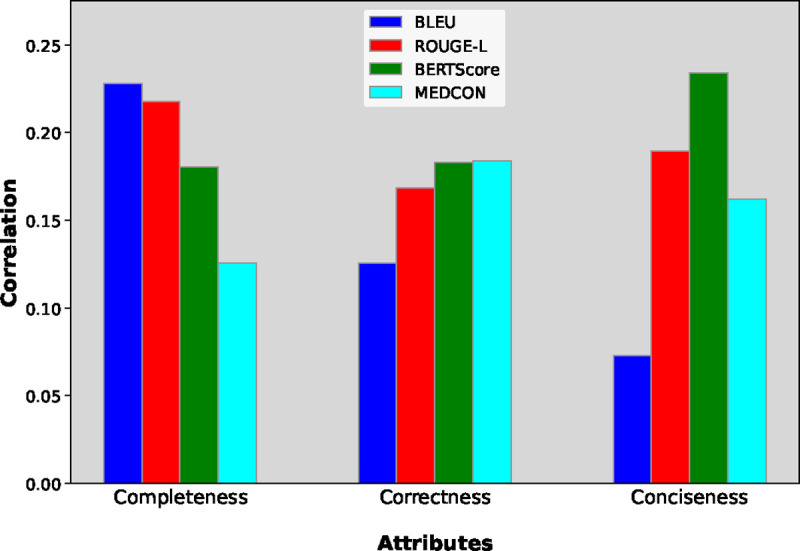
Sifting through vast textual data and summarizing key information from electronic health records (EHR) imposes a substantial burden on how clinicians allocate their time. Although large language models (LLMs) have shown immense promise in natural language processing (NLP) tasks, their efficacy on a diverse range of clinical summarization tasks has not yet been rigorously demonstrated. In this work, we apply domain adaptation methods to eight LLMs, spanning six datasets and four distinct clinical summarization tasks: radiology reports, patient questions, progress notes, and doctor-patient dialogue. Our thorough quantitative assessment reveals trade-offs between models and adaptation methods in addition to instances where recent advances in LLMs may not improve results. Further, in a clinical reader study with ten physicians, we show that summaries from our best-adapted LLMs are preferable to human summaries in terms of completeness and correctness. Our ensuing qualitative analysis highlights challenges faced by both LLMs and human experts. Lastly, we correlate traditional quantitative NLP metrics with reader study scores to enhance our understanding of how these metrics align with physician preferences. Our research marks the first evidence of LLMs outperforming human experts in clinical text summarization across multiple tasks. This implies that integrating LLMs into clinical workflows could alleviate documentation burden, empowering clinicians to focus more on personalized patient care and the inherently human aspects of medicine.
Overview
The claims and statistics of this paper haven’t been checked yet.
Run the check — free, no account needed. It reads the open-access text and checks the sources it cites.
Integrity signals
Registry
Cites
Statistics
Figures
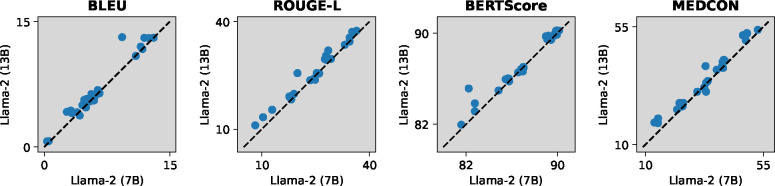
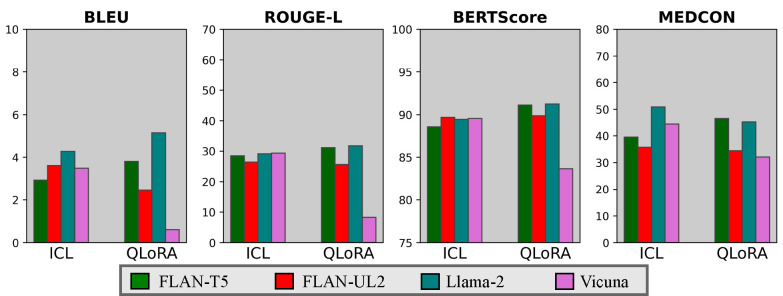
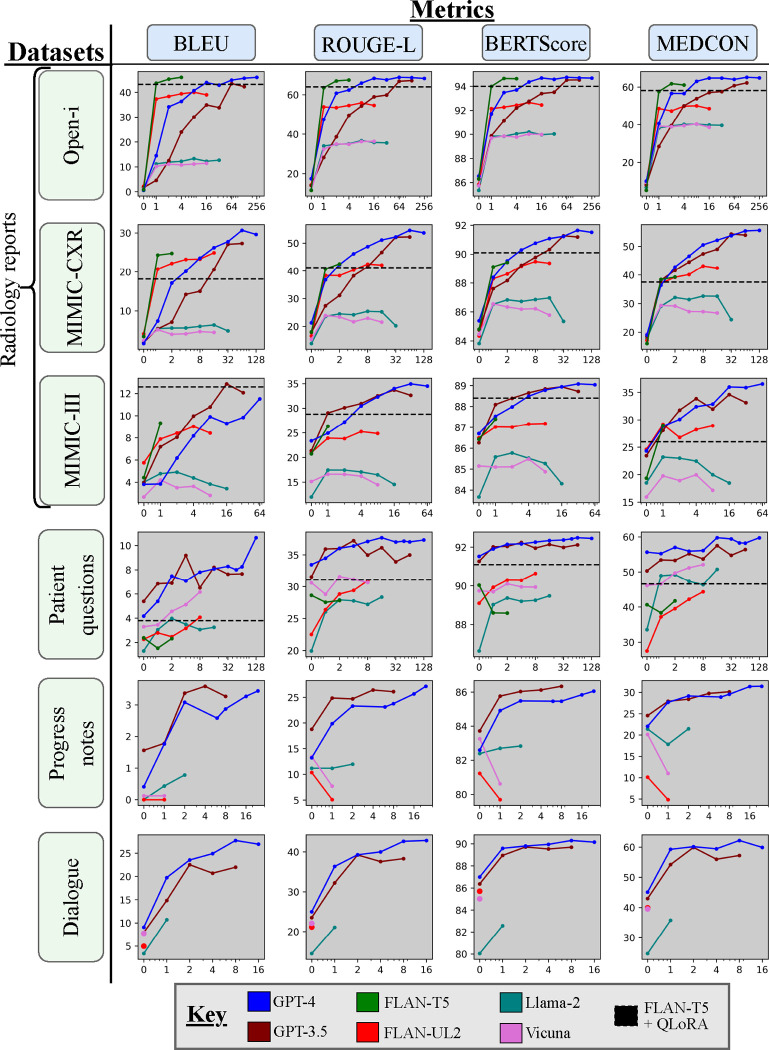
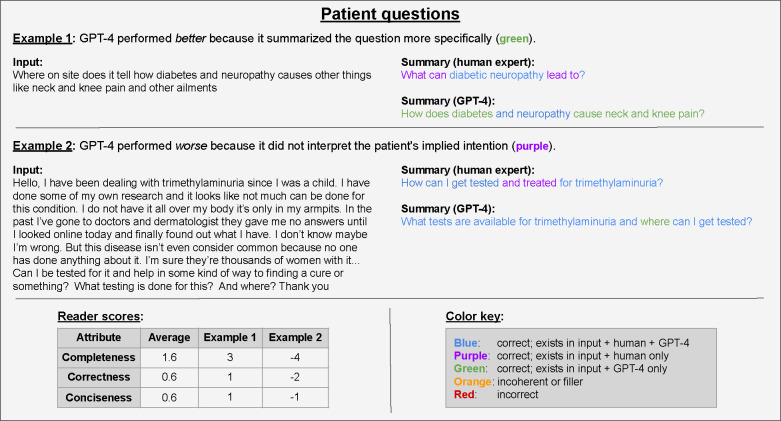
Verification
Claims the paper makes
The claims and statistics of this paper haven’t been checked yet.
Run the check — free, no account needed. It reads the open-access text and checks the sources it cites.
Claims other papers make about this one
Each is checked against this paper’s own text: does it say what the citing paper says it does?
The source backs part of the claim, not all of it — or backs it for a different population, condition or comparison.
In the citing paper
“Most prior research in this field speculates on high-level concerns such as inaccuracy and real-world impacts [43, 44, 54, 86, 93]. However, these studies rarely articulate concrete criteria for when and why LLMs should or should not provide professional advice to users.”
From (A)I Am Not a Lawyer, But...: Engaging Legal Experts towards Responsible LLM Policies for Legal Advice (2024) · cites this paper as [86]
Experimental — accuracy not yet measuredThe cited source says what the claim attributes to it.
In the citing paper
“Domain-specific LLMs, fine-tuned on medical corpora or using knowledge graph embeddings, perform well in clinical text summarization [10, 11], note generation [12, 13], and medical question answering [14].”
From Enhancing hepatopathy clinical trial efficiency: a secure, large language model-powered pre-screening pipeline (2025) · cites this paper as [12]
Self-check
Percentages, sums and reported differences re-computed from the paper’s own numbers.
The self-check needs the paper’s full text.
Citations
Cites
Vaswani, A., Shazeer, N., Parmar, N., Uszkoreit, J., Jones, L., Gomez, A. N., Kaiser, L., & Polosukhin, I. (2017) · arXiv · doi:10.48550/arxiv.1706.03762 · Cited by 120,404 · cited 1×
“Large language models (LLMs) have demonstrated astounding performance, propelled by both the transformer architecture [73] and increasing scales of data and compute, resulting in widespread adoption of models such as ChatGPT [6].”
MethodA guideline of selecting and reporting intraclass correlation coefficients for reliability research
Koo, T. K., & Li, M. Y. (2016) · Journal of Chiropractic Medicine · doi:10.1016/j.jcm.2016.02.012 · Cited by 31,709 · cited 1×
“We estimate intra-reader correlation based on a mean-rating, fixed agreement, two-may mixed effects model [42] using the Pingouin package [80].”
MethodLanguage Models are Few-Shot Learners
Brown, T. B., Mann, B., Ryder, N., Subbiah, M., Kaplan, J., Dhariwal, P., Neelakantan, A., Shyam, P., Sastry, G., Askell, A., et al. (2020) · arXiv · doi:10.48550/arxiv.2005.14165 · Cited by 23,372 · cited 8×
“Large language models (LLMs) have demonstrated astounding performance, propelled by both the transformer architecture [73] and increasing scales of data and compute, resulting in widespread adoption of models such as ChatGPT [6].”
BackgroundMethodInfluentialBLEU: a method for automatic evaluation of machine translation
Papineni, K., Roukos, S., Ward, T., & Zhu, W.-J. (2001) · Proceedings of the 40th Annual Meeting on Association for Computational Linguistics - ACL '02 · doi:10.3115/1073083.1073135 · Cited by 21,344 · cited 8×
“BLEU [52], the simplest metric, calculates the degree of overlap between the reference and generated texts by considering 1- to 4-gram sequences.”
BackgroundInfluentialLoRA: Low-Rank Adaptation of Large Language Models
Hu, E. J., Shen, Y., Wallis, P., Allen-Zhu, Z., Li, Y., Wang, S., Wang, L., & Chen, W. (2021) · arXiv · doi:10.48550/arxiv.2106.09685 · Cited by 13,453 · cited 2×
“Low-rank adaptation (LoRA) [31] has emerged as an effective, lightweight approach for fine-tuning LLMs by altering a small subset of model weights—often < 0.”
BackgroundMethodDecoupled Weight Decay Regularization
Loshchilov, I., & Hutter, F. (2017) · arXiv · doi:10.48550/arxiv.1711.05101 · Cited by 12,522
Exploring the Limits of Transfer Learning with a Unified Text-to-Text Transformer
Raffel, C., Shazeer, N., Roberts, A., Lee, K., Narang, S., Matena, M., Zhou, Y., Li, W., & Liu, P. J. (2019) · arXiv · doi:10.48550/arxiv.1910.10683 · Cited by 10,929 · cited 1×
“The original T5 “text-to-text transfer transformer” model [55] demonstrated excellent performance in transfer learning using the seq2seq architecture.”
MethodTransformers: State-of-the-Art Natural Language Processing
Wolf, T., Debut, L., Sanh, V., Chaumond, J., Delangue, C., Moi, A., Cistac, P., Rault, T., Louf, R., Funtowicz, M., et al. (2020) · Proceedings of the 2020 Conference on Empirical Methods in Natural Language Processing: System Demonstrations · doi:10.18653/v1/2020.emnlp-demos.6 · Cited by 8,741
International Journal of Environmental Research and Public Health
Casariego Vales, E., A.M., C.-C., J.L., L., R.M., M.-P., D., O.-B., M., O.-C., P., R.-S., & F.J., S. (2013) · International Journal of Environmental Research and Public Health · doi:10.3390/ijerph · Cited by 7,742
A Survey on Evaluation of Large Language Models
Chang, Y., Wang, X., Wang, J., Wu, Y., Yang, L., Zhu, K., Chen, H., Yi, X., Wang, C., Wang, Y., et al. (2024) · ACM Transactions on Intelligent Systems and Technology · doi:10.1145/3641289 · Cited by 4,254 · cited 1×
“Beyond the scope of our work, there’s further potential to reduce hallucinations through incorporating checks by a human, checks by another LLM, or using a model ensemble to create a “committee of experts” [11, 39].”
Method
Research works printed but not linked: 5
- [15]Chung H. W., Hou L., Longpre S., Zoph B., Tay Y., Fedus W., Li E., Wang X., Dehghani M., Brahma S., Scaling instruction-finetuned language models. arXiv preprint arXiv:2210.11416 (2022). · arXiv
- [18]Demner-Fushman D., Ananiadou S. & Cohen K. B. The 22nd Workshop on Biomedical Natural Language Processing and BioNLP Shared Tasks in The 22nd Workshop on Biomedical Natural Language Processing and BioNLP Shared Tasks (2023).
- [27]Gao Y., Miller T., Afshar M. & Dligach D. BioNLP Workshop 2023 Shared Task 1A: Problem List Summarization in Proceedings of the 22nd Workshop on Biomedical Language Processing (2023).
- [61]Soldaini L. & Goharian N. Quickumls: a fast, unsupervised approach for medical concept extraction in MedIR workshop, sigir (2016), 1– 4.
- [65]Tay Y., Dehghani M., Tran V. Q., Garcia X., Wei J., Wang X., Chung H. W., Bahri D., Schuster T., Zheng S., Ul2: Unifying language learning paradigms in The Eleventh International Conference on Learning Representations (2022).
Cited by
Sorted by citations
The Good and The Bad: Exploring Privacy Issues in Retrieval-Augmented Generation (RAG)Preprint
Zeng, S., Zhang, J., He, P., Xing, Y., Liu, Y., Han, X., Ren, J., Wang, S., Yin, D., Chang, Y., et al. (2024) · arXiv (Cornell University) · doi:10.48550/arxiv.2402.16893 · Cited by 104
“2.1 Retrieval-Augmented Generation (RAG) Retrieval-augmented generation (RAG), first introduced by Lewis et al. (2020), has emerged as one of the most popular approaches to enhance the generation ability of LLMs (Liu, 2022; Chase, 2022; Van Veen et al., 2023; Ram et al., 2023; Shi et al., 2023).”
BackgroundInfluentialA Survey of Large Language Models in Medicine: Progress, Application, and Challenge
Zhou, H., Liu, F., Gu, B., Zou, X., Huang, J., Wu, J., Li, Y., Chen, S. S., Zhou, P., Liu, J., et al. (2023) · arXiv · doi:10.48550/arxiv.2311.05112 · Cited by 240
“…though using LLMs for clinical report generation or summarization has been proven to be more complete and more accurate than the human counterpart [139], there are still concerns with hallucination, as well as a tendency to approach inputs with a literal view instead of an assumption based…”
BackgroundA Vision-Language Foundation Model to Enhance Efficiency of Chest X-ray InterpretationPreprint
Chen, Z., Varma, M., Xu, J., Paschali, M., Veen, D. V., Johnston, A., Youssef, A., Blankemeier, L., Blüthgen, C., Altmayer, S., et al. (2024) · arXiv (Cornell University) · doi:10.48550/arxiv.2401.12208 · Cited by 238
“…CheXagent generates high-quality reports when compared to other medical FMs. • For findings summarization, as shown in Table 4, CheXagent outperforms LLMs of comparable size on the Rouge-L metric and achieves comparable performance to LLMs with more than twice the number of parameters [80, 81].”
Self-citationA Systematic Survey of Text Summarization: From Statistical Methods to Large Language Models
Zhang, H., Yu, P. S., & Zhang, J. (2025) · ACM Computing Surveys · doi:10.1145/3731445 · Cited by 194
“…[121] Graph LexRank [55], TextRank [148], PACSUM [278], [49] Deep Learning (§3.2) CNN [254], [180], NN-SE [30], T-CONVS2S [157], AttSum [20] RNN/LSTM [40], SummaRuNNer [154], ABS [155], [271], [197], ExtSum-LG [235] RL [165], [245], REFRESH [158], [50] GNN [253], DiscoBert [240], [124], HSG…”
InfluentialA comprehensive survey of large language models and multimodal large language models in medicine
Xiao, H., Zhou, F., Liu, X., Liu, T., Ли, Ж., Liu, X., & Huang, X. (2024) · Information Fusion · doi:10.1016/j.inffus.2024.102888 · Cited by 154
“These models offer promising solutions for medical report generation [19, 20], clinical diagnosis [17, 21], mental health services [22, 23], and various other clinical applications.”
Metadata
- Authors
- Veen, D. V., Uden, C. V., Blankemeier, L., Delbrouck, J.-B., Aali, A., Bluethgen, C., Pareek, A., Polacin, M., Reis, E. P., Seehofnerova, A., Rohatgi, N., Hosamani, P., Collins, W., Ahuja, N., Langlotz, C., Hom, J., Gatidis, S., Pauly, J., & Chaudhari, A.
- Affiliations
- Stanford University (US)
- The University of Texas at Austin (US)
- University Hospital Zurich
- Copenhagen University Hospital (DK)
- University of Zurich (CH)
- Hospital Israelita Albert Einstein (BR)
- Stanford University
- Stanford Medicine (US)
- Corresponding author
- Veen, Dave Van
- ORCID
- Venue
- Nature Medicine
- Published
- 2023-10-30
- Volume
- 30
- Issue
- 4
- Pages
- 1134-1142
- ISSN
- 1078-8956 (ISSN-L)
- PMC
- PMC10635391
- OpenAlex
- W4392193048
- Cited by
- 892
- References
- 71
- Citations by year
- 2026: 342 · 2025: 404 · 2024: 144 · 2023: 2
- FWCI
- 81.57
- Type
- journal article
- Language
- en
- Open access
- green
- doi.org
- Locations
- Nature Medicine (publishedVersion)
- Research Square (acceptedVersion, cc-by)
- PubMed (publishedVersion)
- PubMed Central (acceptedVersion)
- Zurich Open Repository and Archive (University of Zurich) (acceptedVersion)
- arXiv (Cornell University) (submittedVersion, cc-by)
- PubMed Central (submittedVersion, cc-by)
- Zurich Open Repository and Archive (University of Zurich) (submittedVersion)
- arXiv (Cornell University) (cc-by)
- Zurich Open Repository and Archive (University of Zurich)
- Funders
- Foundation for the National Institutes of Health (R01 AR077604, R01EB002524, P41 EB027060, R01 AR079431)
- Gordon and Betty Moore Foundation
- National Institutes of Health (75N92020C00021, 75N92020C00008)
- Agency for Healthcare Research and Quality (R18 HS026886)
- National Heart, Lung, and Blood Institute (75N92020C00008, 75N92020C00021, R01HL155410, R01HL169345, R01HL167974, R01HL157235)
- National Institute of Arthritis and Musculoskeletal and Skin Diseases (R01AR077604, R01AR079431)
- National Institute of Biomedical Imaging and Bioengineering (75N92020C00021, EB 002524, 75N92020C00008, P41EB027060, R01EB002524)
- Topics
- Health Sciences › Medicine › Health Informatics › Artificial Intelligence in Healthcare and Education
- Physical Sciences › Computer Science › Artificial Intelligence › Machine Learning in Healthcare
- Physical Sciences › Computer Science › Artificial Intelligence › Topic Modeling
- Keywords
- large language models, clinical text summarization, LLM adaptation, electronic health records, radiology reports, progress notes, doctor-patient dialogue, patient questions, summary quality, safety analysis, clinical documentation burden
About these checks
Registry, retraction, Cites and statistics results are computed, not judged, with one exception: a printed reference that no index lists is read once by a model before it counts as a citation error. Claims are extracted by a model and kept only when their quote appears verbatim in the text; each cited source is then checked, with a model’s help, for whether it says what the claim relies on. Those verdicts can be wrong — read the claim’s quote and the cited source before relying on one.
Statistics and arithmetic are recomputed, not judged.
Confidence bands are shown only for fields calibrated on our annotated test set. None is calibrated yet, so no band is shown.
What counts as a claim ›How we measure confidence ›How we check this ›
Are you an author, or do you see a problem with this page? Request a review
