

The DOI matches its Crossref record; 59 of the 63 references it cites were found in a registry or an index.
Fooled Twice – People Cannot Detect Deepfakes But Think They Can
Open accessAbstract
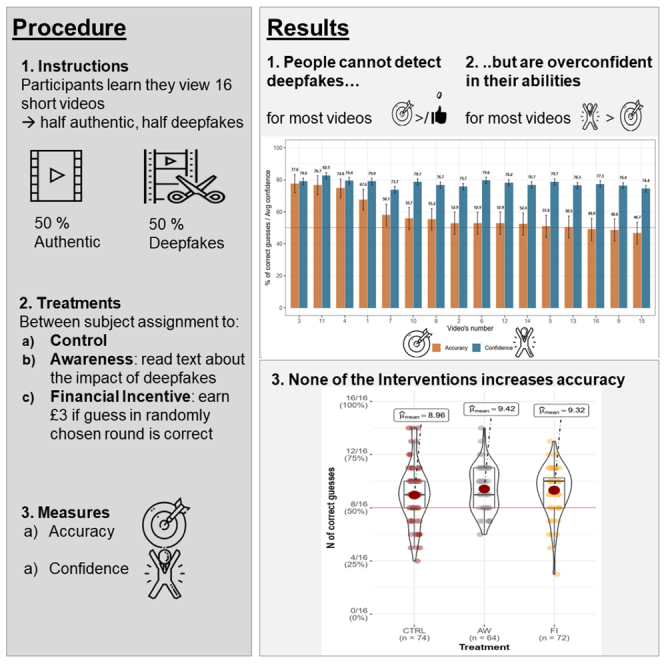
Hyper-realistic manipulation of audio-visual content, i.e., deepfakes, presents a new challenge for establishing veracity of online content. Research on the human impact of deepfakes, addressing both behaviors in response to and cognitive processing of deepfakes, remains sparse. In a pre-registered behavioral experiment ( N = 210), we show that (a) people cannot reliably detect deepfakes, and (b) neither raising awareness nor introducing financial incentives improves their detection accuracy. Zeroing in on the underlying cognitive processes, we find that (c) people are biased towards mistaking deepfakes as authentic videos (rather than vice versa) and (d) overestimate their own detection abilities. Together, these results suggest that people adopt a ``seeing-is-believing'' heuristic for deepfake detection while being overconfident in their (low) detection abilities. The combination renders people particularly susceptible to be influenced by inauthentic deepfake content.
Overview
Integrity signals
Registry
Cites
Statistics
Figures


Verification
Claims the paper makes
Claims other papers make about this one
Each is checked against this paper’s own text: does it say what the citing paper says it does?
In the citing paper
“and are hard for people to distinguish, as shown in studies in the USA, UK, and Netherlands (Dobber et al., 2020; Vaccari and Chadwick, 2020; Köbis et al., 2021; Nightingale and Farid, 2022).”
From On manipulation by emotional AI: UK adults’ views and governance implications (2024) · cites this paper as Köbis et al., 2021
In the citing paper
“studies that show that people are poor at recognizing deepfakes and false content online (Dobber et al., 2020; Vaccari and Chadwick, 2020; Köbis et al., 2021; Nightingale and Farid, 2022; Vaccari et al., 2022)”
From On manipulation by emotional AI: UK adults’ views and governance implications (2024) · cites this paper as Köbis et al., 2021
Citations
Cites
Generative adversarial networks
Goodfellow, I., Pouget-Abadie, J., Mirza, M., Xu, B., Warde-Farley, D., Ozair, S., Courville, A., & Bengio, Y. (2020) · Communications of the ACM · doi:10.1145/3422622 · Cited by 18,384
(2011) · Cited by 14,317
The spread of true and false news online
Vosoughi, S., Roy, D., & Aral, S. (2018) · Science · doi:10.1126/science.aap9559 · Cited by 8,847
Illusion and well‐being: A social psychological perspective on mental health
Taylor, S. E., & Brown, J. D. (1988) · Psychological Bulletin · doi:10.1037/0033-2909.103.2.193 · Cited by 7,814
Kruger, J., & Dunning, D. (1999) · Journal of Personality and Social Psychology · doi:10.1037/0022-3514.77.6.1121 · Cited by 7,731
(2018) · Cited by 3,510
FaceForensics++: Learning to Detect Manipulated Facial Images
Rossler, A., Cozzolino, D., Verdoliva, L., Riess, C., Thies, J., & Niessner, M. (2019) · 2019 IEEE/CVF International Conference on Computer Vision (ICCV) · doi:10.1109/iccv.2019.00009 · Cited by 3,314
Beyond the Turk: Alternative platforms for crowdsourcing behavioral research
Peer, E., Brandimarte, L., Samat, S., & Acquisti, A. (2017) · Journal of Experimental Social Psychology · doi:10.1016/j.jesp.2017.01.006 · Cited by 2,957
The trouble with overconfidence.
Moore, D. A., & Healy, P. J. (2008) · Psychological Review · doi:10.1037/0033-295x.115.2.502 · Cited by 2,358
MesoNet: a Compact Facial Video Forgery Detection Network
Afchar, D., Nozick, V., Yamagishi, J., & Echizen, I. (2018) · 2018 IEEE International Workshop on Information Forensics and Security (WIFS) · doi:10.1109/wifs.2018.8630761 · Cited by 1,872
Cited by
A systematic review of AI literacy scales
Lintner, T. (2024) · npj Science of Learning · doi:10.1038/s41539-024-00264-4 · Cited by 292
Evaluating Large Language Models in Generating Synthetic HCI Research Data: a Case Study
Hämäläinen, P., Tavast, M., & Kunnari, A. (2023) · Proceedings of the 2023 CHI Conference on Human Factors in Computing Systems · doi:10.1145/3544548.3580688 · Cited by 248
Consumer Responses to AI-Generated Charitable Giving Ads
Arango, L., Singaraju, S. P., & Niininen, O. (2023) · Journal of Advertising · doi:10.1080/00913367.2023.2183285 · Cited by 243
Deepfakes: Deceptions, mitigations, and opportunities
Mustak, M., Salminen, J., Mäntymäki, M., Rahman, A., & Dwivedi, Y. K. (2023) · Journal of Business Research · doi:10.1016/j.jbusres.2022.113368 · Cited by 209
Abbas, F., & Taeihagh, A. (2024) · Expert Systems with Applications · doi:10.1016/j.eswa.2024.124260 · Cited by 184
Metadata
- Authors
- Köbis, N., Doležalová, B., & Soraperra, I.
- Affiliations
- Max Planck Institute for Human Development (DE)
- University of Amsterdam (NL)
- Corresponding author
- Köbis, Nils
- Venue
- iScience
- Publisher
- Elsevier BV
- Published
- 2021
- Volume
- 24
- Issue
- 11
- Pages
- 103364-103364
- ISSN
- 2589-0042 (ISSN-L)
- PMC
- PMC8602050
- OpenAlex
- W3208526032
- Cited by
- 194
- References
- 63
- Citations by year
- 2026: 64 · 2025: 48 · 2024: 48 · 2023: 23 · 2022: 11
- FWCI
- 28.45
- Type
- journal article
- Language
- en
- Open access
- gold
- doi.org
- Licence
- cc-by-nc-nd
- Locations
- iScience (publishedVersion, cc-by-nc-nd)
- SSRN Electronic Journal (acceptedVersion)
- PubMed Central (publishedVersion, cc-by-nc-nd)
- PubMed (publishedVersion)
- UvA-DARE (University of Amsterdam) (publishedVersion, cc-by-nc-nd)
- Data Archiving and Networked Services (DANS) (submittedVersion, other-oa)
- DOAJ (DOAJ: Directory of Open Access Journals) (submittedVersion, cc-by-sa)
- Funders
- Universiteit van Amsterdam (202006110906)
- Max-Planck-Institut für Bildungsforschung
- Toulouse School of Economics
- Topics
- Social Sciences › Sociology and Political Science › Misinformation and Its Impacts
- Physical Sciences › Computer Science › Computer Vision and Pattern Recognition › Digital Media Forensic Detection
- Social Sciences › Psychology › Social Psychology › Deception detection and forensic psychology
- Keywords
- deepfakes, deepfake detection, misinformation, overconfidence, belief bias, awareness intervention, financial incentives
About these checks
Registry, retraction, Cites and statistics results are computed, not judged, with one exception: a printed reference that no index lists is read once by a model before it counts as a citation error. Claims are extracted by a model and kept only when their quote appears verbatim in the text; each cited source is then checked, with a model’s help, for whether it says what the claim relies on. Those verdicts can be wrong — read the claim’s quote and the cited source before relying on one.
Statistics and arithmetic are recomputed, not judged.
Confidence bands are shown only for fields calibrated on our annotated test set. None is calibrated yet, so no band is shown.
What counts as a claim ›How we measure confidence ›How we check this ›
Are you an author, or do you see a problem with this page? Request a review
How to cite
Cite CoChat for the checks on this page, and the paper for its own findings.
- This page
- CoChat. (2026). Citation check: Fooled Twice – People Cannot Detect Deepfakes But Think They Can. https://app.cochat.ai/papers/10.2139/ssrn.3832978
- The paper
- Köbis, N., Doležalová, B., & Soraperra, I. (2021). Fooled Twice – People Cannot Detect Deepfakes But Think They Can. iScience. https://doi.org/10.2139/ssrn.3832978
Data sources
Bibliographic data: Semantic Scholar, OpenAlex, Crossref.
Contains information from the Semantic Scholar Academic Graph Datasets, made available under the ODC Attribution License (ODC-BY 1.0).
Semantic Scholar’s data is described in: Kinney, R., et al. (2023). The Semantic Scholar Open Data Platform. arXiv:2301.10140.
