

The DOI matches its Crossref record; 158 of the 158 references it cites were found in a registry or an index.
Human serum albumin homeostasis: a new look at the roles of synthesis, catabolism, renal and gastrointestinal excretion, and the clinical value of serum albumin measurements
Open accessAbstract
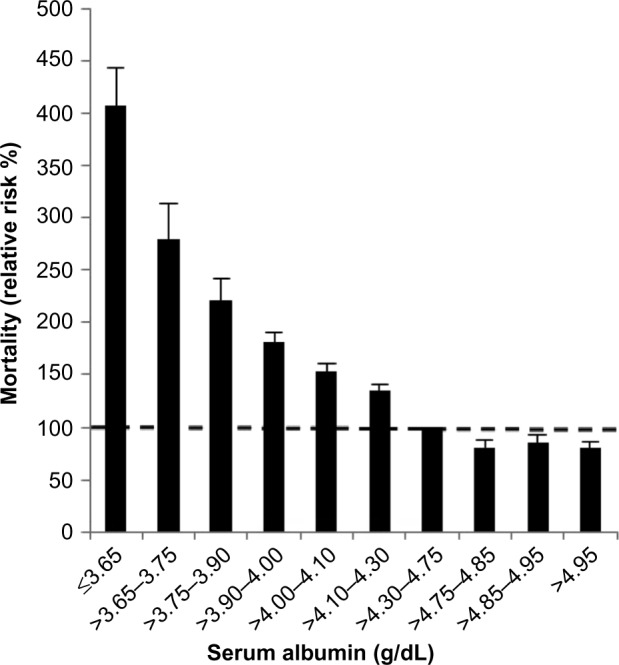
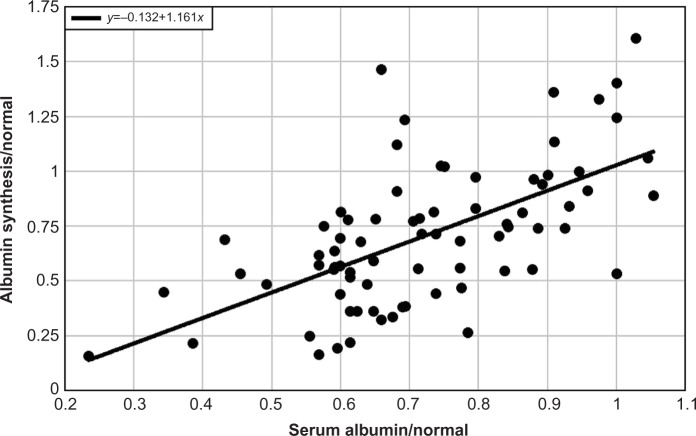
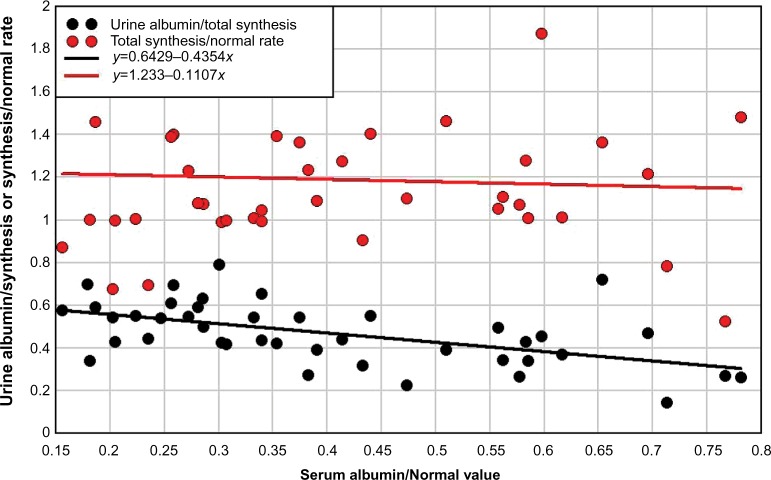
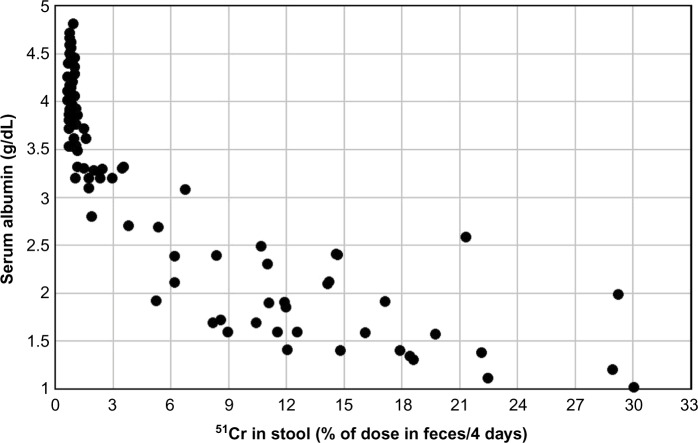
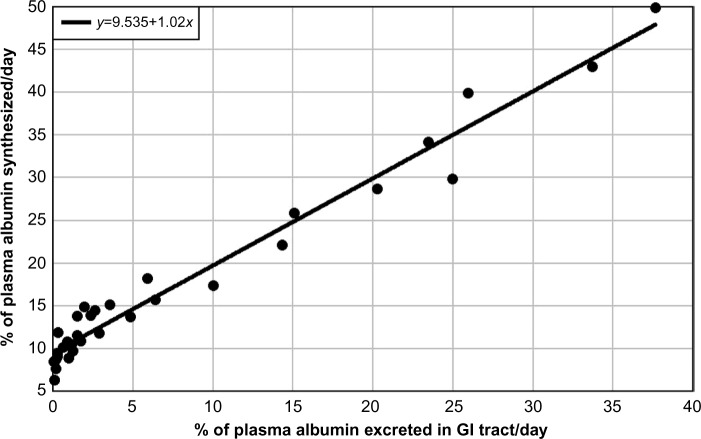
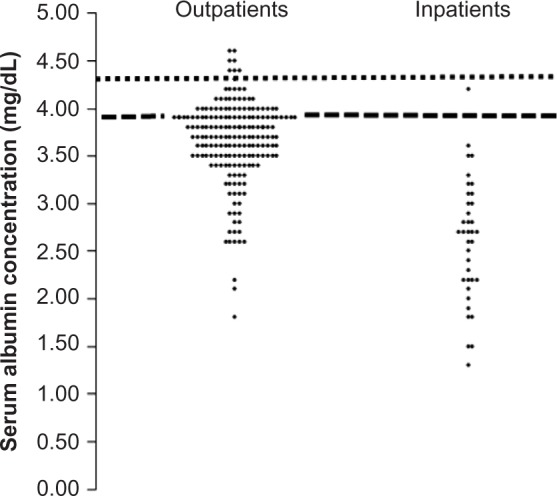
Serum albumin concentration (CP) is a remarkably strong prognostic indicator of morbidity and mortality in both sick and seemingly healthy subjects. Surprisingly, the specifics of the pathophysiology underlying the relationship between CP and ill-health are poorly understood. This review provides a summary that is not previously available in the literature, concerning how synthesis, catabolism, and renal and gastrointestinal clearance of albumin interact to bring about albumin homeostasis, with a focus on the clinical factors that influence this homeostasis. In normal humans, the albumin turnover time of about 25 days reflects a liver albumin synthesis rate of about 10.5 g/day balanced by renal (≈6%), gastrointestinal (≈10%), and catabolic (≈84%) clearances. The acute development of hypoalbuminemia with sepsis or trauma results from increased albumin capillary permeability leading to redistribution of albumin from the vascular to interstitial space. The best understood mechanism of chronic hypoalbuminemia is the decreased albumin synthesis observed in liver disease. Decreased albumin production also accounts for hypoalbuminemia observed with a low-protein and normal caloric diet. However, a calorie- and protein-deficient diet does not reduce albumin synthesis and is not associated with hypoalbuminemia, and CP is not a useful marker of malnutrition. In most disease states other than liver disease, albumin synthesis is normal or increased, and hypoalbuminemia reflects an enhanced rate of albumin turnover resulting either from an increased rate of catabolism (a poorly understood phenomenon) or enhanced loss of albumin into the urine (nephrosis) or intestine (protein-losing enteropathy). The latter may occur with subtle intestinal pathology and hence may be more prevalent than commonly appreciated. Clinically, reduced CP appears to be a result rather than a cause of ill-health, and therapy designed to increase CP has limited benefit. The ubiquitous occurrence of hypoalbuminemia in disease states limits the diagnostic utility of the CP measurement.
Overview
The claims and statistics of this paper haven’t been checked yet.
Run the check — free, no account needed. It reads the open-access text and checks the sources it cites.
Integrity signals
Registry
Cites
Statistics
Figures
Verification
Claims the paper makes
The claims and statistics of this paper haven’t been checked yet.
Run the check — free, no account needed. It reads the open-access text and checks the sources it cites.
Claims other papers make about this one
Each is checked against this paper’s own text: does it say what the citing paper says it does?
The cited source says what the claim attributes to it.
In the citing paper
“The different inflammatory states described in the previous section are all associated with low serum albumin levels.91”
From Hypoalbuminemia: Pathogenesis and Clinical Significance (2019) · cites this paper as [91]
The check wasn’t confident either way, so it gives no verdict — never disputed.
In the citing paper
“In hypoalbuminemia, the ratio between plasma and interstitial serum albumin mass may be normal at 2:3 or slightly increased.91”
From Hypoalbuminemia: Pathogenesis and Clinical Significance (2019) · cites this paper as [91]
Experimental — accuracy not yet measured
Self-check
Percentages, sums and reported differences re-computed from the paper’s own numbers.
The self-check needs the paper’s full text.
Citations
Cites
Intravenous Fluids and Acute Kidney Injury
Ding, X., Cheng, Z., & Qian, Q. (2017) · Blood Purification · doi:10.1159/000452702 · Cited by 6,869
Changes of Intestinal Functions in Liver Cirrhosis
Fukui, H., & Wiest, R. (2016) · Inflammatory Intestinal Diseases · doi:10.1159/000444436 · Cited by 6,820
All About Albumin: Biochemistry, Genetics, and Medical Applications
Peters, T. (1995) · Thammasat University Digital Collections · Cited by 3,089
D'Amico, G., Garcia-Tsao, G., & Pagliaro, L. (2006) · Journal of Hepatology · doi:10.1016/j.jhep.2005.10.013 · Cited by 2,687
Body-mass index and mortality among 1.46 million white adults
Berrington de Gonzalez, A., Hartge, P., Cerhan, J. R., Flint, A. J., Hannan, L., MacInnis, R. J., Moore, S. C., Tobias, G. S., Anton-Culver, H., Freeman, L. B., et al. (2010) · New England Journal of Medicine · doi:10.1056/nejmoa1000367 · Cited by 2,317
On the Absorption of Fluids from the Connective Tissue Spaces
Starling, E. H. (1896) · The Journal of Physiology · doi:10.1113/jphysiol.1896.sp000596 · Cited by 2,126
Body-Mass Index and Mortality among 1.46 Million White Adults
Shephard, R. (2011) · Yearbook of Sports Medicine · doi:10.1016/j.yspm.2011.03.017 · Cited by 1,554
Gupta, D., & Lis, C. G. (2010) · Nutrition Journal · doi:10.1186/1475-2891-9-69 · Cited by 1,485
On the Theory of the Indicator-Dilution Method for Measurement of Blood Flow and Volume
Meier, P., & Zierler, K. L. (1954) · Journal of Applied Physiology · doi:10.1152/jappl.1954.6.12.731 · Cited by 1,282
Microvascular fluid exchange and the revised Starling principle
Levick, J. R., & Michel, C. C. (2010) · Cardiovascular Research · doi:10.1093/cvr/cvq062 · Cited by 1,183
Research works printed but not linked: 3
- [16]Dietary Reference Intakes for Energy, Carbohydrate, Fiber, Fat, Fatty Acids, Cholesterol, Protein, and Amino Acids (Macronutrients): A Report of the Panel on Macronutrients, and the Standing Committee on the Scientific Evaluation of Dietary Reference Intakes Washington, DC National Academies Press 2005
- [92]Takeda Y Reeve EB Studies of the metabolism and distribution of albumin with autologous I131-albumin in healthy men J Lab Clin Med 1963 61 183 202 13984638
- [122]Ballmer PE McNurlan MA Milne E Measurement of albumin synthesis in humans: a new approach employing stable isotopes Am J Physiol 1990 259 6 Pt 1 E797 E803 2260648
Cited by
Sorted by citations
Hypoalbuminemia: Pathogenesis and Clinical Significance
Soeters, P. B., Wolfe, R. R., & Shenkin, A. (2019) · Journal of Parenteral and Enteral Nutrition · doi:10.1002/jpen.1451 · Cited by 1,448
The Discovery and Development of Liraglutide and Semaglutide
Knudsen, L. B., & Lau, J. (2019) · Frontiers in Endocrinology · doi:10.3389/fendo.2019.00155 · Cited by 970
Nutritional Laboratory Markers in Malnutrition
Keller, U. (2019) · Journal of Clinical Medicine · doi:10.3390/jcm8060775 · Cited by 753
Eckart, A., Struja, T., Kutz, A., Baumgartner, A., Baumgartner, T., Zurfluh, S., Neeser, O. L., Huber, A., Stanga, Z. G., Müeller, B., et al. (2019) · The American Journal of Medicine · doi:10.1016/j.amjmed.2019.10.031 · Cited by 727
The Uniqueness of Albumin as a Carrier in Nanodrug Delivery
Spada, A., Emami, J., Tuszyński, J. A., & Lavasanifar, A. (2021) · Molecular Pharmaceutics · doi:10.1021/acs.molpharmaceut.1c00046 · Cited by 619
Hypoalbuminemia as Surrogate and Culprit of Infections
Wiedermann, C. J. (2021) · International Journal of Molecular Sciences · doi:10.3390/ijms22094496 · Cited by 422
Low serum albumin: A neglected predictor in patients with cardiovascular disease
Manolis, A. S., Manolis, T. A., Melita, H., Mikhailidis, D. P., & Manolis, A. S. (2022) · European Journal of Internal Medicine · doi:10.1016/j.ejim.2022.05.004 · Cited by 363
Vitamin D Binding Protein: A Historic Overview
Bouillon, R., Schuit, F., Antonio, L., & Rastinejad, F. (2020) · Frontiers in Endocrinology · doi:10.3389/fendo.2019.00910 · Cited by 316
The cell biology of the hepatocyte: A membrane trafficking machine
Schulze, R. J., Schott, M. B., Casey, C. A., Tuma, P. L., & McNiven, M. A. (2019) · The Journal of Cell Biology · doi:10.1083/jcb.201903090 · Cited by 281
Serum Albumin: A Multifaced Enzyme
Simone, G. D., di Masi, A., & Ascenzi, P. (2021) · International Journal of Molecular Sciences · doi:10.3390/ijms221810086 · Cited by 244
New Insights About Albumin and Liver Disease
Carvalho, J. R., & Machado, M. V. (2018) · Annals of Hepatology · doi:10.5604/01.3001.0012.0916 · Cited by 231
Hariyanto, T. I., Japar, K. V., Kwenandar, F., Damay, V., Siregar, J. I., Lugito, N. P. H., Tjiang, M. M., & Kurniawan, A. (2020) · The American Journal of Emergency Medicine · doi:10.1016/j.ajem.2020.12.076 · Cited by 221
Plasma Albumin and Incident Cardiovascular Disease
Ronit, A., Kirkegaard-Klitbo, D. M., Dohlmann, T. L., Lundgren, J. D., Sabin, C. A., Phillips, A. N., Nordestgaard, B. G., & Afzal, S. (2019) · Arteriosclerosis Thrombosis and Vascular Biology · doi:10.1161/atvbaha.119.313681 · Cited by 205
Gremese, E., Bruno, D., Varriano, V., Perniola, S., Petricca, L., & Ferraccioli, G. (2023) · Journal of Clinical Medicine · doi:10.3390/jcm12186017 · Cited by 233
Levitt, D. G., & Levitt, M. D. (2017) · Clinical and Experimental Gastroenterology · doi:10.2147/ceg.s136803 · Cited by 145
Self-citationProtein-based nanoparticles for drug delivery purposes
Martínez‐López, A. L., Pangua, C., Reboredo, C., Campión, R., Gracia, J. M., & Irache, J. M. (2020) · International Journal of Pharmaceutics · doi:10.1016/j.ijpharm.2020.119289 · Cited by 149
Systemic and ocular fluid compounds as potential biomarkers in age-related macular degeneration
Kersten, E., Paun, C. C., Schellevis, R. L., Hoyng, C. B., Delcourt, C., Lengyel, I., Pető, T., Ueffing, M., Klaver, C. C. W., Dammeier, S., et al. (2017) · Survey of Ophthalmology · doi:10.1016/j.survophthal.2017.05.003 · Cited by 146
Molitoris, B. A., Sandoval, R. M., Yadav, S. P. S., & Wagner, M. C. (2022) · Physiological Reviews · doi:10.1152/physrev.00014.2021 · Cited by 148
Review: Roles of human serum albumin in prediction, diagnoses and treatment of COVID-19
Rabbani, G., & Ahn, S. N. (2021) · International Journal of Biological Macromolecules · doi:10.1016/j.ijbiomac.2021.10.095 · Cited by 139
Engineering interferons and interleukins for cancer immunotherapy
Holder, P. G., Lim, S. A., Huang, C., Sharma, P. A., Dagdas, Y. S., Bulutoglu, B., & Sockolosky, J. T. (2022) · Advanced Drug Delivery Reviews · doi:10.1016/j.addr.2022.114112 · Cited by 130
Role of Albumin in Accumulation and Persistence of Tumor-Seeking Cyanine Dyes
Usama, S. M., Park, G. K., Nomura, S., Baek, Y., Choi, H. S., & Burgess, K. (2020) · Bioconjugate Chemistry · doi:10.1021/acs.bioconjchem.9b00771 · Cited by 124
Ward, E. S., Gelinas, D. F., Dreesen, E., Santbergen, J. V., Andersen, J. T., Silvestri, N. J., Kiss, J. E., Sleep, D., Rader, D. J., Kastelein, J. J. P., et al. (2022) · Frontiers in Immunology · doi:10.3389/fimmu.2022.892534 · Cited by 133
Rabbani, N., & Thornalley, P. J. (2021) · Redox Biology · doi:10.1016/j.redox.2021.101920 · Cited by 124
A revised international prognostic score system for Waldenström’s macroglobulinemia
Kastritis, E., Morel, P., Duhamel, A., Gavriatopoulou, M., Kyrtsonis, M. C., Durot, É., Symeonidis, A. S., Laribi, K., Hatjiharissi, E., Ysebaert, L., et al. (2019) · Leukemia · doi:10.1038/s41375-019-0431-y · Cited by 114
Lymphatic targeting by albumin-hitchhiking: Applications and optimisation
Abdallah, M., Müllertz, O. O., Styles, I. K., Mörsdorf, A., Quinn, J. F., Whittaker, M. R., & Trevaskis, N. L. (2020) · Journal of Controlled Release · doi:10.1016/j.jconrel.2020.07.046 · Cited by 115
Nutrition Screening vs Nutrition Assessment: What’s the Difference?
Correia, M. I. T. D. (2017) · Nutrition in Clinical Practice · doi:10.1177/0884533617719669 · Cited by 120
Hsieh, Y., Tsai, M., Tu, S., & Hsieh, M. (2017) · JAMA Ophthalmology · doi:10.1001/jamaophthalmol.2017.5202 · Cited by 107
On the Mechanisms of Uptake of Tumor-Seeking Cyanine Dyes
Usama, S. M., Lin, C., & Burgess, K. (2018) · Bioconjugate Chemistry · doi:10.1021/acs.bioconjchem.8b00708 · Cited by 107
Hepatic FcRn regulates albumin homeostasis and susceptibility to liver injury
Pyzik, M., Räth, T., Kuo, T. T., Win, S., Baker, K., Hubbard, J. J., Grenha, R., Gandhi, A. K., Krämer, T. D., Mezo, A. R., et al. (2017) · Proceedings of the National Academy of Sciences · doi:10.1073/pnas.1618291114 · Cited by 106
Kong, C., Elderman, M. E., Cheng, L., de Haan, B. J., Nauta, A., & de Vos, P. (2019) · Molecular Nutrition & Food Research · doi:10.1002/mnfr.201900303 · Cited by 104
Albumin: a comprehensive review and practical guideline for clinical use
Abedi, F., Zarei, B., & Elyasi, S. (2024) · European Journal of Clinical Pharmacology · doi:10.1007/s00228-024-03664-y · Cited by 104
Twisted intramolecular charge transfer (TICT) based fluorescent probes and imaging agents
Wu, Y., Wang, H.-M., Hu, X., Zang, Y., Li, J. X., Han, H., He, X., Lewis, S. E., Ismail, H. M., & James, T. D. (2025) · Chemical Society Reviews · doi:10.1039/d3cs01118f · Cited by 101
Chebl, R. B., Jamali, S., Sabra, M., Safa, R., Berbari, I., Shami, A., Makki, M. H., Tamim, H., & Dagher, G. A. (2020) · Frontiers in Medicine · doi:10.3389/fmed.2020.550182 · Cited by 98
Predictive value of serum albumin levels on cancer survival: a prospective cohort study
Tang, Q., Li, X., & Sun, C. (2024) · Frontiers in Oncology · doi:10.3389/fonc.2024.1323192 · Cited by 93
Yu, Y. S., Liu, Y., Ling, X., Huang, R., Wang, S., Min, J., Xiao, J. Z., Zhang, Y., & Wang, Z. (2020) · BioMed Research International · doi:10.1155/2020/7458451 · Cited by 91
Ocskay, K., Vinkó, Z., Németh, D. I., Szabó, L., Bajor, J., Gódi, S., Sarlós, P., Czakó, L., Izbéki, F., Hamvas, J., et al. (2021) · Scientific Reports · doi:10.1038/s41598-021-03449-8 · Cited by 87
Ozen, A. O., & Lenardo, M. J. (2023) · New England Journal of Medicine · doi:10.1056/nejmra2301594 · Cited by 90
Albumin-based drug designs for pharmacokinetic modulation
Pilati, D., & Howard, K. A. (2020) · Expert Opinion on Drug Metabolism & Toxicology · doi:10.1080/17425255.2020.1801633 · Cited by 84
Zhu, L., Chen, M., & Lin, X. (2019) · Bioscience Reports · doi:10.1042/bsr20190881 · Cited by 80
Asif, A., Park, S. H., Soomro, A. M., Khalid, M. A. U., Salih, A. R. C., Kang, B., Ahmed, F., Kim, K. H., & Choi, K. H. (2021) · Journal of Industrial and Engineering Chemistry · doi:10.1016/j.jiec.2021.03.035 · Cited by 73
Lantigua, D., Nguyen, M. A., Wu, X., Suvarnapathaki, S., Kwon, S., Gavin, W. E., & Camci‐Unal, G. (2020) · Soft Matter · doi:10.1039/d0sm00977f · Cited by 69
Slipping Through the Pores: Hypoalbuminemia and Albumin Loss During Hemodialysis
Kalantar‐Zadeh, K., Ficociello, L., Bazzanella, J., Mullon, C. J. P., & Anger, M. S. (2021) · International Journal of Nephrology and Renovascular Disease · doi:10.2147/ijnrd.s291348 · Cited by 69
Albumin is an interface between blood plasma and cell membrane, and not just a sponge
van de Wouw, J., & Joles, J. A. (2021) · Clinical Kidney Journal · doi:10.1093/ckj/sfab194 · Cited by 80
Wada, H., Dohi, T., Miyauchi, K., Shitara, J., Endo, H., Doi, S., Naito, R., Konishi, H., Tsuboi, S., Ogita, M., et al. (2017) · Heart and Vessels · doi:10.1007/s00380-017-0981-8 · Cited by 68
Bacteremia associated with pressure ulcers: a prospective cohort study
Complex Wounds Working Group, Espejo, E., Andrés, M., Borrallo, R. M., Padilla, E., Garcia-Restoy, E., & Bella, F. (2018) · European Journal of Clinical Microbiology & Infectious Diseases · doi:10.1007/s10096-018-3216-8 · Cited by 72
Novel insights about albumin in cardiovascular diseases: Focus on heart failure
Zoanni, B., Brioschi, M., Mallia, A., Gianazza, E., Eligini, S., Carini, M., Aldini, G., & Banfi, C. (2021) · Mass Spectrometry Reviews · doi:10.1002/mas.21743 · Cited by 70
In situ cellular hitchhiking of nanoparticles for drug delivery
Udofa, E., & Zhao, Z. (2023) · Advanced Drug Delivery Reviews · doi:10.1016/j.addr.2023.115143 · Cited by 67
Exploiting cancer’s drinking problem: regulation and therapeutic potential of macropinocytosis
Puccini, J., Badgley, M. A., & Bar‐Sagi, D. (2021) · Trends in cancer · doi:10.1016/j.trecan.2021.09.004 · Cited by 67
Viana-Llamas, M. C., Arroyo‐Espliguero, R., Silva, J. A., Uribe-Heredia, G., Nuñez-Gil, I. J., García-Magallón, B., Torán-Martínez, C. G., Castillo-Sandoval, A., Díaz‐Caraballo, E., Rodríguez-Guinea, I., et al. (2021) · Medicina Clínica · doi:10.1016/j.medcli.2020.12.018 · Cited by 65
Overview of Albumin Physiology and its Role in Pediatric Diseases
Chen, C. B., Hammo, B., Barry, J., & Radhakrishnan, K. R. (2021) · Current Gastroenterology Reports · doi:10.1007/s11894-021-00813-6 · Cited by 64
Chaves, O. A., Loureiro, R. J. S., Costa-Tuna, A., Almeida, Z. L., Pina, J., Brito, R. M. M., & Serpa, C. (2023) · ACS Food Science & Technology · doi:10.1021/acsfoodscitech.3c00125 · Cited by 63
The Potential of Albuminuria as a Biomarker of Diabetic Complications
Raja, P., Maxwell, A. P., & Brazil, D. P. (2020) · Cardiovascular Drugs and Therapy · doi:10.1007/s10557-020-07035-4 · Cited by 71
Hendershot, L. M., Buck, T. M., & Brodsky, J. L. (2023) · Journal of Molecular Biology · doi:10.1016/j.jmb.2023.168418 · Cited by 65
Effect of hypoalbuminemia on drug pharmacokinetics
Idasiak‐Piechocka, I., Lewandowski, D., Świgut, W., Kalinowski, J., Mikosza, K., Suchowiejski, P., Szałek, E., Karbownik, A., & Miedziaszczyk, M. (2025) · Frontiers in Pharmacology · doi:10.3389/fphar.2025.1546465 · Cited by 61
Wada, H., Dohi, T., Miyauchi, K., Doi, S., Naito, R., Konishi, H., Tsuboi, S., Ogita, M., Kasai, T., Okazaki, S., et al. (2017) · Circulation Journal · doi:10.1253/circj.cj-17-0124 · Cited by 61
Hypoalbuminemia is a frequent marker of increased mortality in cardiogenic shock
Jäntti, T., Tarvasmäki, T., Harjola, V., Parissis, J., Pulkki, K. J., Javanainen, T., Tolppanen, H., Jurkko, R., Hongisto, M., Kataja, A., et al. (2019) · PLoS ONE · doi:10.1371/journal.pone.0217006 · Cited by 61
Fanetti, G., Polesel, J., Fratta, E., Muraro, E., Lupato, V., Alfieri, S., Gobitti, C., Minatel, E., Matrone, F., Caroli, A., et al. (2021) · Nutrients · doi:10.3390/nu13041277 · Cited by 60
Wang, Y., Li, C.-Y., Wang, W., Wang, J., Li, J., Qian, S., Cai, C., & Liu, Y. (2022) · Journal of Inflammation Research · doi:10.2147/jir.s347161 · Cited by 58
Huang, S.-S., Lin, J.-Y., Chen, W.-S., Liu, M., Cheng, C., Cheng, M., & Wang, C. (2019) · International Journal of Infectious Diseases · doi:10.1016/j.ijid.2019.05.030 · Cited by 57
Albumin protects the liver from tumor necrosis factor α‐induced immunopathology
Duran‐Güell, M., Flores‐Costa, R., Casulleras, M., López‐Vicario, C., Titos, E., Díaz, A., Alcaraz‐Quiles, J., Horrillo, R., Costa, M., Fernández, J., et al. (2021) · The FASEB Journal · doi:10.1096/fj.202001615rrr · Cited by 58
Zelnick, L. R., Batacchi, Z. O., Ahmad, I., Dighe, A., Little, R. R., Trence, D. L., Hirsch, I. B., & de Boer, I. H. (2020) · Diabetes Care · doi:10.2337/dc20-0915 · Cited by 55
Qirjazi, E., Salerno, F. R., Akbari, A., Hur, L., Penny, J. D., Scholl, T. J., & McIntyre, C. W. (2020) · Nephrology Dialysis Transplantation · doi:10.1093/ndt/gfaa036 · Cited by 54
Influence of Diets with Varying Essential/Nonessential Amino Acid Ratios on Mouse Lifespan
Romano, C., Corsetti, G., Flati, V., Pasini, E., Picca, A., Calvani, R., Marzetti, E., & Dioguardi, F. S. (2019) · Nutrients · doi:10.3390/nu11061367 · Cited by 53
Bakaloudi, D. R., Siargkas, A., Poulia, K., Dounousi, E. C., & Chourdakis, M. (2020) · Nutrients · doi:10.3390/nu12103071 · Cited by 58
Use of albumin infusion for cirrhosis-related complications: An international position statement
Bai, Z., Méndez‐Sánchez, N., Romeiro, F. G., Mancuso, A., Philips, C. A., Tacke, F., Başaranoğlu, M., Primignani, M., Ibrahim, M., Wong, Y. J., et al. (2023) · JHEP Reports · doi:10.1016/j.jhepr.2023.100785 · Cited by 51
Interaction of Mycotoxin Alternariol with Serum Albumin
Fliszár-Nyúl, E., Lemli, B., Kunsági‐Máté, S., Dellafiora, L., Dall’Asta, C., Cruciani, G., Pethö, G., & Poór, M. (2019) · International Journal of Molecular Sciences · doi:10.3390/ijms20092352 · Cited by 50
Peng, W., Zhang, C., Wang, Z., & Yang, W. (2019) · Biomarkers · doi:10.1080/1354750x.2019.1652686 · Cited by 50
Guo, Y., Wei, L., Patel, S. H., Lopez, G., Grogan, M. M., Li, M., Haddad, T. C., Johns, A. C., Ganesan, L. P., Yang, Y., et al. (2022) · Clinical Lung Cancer · doi:10.1016/j.cllc.2021.12.010 · Cited by 49
You, Y., Park, J. S., Min, J. H., Yoo, I. S., Jeong, W., Cho, Y., Ryu, S., Lee, J. W., Kim, S. W., Cho, S., et al. (2018) · Resuscitation · doi:10.1016/j.resuscitation.2018.08.003 · Cited by 49
Chang, S.-Y., Voellinger, J. L., Van Ness, K. P., Chapron, B., Shaffer, R. M., Neumann, T., White, C. C., Kavanagh, T. J., Kelly, E. J., & Eaton, D. L. (2017) · Toxicology in Vitro · doi:10.1016/j.tiv.2017.01.007 · Cited by 49
Garibotto, G., Sofia, A., Parodi, E. L., Ansaldo, F., Bonanni, A., Picciotto, D., Signori, A., Vettore, M., Tessari, P., & Verzola, D. (2018) · Kidney International Reports · doi:10.1016/j.ekir.2018.01.003 · Cited by 47
Njoku, K., Barr, C. E., Ramchander, N. C., & Crosbie, E. J. (2022) · PLoS ONE · doi:10.1371/journal.pone.0272232 · Cited by 50
Ramadori, G. P. (2023) · International Journal of Molecular Sciences · doi:10.3390/ijms24076658 · Cited by 48
Nano- and Microencapsulation - Techniques and Applications
Abu-Thabit, N. Y. (2020) · IntechOpen eBooks · doi:10.5772/intechopen.88590 · Cited by 46
Deveci, B., & Gazı, E. (2020) · Angiology · doi:10.1177/0003319720959985 · Cited by 45
Albumin in adult cardiac surgery: a narrative review
Hanley, C., Callum, J. L., Karkouti, K., & Bartoszko, J. M. (2021) · Canadian Journal of Anesthesia/Journal canadien d anesthésie · doi:10.1007/s12630-021-01991-7 · Cited by 47
Cyanine–Gemcitabine Conjugates as Targeted Theranostic Agents for Glioblastoma Tumor Cells
Jiang, Z., Pflug, K. M., Usama, S. M., Kuai, D., Yan, X., Sitcheran, R., & Burgess, K. (2019) · Journal of Medicinal Chemistry · doi:10.1021/acs.jmedchem.9b01147 · Cited by 45
Andrews-Trevino, J. Y., Webb, P., Shively, G., Kablan, A., Baral, K. P., Davis, D., Paudel, K. P., Shrestha, R., Pokharel, A., Acharya, S., et al. (2020) · American Journal of Clinical Nutrition · doi:10.1093/ajcn/nqaa397 · Cited by 45
Hu, Q., Yao, B., Owyong, T. C., Prashanth, S., Wang, C., Zhang, X., Wong, W. W. H., Tang, Y., & Hong, Y. (2021) · Chemistry - An Asian Journal · doi:10.1002/asia.202100180 · Cited by 45
Retinoids as anti-cancer agents and their mechanisms of action.
Jin, Y. H., Teh, S. S., Lau, H. L. N., Xiao, J., & Mah, S. H. (2022) · PubMed Central · Cited by 42
Applications and pitfalls of hemoglobin A1C and alternative methods of glycemic monitoring
Lundholm, M. D., Emanuele, M. A., Ashraf, A., & Nadeem, S. (2020) · Journal of Diabetes and its Complications · doi:10.1016/j.jdiacomp.2020.107585 · Cited by 42
Badawy, M. A., Yasseen, B. A., El-Messiery, R. M., Abdel-Rahman, E. A., Elkhodiry, A. A., Kamel, A. G., El-sayed, H., Shedra, A. M., Hamdy, R., Zidan, M., et al. (2021) · eLife · doi:10.7554/elife.69417 · Cited by 40
Comparing assessment tools for detecting undernutrition in patients with liver cirrhosis
McFarlane, M. J., Hammond, C., Roper, T., Mukarati, J., Ford, R., Burrell, J., Gordon, V., & Burch, N. (2017) · Clinical Nutrition ESPEN · doi:10.1016/j.clnesp.2017.10.009 · Cited by 40
Albumin Neutralizes Hydrophobic Toxins and Modulates Candida albicans Pathogenicity
Austermeier, S., Pekmezovic, M. G., Porschitz, P., Lee, S., Kichik, N., Moyes, D. L., Ho, J., Kotowicz, N. K., Naglik, J. R., Hube, B., et al. (2021) · mBio · doi:10.1128/mbio.00531-21 · Cited by 43
SARS-CoV-2 Bound Human Serum Albumin and Systemic Septic Shock
Johnson, A. S., Fatemi, R., & Winlow, W. (2020) · Frontiers in Cardiovascular Medicine · doi:10.3389/fcvm.2020.00153 · Cited by 38
Zhang, B., Wei, Z., Gu, C., Yao, Y., Xue, J., Zhu, H., Kannan, K., Sun, H., & Zhang, T. (2022) · Environmental Science & Technology · doi:10.1021/acs.est.2c05925 · Cited by 38
Heme Scavenging and Delivery: The Role of Human Serum Albumin
Simone, G. D., Varricchio, R., Ruberto, T. F., di Masi, A., & Ascenzi, P. (2023) · Biomolecules · doi:10.3390/biom13030575 · Cited by 37
Uses and misuses of albumin during resuscitation and in the neonatal intensive care unit
Shalish, W., Olivier, F., Aly, H. Z., & SantʼAnna, G. (2017) · Seminars in Fetal and Neonatal Medicine · doi:10.1016/j.siny.2017.07.009 · Cited by 38
Kalyan, S., Goshtesabi, A., Sarray, S., Joannou, A., & Almawi, W. Y. (2018) · BMJ Open · doi:10.1136/bmjopen-2018-021860 · Cited by 38
Fisher, A., Srikusalanukul, W., Fisher, L., & Smith, P. N. (2017) · Clinical Interventions in Aging · doi:10.2147/cia.s141097 · Cited by 38
Ngwuluka, N. C., Abu-Thabit, N. Y., Uwaezuoke, O. J., Erebor, J. O., Ilomuanya, M. O., Mohamed, R. R., Soliman, S. M. A., Elella, M. H. A., & Ebrahim, N. A. A. (2021) · IntechOpen eBooks · doi:10.5772/intechopen.94856 · Cited by 38
Suri, A., Mould, D. R., Song, G. C., Collins, G. P., Endres, C. J., Gómez-Navarro, J., & Venkatakrishnan, K. (2019) · Clinical Pharmacology & Therapeutics · doi:10.1002/cpt.1530 · Cited by 35
Membrane Innovation in Dialysis
Boschetti‐de‐Fierro, A., Beck, W., Hildwein, H., Krause, B., Storr, M., & Zweigart, C. (2017) · Contributions to nephrology · doi:10.1159/000479259 · Cited by 36
Da-silva, F., Boulenc, X., Vermet, H., Compigne, P., Gerbal‐Chaloin, S., Daujat‐Chavanieu, M., Klieber, S., & Poulin, P. (2018) · Journal of Pharmaceutical Sciences · doi:10.1016/j.xphs.2018.03.001 · Cited by 36
Ward, R. A., Beck, W., Bernardo, A. A., Alves, F. C., Stenvinkel, P., & Lindholm, B. (2018) · Nephrology Dialysis Transplantation · doi:10.1093/ndt/gfy236 · Cited by 36
Elli, L., Topa, M., & Rimondi, A. (2020) · Current Opinion in Gastroenterology · doi:10.1097/mog.0000000000000629 · Cited by 36
Wang, X., Wang, J., Wu, S., Ni, Q., & Chen, P. (2021) · International Journal of General Medicine · doi:10.2147/ijgm.s328882 · Cited by 36
Review Article: Albumin and Its Role in Inflammatory Bowel Disease: The Old, the New, and the Future
Cameron, K., Nguyen, A. L., Gibson, D. J., Ward, M. G., Sparrow, M., & Gibson, P. R. (2025) · Journal of Gastroenterology and Hepatology · doi:10.1111/jgh.16895 · Cited by 35
Analysis of factors affecting the prognosis of COVID-19 patients and viral shedding duration
Han, J., Shi, L., Xie, Y. F., Zhang, Y.-J., Huang, S.-P., Li, J., Wang, H.-R., & Shao, S.-F. (2020) · Epidemiology and Infection · doi:10.1017/s0950268820001399 · Cited by 35
Fluorescent kinase inhibitors as probes in cancer
Usama, S. M., Zhao, B., & Burgess, K. (2021) · Chemical Society Reviews · doi:10.1039/d1cs00017a · Cited by 35
Metadata
- Authors
- Levitt, D., & Levitt, M.
- Affiliations
- University of Minnesota (US)
- Veterans Health Administration (US)
- Corresponding author
- Levitt, Michael
- Venue
- International Journal of General Medicine
- Publisher
- Informa UK Limited
- Published
- 2016-07
- Volume
- Volume 9
- Pages
- 229-255
- ISSN
- 1178-7074 (ISSN-L)
- PMC
- PMC4956071
- OpenAlex
- W2488911476
- Cited by
- 763
- References
- 156
- Citations by year
- 2026: 97 · 2025: 91 · 2024: 88 · 2023: 101 · 2022: 96 · 2021: 117 · 2020: 73 · 2019: 49 · 2018: 27 · 2017: 20 · 2016: 3
- FWCI
- 34.47
- Type
- journal article
- Language
- en
- Open access
- gold
- doi.org
- Licence
- Locations
- International Journal of General Medicine (publishedVersion, cc-by-nc)
- PubMed Central (publishedVersion, cc-by-nc)
- PubMed (publishedVersion)
- Dove Medical Press (Taylor and Francis Group) (submittedVersion, cc-by-nc)
- Topics
- Health Sciences › Nursing › Nutrition and Dietetics › Clinical Nutrition and Gastroenterology
- Life Sciences › Biochemistry, Genetics and Molecular Biology › Molecular Biology › Protein Interaction Studies and Fluorescence Analysis
- Health Sciences › Medicine › Hepatology › Liver Disease and Transplantation
- Keywords
- human serum albumin, hypoalbuminemia, albumin synthesis, albumin catabolism, albumin turnover, protein-losing enteropathy, nephrotic syndrome, liver disease, malnutrition, prognostic factors
About these checks
Registry, retraction, Cites and statistics results are computed, not judged, with one exception: a printed reference that no index lists is read once by a model before it counts as a citation error. Claims are extracted by a model and kept only when their quote appears verbatim in the text; each cited source is then checked, with a model’s help, for whether it says what the claim relies on. Those verdicts can be wrong — read the claim’s quote and the cited source before relying on one.
Statistics and arithmetic are recomputed, not judged.
Confidence bands are shown only for fields calibrated on our annotated test set. None is calibrated yet, so no band is shown.
What counts as a claim ›How we measure confidence ›How we check this ›
Are you an author, or do you see a problem with this page? Request a review
