

The DOI matches its Crossref record; 1 of the 1 references it cites were found in a registry or an index.
Endogenous H2O2 Self-Replenishment and Sustainable Cascades Enhance the Efficacy of Sonodynamic Therapy
Overview
The claims and statistics of this paper haven’t been checked yet.
Run the check — free, no account needed. It reads the open-access text and checks the sources it cites.
Integrity signals
Registry
Cites
Statistics
Figures
Verification
Claims the paper makes
The claims and statistics of this paper haven’t been checked yet.
Run the check — free, no account needed. It reads the open-access text and checks the sources it cites.
Claims other papers make about this one
Each is checked against this paper’s own text: does it say what the citing paper says it does?
In the citing paper
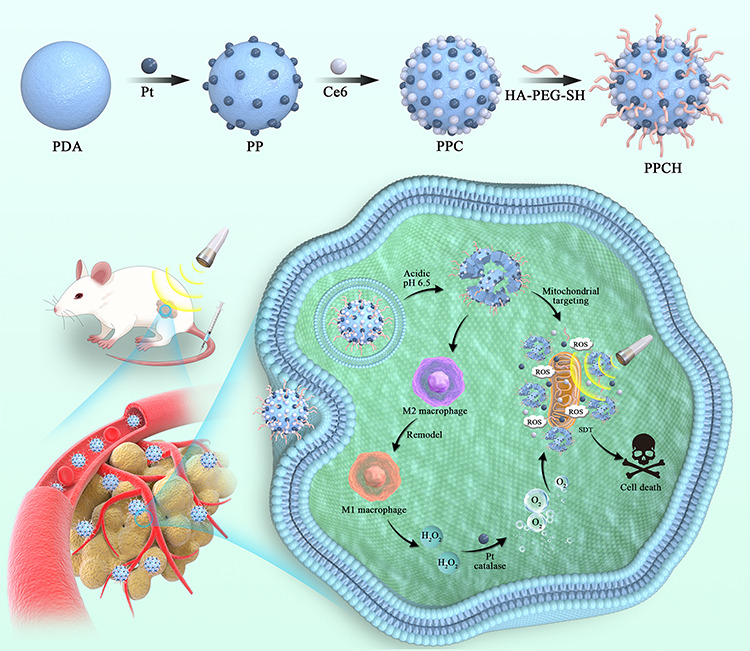
“Nanozyme-assisted sonodynamic therapy | Low-intensity ultrasound and catalytic O2 | Hyaluronic acid anchored nanozyme for SDT | Long circulation and targeting; ultrasound triggers SDT; nanozyme converts H2O2 to O2 to relieve hypoxia; macrophage repolarization to M1”
From Overcoming tumor microenvironment barriers: transformable and bioinspired nanomedicine strategies for deep tumor penetration (2026) · cites this paper as [103]
In the citing paper
“Nanozyme-assisted sonodynamic formulations repolarize tumor-associated macrophages to M1 and convert H₂O₂ to O₂ to relieve hypoxia, amplifying low-intensity ultrasound therapy and improving distribution.”
From Overcoming tumor microenvironment barriers: transformable and bioinspired nanomedicine strategies for deep tumor penetration (2026) · cites this paper as [103]
In the citing paper
“pH and MMP-9 responsive liposomes co-delivering the galectin-3 inhibitor GB1107, the PD-1 inhibitor BMS-1166, and enzalutamide to remodel the immune TME and reverse T-cell exhaustion [103, 104].”
From Overcoming tumor microenvironment barriers: transformable and bioinspired nanomedicine strategies for deep tumor penetration (2026) · cites this paper as [103]
Self-check
Percentages, sums and reported differences re-computed from the paper’s own numbers.
The self-check needs the paper’s full text.
Citations
Cites
Multifunctional sonosensitizers in sonodynamic cancer therapy
Son, S., Kim, J. H., Wang, X., Zhang, C., Yoon, S. A., Shin, J., Sharma, A., Lee, M. H., Cheng, L., Wu, J., et al. (2020) · Chemical Society Reviews · doi:10.1039/c9cs00648f · Cited by 1,150
Research works printed but not linked: 60
- Tang, 2019, Angewandte Chem Int Edition, 131, 958, 10.1002/anie.201805664 · DOI
- Yang, 2019, Nano Lett, 19, 4334, 10.1021/acs.nanolett.9b00934 · DOI
- Fu, 2019, Adv Funct Mater, 29, 1906195, 10.1002/adfm.201906195 · DOI
- Gong, 2020, Nat Commun, 11, 3712, 10.1038/s41467-020-17485-x · DOI
- Zhang, 2021, Chem Soc Rev, 50, 11227, 10.1039/d1cs00403d · DOI
- Xiao, 2022, Chem Eng J, 449, 137889, 10.1016/j.cej.2022.137889 · DOI
- Liang, 2020, Adv Mater, 32, 2003214, 10.1002/adma.202003214 · DOI
- An, 2020, Biomaterials, 119761, 10.1016/j.biomaterials.2020.119761 · DOI
- Zhang, 2017, Adv Funct Mater, 27, 1700626, 10.1002/adfm.201700626 · DOI
- Liu, 2017, Small, 13, 1701621, 10.1002/smll.201701621 · DOI
- Yang, 2017, Nat Commun, 8, 902, 10.1038/s41467-017-01050-0 · DOI
- Yang, 2023, Adv Sci, 10, 2204365, 10.1002/advs.202204365 · DOI
- Du, 2023, J Cancer Res Clin Oncol, 149, 1645, 10.1007/s00432-022-04190-z · DOI
- Wang, 2020, Adv Mater, 32, 2001862, 10.1002/adma.202001862 · DOI
- Pan, 2020, Angew Chem, 59, 1897, 10.1002/anie.201912574 · DOI
- Xu, 2018, Nat Commun, 9, 2053, 10.1038/s41467-018-04318-1 · DOI
- QWu, 2019, Matter, 1, 496, 10.1016/j.matt.2019.03.007 · DOI
- Li, 2018, Angew Chem, 57, 11522, 10.1016/j.ajps.2023.100775 · DOI
- Chu, 2017, Adv Mater, 29, 1605928, 10.1002/adma.201605928 · DOI
- Chen, 2014, Adv Mater, 26, 7019, 10.1002/adma.201402572 · DOI
- Chen, 2020, Theranostics, 10, 4659, 10.7150/thno.42818 · DOI
- Li, 2020, ACS Nano, 14, 1586, 10.1021/acsnano.9b06689 · DOI
- Zhang, 2023, Nano Today, 49, 101798, 10.1016/j.nantod.2023.101798 · DOI
- Cao, 2021, Adv Mater, 33, 2106996, 10.1002/adma.202106996 · DOI
- Zhu, 2018, ACS Nano, 12, 3780, 10.1021/acsnano.8b00999 · DOI
- Liu, 2020, Sci Adv, 6, eabb2695, 10.1126/sciadv.abb2695 · DOI
- Cheng, 2020, Adv Mater, 32, 1908109, 10.1002/adma.201908109 · DOI
- LPZhao, 2020, Nano Lett, 20, 2062, 10.1021/acs.nanolett.0c00047 · DOI
- Wang, 2019, Adv Mater, 31, 1901893, 10.1002/adma.201901893 · DOI
- Jochems, 2011, Exp Biol Med (Maywood), 236, 567, 10.1258/ebm.2011.011007 · DOI
- Zhang, 2021, ACS nano, 16934, 10.1021/acsnano.1c08026 · DOI
- Cao, 2023, Acta Biomaterialia, 160, 239, 10.1016/j.actbio.2023.02.006 · DOI
- Chen, 2017, Biomaterials, 148, 69, 10.1016/j.biomaterials.2017.09.021 · DOI · Paper page
- Peng, 2018, Adv Sci, 5, 1700891, 10.1002/advs.201700891 · DOI
- Zhong, 2018, Cell Physiol Biochem, 45, 356, 10.1159/000486816 · DOI
- Pittet, 2014, Ann N Y Acad Sci, 1319, 1, 10.1111/nyas.12393 · DOI
- Jeong, 2017, Immunobiology, 222, 55, 10.1016/j.imbio.2015.11.010 · DOI
- Trac, 2020, Bioact Mater, 5, 92, 10.1016/j.bioactmat.2020.01.006 · DOI
- Gupta, 2018, Cancers, 10, 366, 10.3390/cancers10100366 · DOI
- Lewis, 2006, Canc Res, 66, 605, 10.1158/0008-5472.CAN-05-4005 · DOI · Paper page
- El-Dakdouki, 2012, Biomacromolecules, 13, 1144, 10.1021/bm300046h · DOI
- Toole, 2009, Clin Canc Res, 15, 7462, 10.1158/1078-0432.CCR-09-0479 · DOI
- Rayahin, 2015, ACS Biomater Sci Eng, 1, 481, 10.1021/acsbiomaterials.5b00181 · DOI · Paper page
- Wang, 2022, ACS Sustain Chem Eng, 10, 1585, 10.1021/acssuschemeng.1c07231 · DOI
- Li, 2017, Dalton Trans, 46, 16419, 10.1039/c7dt03021e · DOI
- Mura, 2013, Nat Mater, 12, 991, 10.1038/nmat3776 · DOI · Paper page
- Li, 2023, Materials Today Bio, 19, 100566, 10.1016/j.mtbio.2023.100566 · DOI
- Qi, 2019, Sci China Chem, 62, 162, 10.1007/s11426-018-9392-6 · DOI
- Bernsmann, 2011, Langmuir, 27, 2819, 10.1021/la104981s · DOI
- Dong, 2018, J Am Chem Soc, 140, 2165, 10.1021/jacs.7b11036 · DOI
- Cheng, 2017, Small, 13, 1700623, 10.1002/smll.201700623 · DOI
- Ding, 2017, Nano Lett, 17, 6790, 10.1021/acs.nanolett.7b03021 · DOI
- Miller, 2013, Int J Pharm, 445, 117, 10.1016/j.ijpharm.2013.01.059 · DOI
- Wang, 2019, Adv Healthc Mater, 8, e1801234, 10.1002/adhm.201801234 · DOI
- Rosa, 2017, Adv Healthc Mater, 6, 10.1002/adhm.201601012 · DOI
- Xu, 2011, Ultrasonics, 51, 480, 10.1016/j.ultras.2010.11.014 · DOI
- Li, 2014, Cancer Biother Radiopharm, 29, 42, 10.1089/cbr.2013.1526 · DOI
- Zhang, 2018, Cancer Sci, 109, 1330, 10.1111/cas.13578 · DOI
- Ji, 2021, Theranostics, 11, 8587, 10.7150/thno.62572 · DOI
- He, 2017, Adv Funct Mater, 27, 1704089, 10.1002/adfm.201704089 · DOI
Cited by
Sorted by citations
Sheng, J., Yuan, W., Zhang, M., Chen, Z., Qi, Y., Zhao, Y., & Zhang, S. (2026) · Journal of Nanobiotechnology · doi:10.1186/s12951-026-04028-7 · Cited by 35
Metadata
- Authors
- Du, J.-R., Teng, D.-K., Wang, Y., Wang, Q., Lin, Y.-Q., Luo, Q., Xue, J.-N., Zhu, L.-Y., Dong, P., Zhang, G.-M., Liu, Y., Sun, Z.-X., Wang, H., & Sui, G.-Q.
- Venue
- International Journal of Nanomedicine
- Publisher
- Informa UK Limited
- Published
- 2023-11
- Volume
- Volume 18
- Pages
- 6667-6687
- ISSN
- 1178-2013
- PMC
- PMC10656771
- Cited by
- 16
- References
- 1
- Language
- en
About these checks
Registry, retraction, Cites and statistics results are computed, not judged, with one exception: a printed reference that no index lists is read once by a model before it counts as a citation error. Claims are extracted by a model and kept only when their quote appears verbatim in the text; each cited source is then checked, with a model’s help, for whether it says what the claim relies on. Those verdicts can be wrong — read the claim’s quote and the cited source before relying on one.
Statistics and arithmetic are recomputed, not judged.
Confidence bands are shown only for fields calibrated on our annotated test set. None is calibrated yet, so no band is shown.
What counts as a claim ›How we measure confidence ›How we check this ›
Are you an author, or do you see a problem with this page? Request a review
