Cited by 14

The DOI matches its Crossref record; 1 of the 1 references it cites were found in a registry or an index.

Hypoxia and Singlet Oxygen Dual-Responsive Micelles for Photodynamic and Chemotherapy Therapy Featured with Enhanced Cellular Uptake and Triggered Cargo Delivery

Guo, Xuliang, Han, Lefei, Chen, Wenyu, He, Huixin, Zhang, Weijin, Huang, Chaoqi, Wang, Xiu·2024·International Journal of Nanomedicine

Overview

The claims and statistics of this paper haven’t been checked yet.

Run the check — free, no account needed. It reads the open-access text and checks the sources it cites.

A few free checks a day · papers already verified open instantly · results are public

Integrity signals

Registry

Crossref · 10.2147/ijn.s432407

Cites

1 of 1 references verified0 citation errors · 0 not checkable

Statistics

Figures

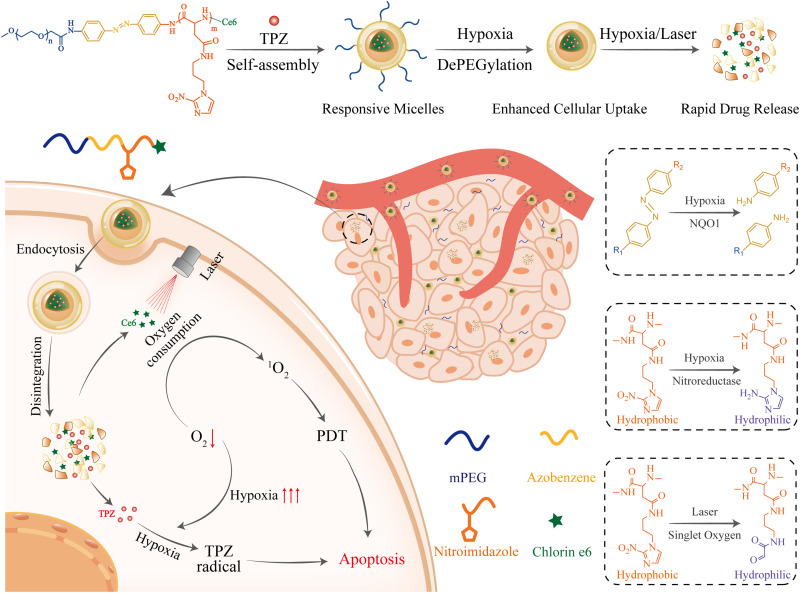
Scheme 1 Hypoxia- and singlet oxygen-responsive polymeric micelles for in tegration of photodynamic and chemotherapy therapy in a tumor-bearing mice model.
Scheme 1 Hypoxia- and singlet oxygen-responsive polymeric micelles for in tegration of photodynamic and chemotherapy therapy in a tumor-bearing mice model.CC BY-NC · PubMed Central
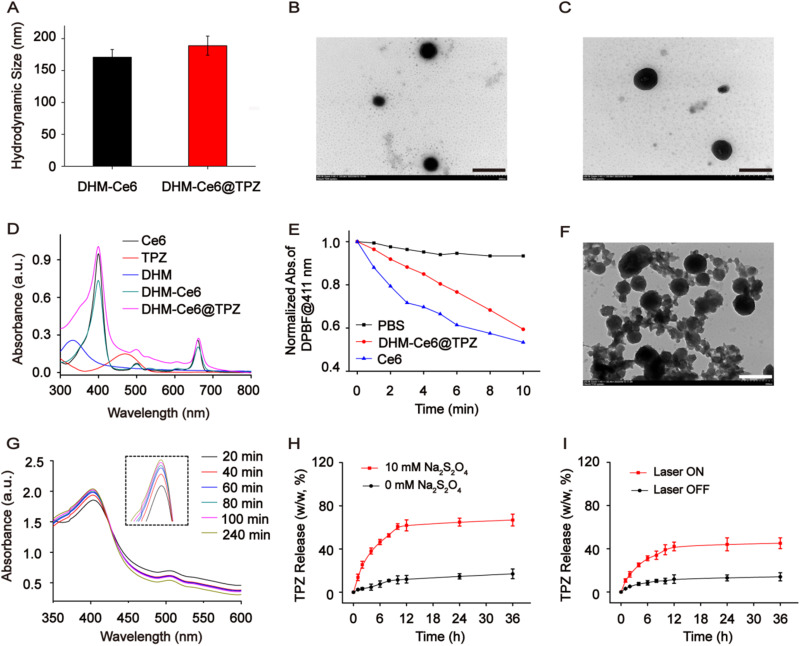
Figure 1 Physicochemical properties of hypoxia and singlet oxygen-responsive micelles (n = 3). (A) The hydrodynamic size of DHM-Ce6 and DHM-Ce6@TPZ. Transmission electron microscope images of DHM-Ce6 (B) and DHM-Ce6@TPZ (C) (scale bar: 500 nm). (D) UV-vis absorption spectra of Ce6, TPZ, DHM, DHM-Ce6, and DHM-Ce6@TPZ. (E) Normalized absorbance of DPBF at 411 nm of different formulations with light irradiation. (F) TEM image of DHM-Ce6@TPZ micelles post laser treatment (660 nm, 200 mW/cm2, 10 min). Scale: 500 nm. (G) The UV-vis spectra of DHM-Ce6@TPZ treated with sodium dithionite (10 mM). TPZ release from DHM-Ce6@TPZ micelles under mimicked hypoxia conditions. (H) (10 mM sodium dithionite), and under laser irradiation conditions (I) (660 nm, 200 mW/cm2, 10 min).
Figure 1 Physicochemical properties of hypoxia and singlet oxygen-responsive micelles (n = 3). (A) The hydrodynamic size of DHM-Ce6 and DHM-Ce6@TPZ. Transmission electron microscope images of DHM-Ce6 (B) and DHM-Ce6@TPZ (C) (scale bar: 500 nm). (D) UV-vis absorption spectra of Ce6, TPZ, DHM, DHM-Ce6, and DHM-Ce6@TPZ. (E) Normalized absorbance of DPBF at 411 nm of different formulations with light irradiation. (F) TEM image of DHM-Ce6@TPZ micelles post laser treatment (660 nm, 200 mW/cm2, 10 min). Scale: 500 nm. (G) The UV-vis spectra of DHM-Ce6@TPZ treated with sodium dithionite (10 mM). TPZ release from DHM-Ce6@TPZ micelles under mimicked hypoxia conditions. (H) (10 mM sodium dithionite), and under laser irradiation conditions (I) (660 nm, 200 mW/cm2, 10 min).CC BY-NC · PubMed Central
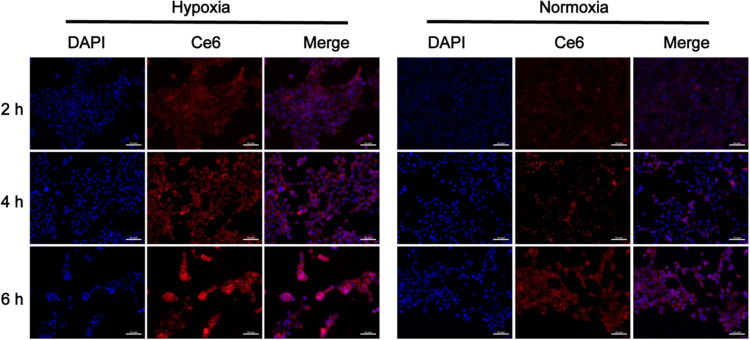
Figure 2 Confocal images of cellular uptake by 4T1 cells under normoxia or hypoxia at 2, 4, and 6 h post DHM-Ce6@TPZ micelles incubation (scale bar: 20 μm, n = 3).
Figure 2 Confocal images of cellular uptake by 4T1 cells under normoxia or hypoxia at 2, 4, and 6 h post DHM-Ce6@TPZ micelles incubation (scale bar: 20 μm, n = 3).CC BY-NC · PubMed Central
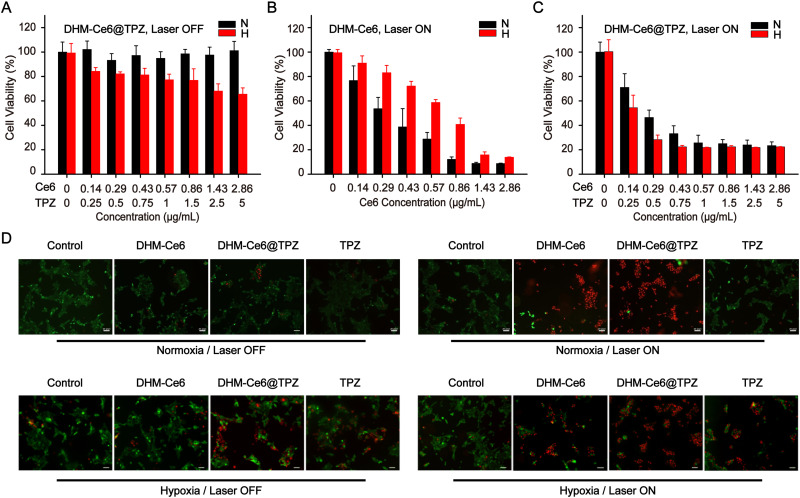
Figure 3 Viability of 4T1 cells in response to different formulations treatment under normoxia or hypoxia.(n = 4) (A) DHM-Ce6@TPZ without laser irradiation under normoxia or hypoxia. (B) DHM-Ce6 with laser irradiation under normoxia or hypoxia. (C) DHM-Ce6@TPZ without laser irradiation under normoxia or hypoxia. (D) Imaging of living and dead cells upon formulation treatment with the fixed TPZ dose at 1 μg/mL. The cells were stained with Calcein AM (green, live cells) and PI (red, dead cells) (scale bar: 20 μm).
Figure 3 Viability of 4T1 cells in response to different formulations treatment under normoxia or hypoxia.(n = 4) (A) DHM-Ce6@TPZ without laser irradiation under normoxia or hypoxia. (B) DHM-Ce6 with laser irradiation under normoxia or hypoxia. (C) DHM-Ce6@TPZ without laser irradiation under normoxia or hypoxia. (D) Imaging of living and dead cells upon formulation treatment with the fixed TPZ dose at 1 μg/mL. The cells were stained with Calcein AM (green, live cells) and PI (red, dead cells) (scale bar: 20 μm).CC BY-NC · PubMed Central
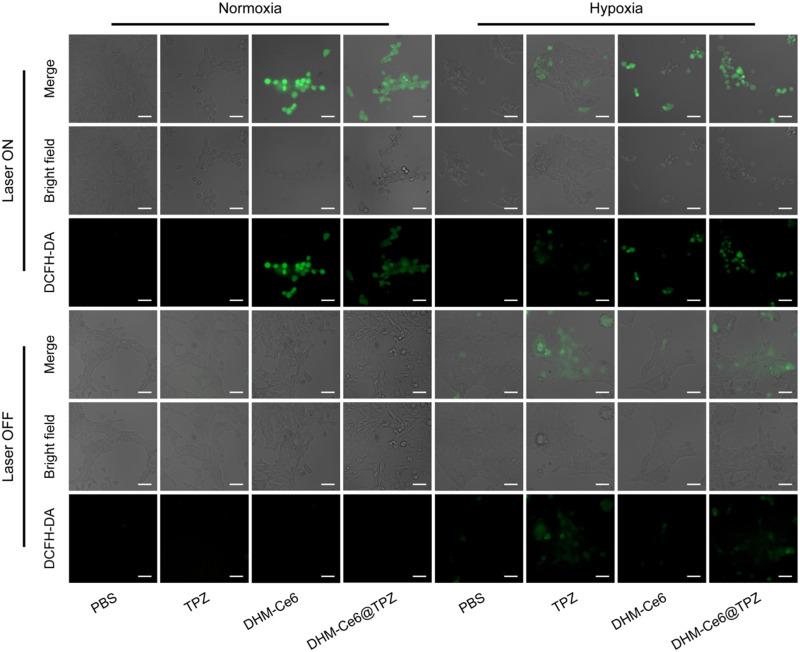
Figure 4 Fluorescence imaging of total reactive oxygen species (ROS) in 4T1 cells upon formulation treatment under different conditions, ROS was performed using a DCFH-DA probe (scale bar: 50 μm) with the dose of TPZ fixed at 1 μg/mL (n = 3).
Figure 4 Fluorescence imaging of total reactive oxygen species (ROS) in 4T1 cells upon formulation treatment under different conditions, ROS was performed using a DCFH-DA probe (scale bar: 50 μm) with the dose of TPZ fixed at 1 μg/mL (n = 3).CC BY-NC · PubMed Central
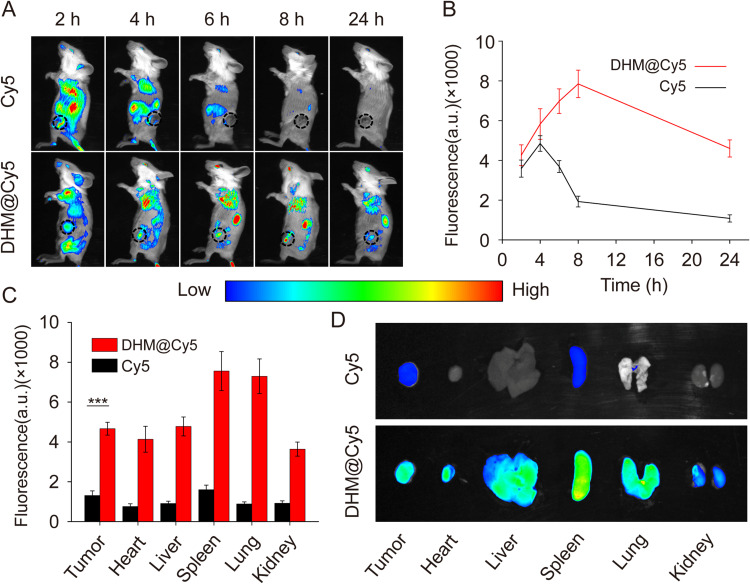
Figure 5 Kinetic biodistribution of micellar formulations in 4T1 tumor-bearing mice (n = 3). (A) In vivo kinetic fluorescence of Cy5 in 4T1 tumor-bearing mice up to 24 h after intravenous injection of free Cy5, DHM@Cy5 micelles. (B) Kinetic fluorescence quantification regarding Cy5 in tumors. (C) Semi-quantitative fluorescence summary of Cy5 level in healthy organs and tumors at the end of the biodistribution study. ***p < 0.001. (D) Ex vivo fluorescent analysis of Cy5 in tumors and other healthy organs 24 h post-dose administration.
Figure 5 Kinetic biodistribution of micellar formulations in 4T1 tumor-bearing mice (n = 3). (A) In vivo kinetic fluorescence of Cy5 in 4T1 tumor-bearing mice up to 24 h after intravenous injection of free Cy5, DHM@Cy5 micelles. (B) Kinetic fluorescence quantification regarding Cy5 in tumors. (C) Semi-quantitative fluorescence summary of Cy5 level in healthy organs and tumors at the end of the biodistribution study. ***p < 0.001. (D) Ex vivo fluorescent analysis of Cy5 in tumors and other healthy organs 24 h post-dose administration.CC BY-NC · PubMed Central
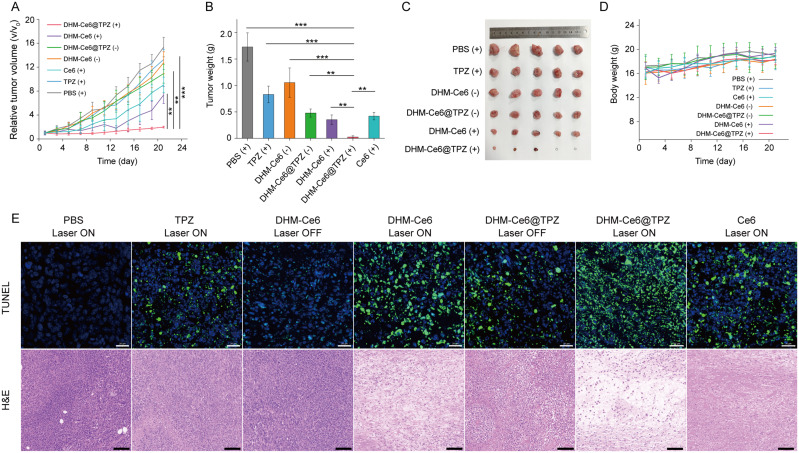
Figure 6 In vivo antitumor efficacy of dual-responsive micelles (n = 5). (A) Tumor-growth inhibitory effects of seven formulations. (B) Quantitative analysis of tumor weight. (C) Images of tumors in the end of treatment. (D) Changes in body weight of mice during treatments. (E) TUNEL staining (scale bar: 50 μm) and H&E staining (scale bar: 100 μm) at the end of therapy. **p < 0.01; ***p < 0.001.
Figure 6 In vivo antitumor efficacy of dual-responsive micelles (n = 5). (A) Tumor-growth inhibitory effects of seven formulations. (B) Quantitative analysis of tumor weight. (C) Images of tumors in the end of treatment. (D) Changes in body weight of mice during treatments. (E) TUNEL staining (scale bar: 50 μm) and H&E staining (scale bar: 100 μm) at the end of therapy. **p < 0.01; ***p < 0.001.CC BY-NC · PubMed Central
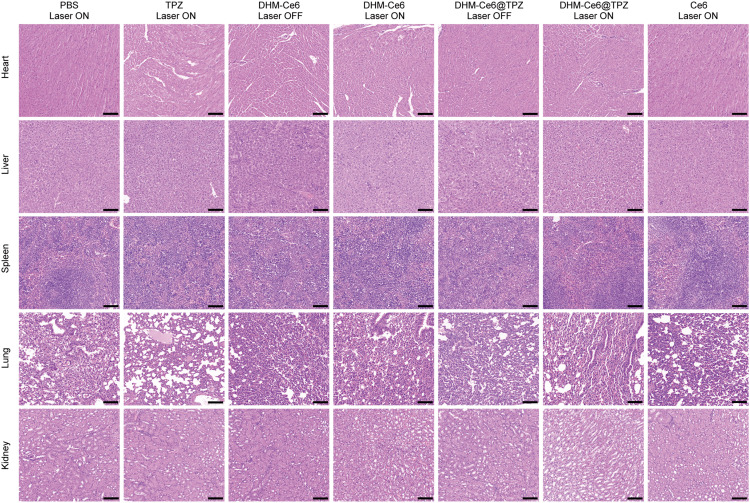
Figure 7 Histological analysis of major healthy organs (heart, liver, spleen, lung, and kidney) at the end of efficacy study (scale bar: 100 µm).
Figure 7 Histological analysis of major healthy organs (heart, liver, spleen, lung, and kidney) at the end of efficacy study (scale bar: 100 µm).CC BY-NC · PubMed Central

Verification

Claims the paper makes

The claims and statistics of this paper haven’t been checked yet.

Run the check — free, no account needed. It reads the open-access text and checks the sources it cites.

A few free checks a day · papers already verified open instantly · results are public

Claims other papers make about this one

Each is checked against this paper’s own text: does it say what the citing paper says it does?

Self-check

Percentages, sums and reported differences re-computed from the paper’s own numbers.

The self-check needs the paper’s full text.

Citations

Cites

Research works printed but not linked: 32

  1. Khan, 2021, Semin Cancer Biol, 69, 200, 10.1016/j.semcancer.2019.07.023 · DOI
  2. Wicki, 2015, J Control Release, 200, 138, 10.1016/j.jconrel.2014.12.030 · DOI
  3. Pei, 2022, J Control Release, 352, 211, 10.1016/j.jconrel.2022.10.023 · DOI
  4. Ali, 2021, Semin Cancer Biol, 69, 52, 10.1016/j.semcancer.2020.01.011 · DOI
  5. Zhi, 2020, J Control Release, 325, 52, 10.1016/j.jconrel.2020.06.032 · DOI
  6. Deng, 2018, Biomater Sci, 7, 429, 10.1039/C8BM01042K · DOI
  7. Zhong, 2021, Biomater Sci, 9, 5218, 10.1039/D1BM00660F · DOI
  8. Ge, 2021, Nano Lett, 21, 3218, 10.1021/acs.nanolett.1c00488 · DOI
  9. Wang, 2018, ACS Appl Mater Interfaces, 10, 19398, 10.1021/acsami.8b03506 · DOI
  10. Li, 2017, J Control Release, 260, 12, 10.1016/j.jconrel.2017.05.025 · DOI
  11. Li, 2018, ACS Appl Mater Interfaces, 2018, 1
  12. Wan, 2021, Adv Mater, 33, e2103978, 10.1002/adma.202103978 · DOI · Paper page
  13. Wang, 2020, Biomaterials, 251, 120088, 10.1016/j.biomaterials.2020.120088 · DOI
  14. Ma, 2021, ACS Appl Mater Interfaces, 13, 59720, 10.1021/acsami.1c19681 · DOI
  15. Zhang, 2023, Adv Healthc Mater, 12, e2300530, 10.1002/adhm.202300530 · DOI
  16. Guo, 2020, ACS Nano, 14, 14715, 10.1021/acsnano.0c00764 · DOI
  17. Perche, 2014, Angew Chem Int Ed Engl, 53, 3362, 10.1002/anie.201308368 · DOI
  18. Xu, 2020, Biomater Sci, 8, 3348, 10.1039/D0BM00328J · DOI
  19. Xu, 2022, Colloids Surf B Biointerfaces, 215, 112526, 10.1016/j.colsurfb.2022.112526 · DOI
  20. Filipczak, 2022, J Control Release, 341, 431, 10.1016/j.jconrel.2021.11.034 · DOI
  21. Li, 2020, Cancer Lett, 490, 31, 10.1016/j.canlet.2020.05.032 · DOI
  22. Zhou, 2021, J Control Release, 339, 130, 10.1016/j.jconrel.2021.09.023 · DOI
  23. Dutta, 2021, Biomacromolecules, 22, 4857, 10.1021/acs.biomac.1c01152 · DOI
  24. Chen, 2023, Adv Healthc Mater, 12, e2301785, 10.1002/adhm.202301785 · DOI
  25. Yan, 2019, ACS Appl Mater Interfaces, 11, 24377, 10.1021/acsami.9b04142 · DOI
  26. Verwilst, 2017, Biomaterials, 115, 104, 10.1016/j.biomaterials.2016.11.023 · DOI
  27. Zhang, 2018, ACS Appl Mater Interfaces, 10, 21909, 10.1021/acsami.8b06491 · DOI
  28. Zhang, 2018, ACS Nano, 12, 10201, 10.1021/acsnano.8b05200 · DOI
  29. Mahmoud, 2019, ACS Appl Mater Interfaces, 11, 31302, 10.1021/acsami.9b09395 · DOI
  30. Matsumoto, 2016, Nature Nanotechnol, 11, 533, 10.1038/nnano.2015.342 · DOI
  31. Matsumura, 1986, Cancer Res, 46, 6387
  32. Blanco, 2015, Nature Biotechnol, 33, 941, 10.1038/nbt.3330 · DOI · Paper page

Cited by

Sorted by citations

See all 14

Metadata

Authors
Guo, X., Han, L., Chen, W., He, H., Zhang, W., Huang, C., & Wang, X.
Venue
International Journal of Nanomedicine
Published
2024-01
Volume
Volume 19
Pages
247-261
ISSN
1178-2013
Cited by
14
References
1
Language
en

About these checks

Registry, retraction, Cites and statistics results are computed, not judged, with one exception: a printed reference that no index lists is read once by a model before it counts as a citation error. Claims are extracted by a model and kept only when their quote appears verbatim in the text; each cited source is then checked, with a model’s help, for whether it says what the claim relies on. Those verdicts can be wrong — read the claim’s quote and the cited source before relying on one.

Statistics and arithmetic are recomputed, not judged.

Confidence bands are shown only for fields calibrated on our annotated test set. None is calibrated yet, so no band is shown.

What counts as a claim ›How we measure confidence ›How we check this ›

Are you an author, or do you see a problem with this page? Request a review