

The DOI matches its Crossref record; 26 of the 27 references it cites were found in a registry or an index.
Systematic Evaluation and Comparison of Statistical Tests for Publication Bias
Open accessAbstract
BACKGROUND: This study evaluates the statistical and discriminatory powers of three statistical test methods (Begg's, Egger's, and Macaskill's) to detect publication bias in meta-analyses. METHODS: The data sources were 130 reviews from the Cochrane Database of Systematic Reviews 2002 issue, which considered a binary endpoint and contained 10 or more individual studies. Funnel plots with observers'agreements were selected as a reference standard. We evaluated a trade-off between sensitivity and specificity by varying cut-off p-values, power of statistical tests given fixed false positive rates, and area under the receiver operating characteristic curve. RESULTS: In 36 reviews, 733 original studies evaluated 2,874,006 subjects. The number of trials included in each ranged from 10 to 70 (median 14.5). Given that the false positive rate was 0.1, the sensitivity of Egger's method was 0.93, and was larger than that of Begg's method (0.86) and Macaskill's method (0.43). The sensitivities of three statistical tests increased as the cut-off p-values increased without a substantial decrement of specificities. The area under the ROC curve of Egger's method was 0.955 (95% confidence interval, 0.889-1.000) and was not different from that of Begg's method (area=0.913, p=0.2302), but it was larger than that of Macaskill's method (area=0.719, p=0.0116). CONCLUSION: Egger's linear regression method and Begg's method had stronger statistical and discriminatory powers than Macaskill's method for detecting publication bias given the same type I error level. The power of these methods could be improved by increasing the cut-off p-value without a substantial increment of false positive rate.
Overview
The claims and statistics of this paper haven’t been checked yet.
Run the check — free, no account needed. It reads the open-access text and checks the sources it cites.
Integrity signals
Registry
Cites
Statistics
Figures
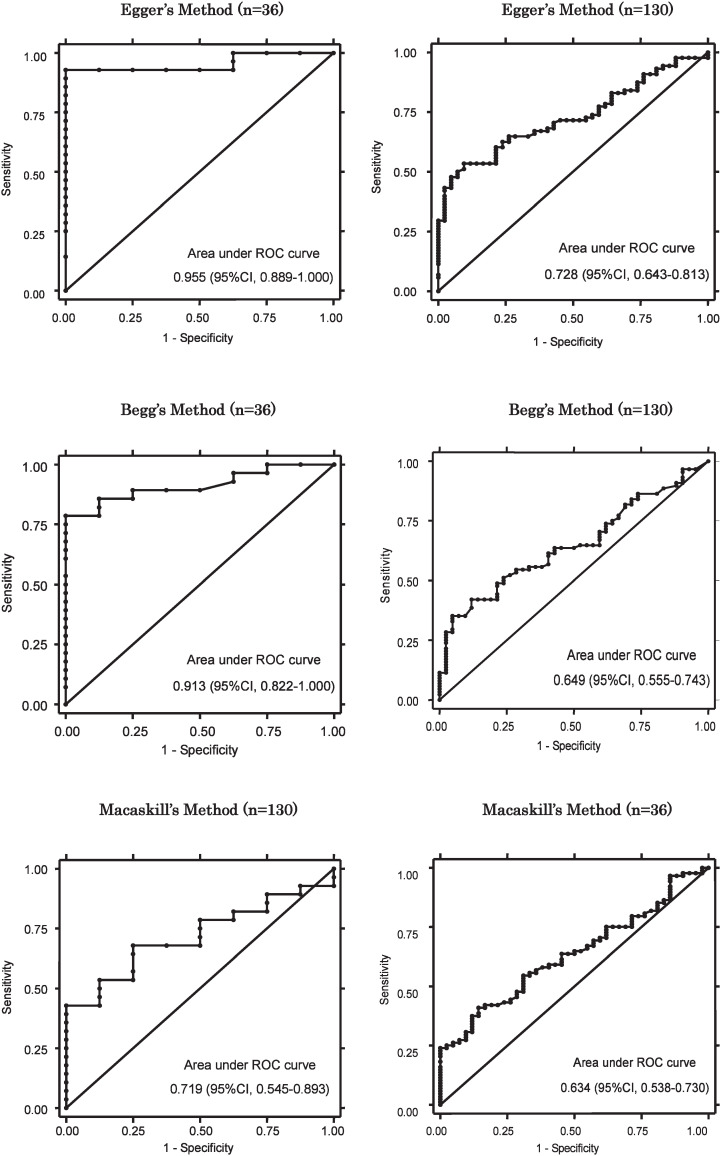
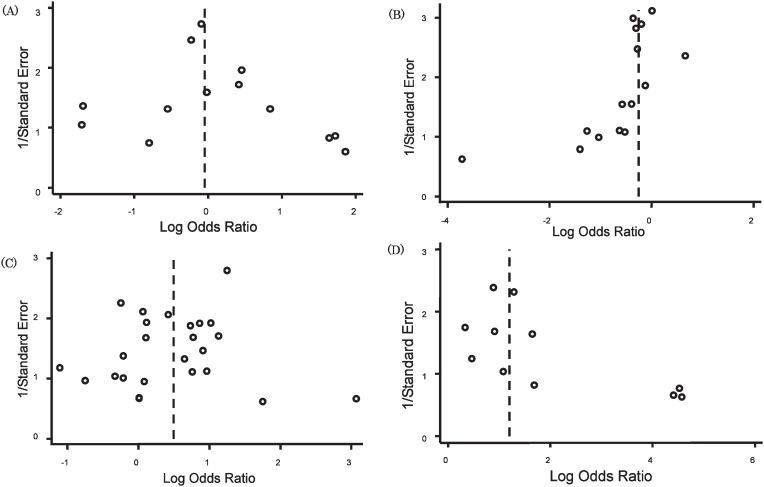
Verification
Claims the paper makes
The claims and statistics of this paper haven’t been checked yet.
Run the check — free, no account needed. It reads the open-access text and checks the sources it cites.
Claims other papers make about this one
Each is checked against this paper’s own text: does it say what the citing paper says it does?
The cited source says what the claim attributes to it.
In the citing paper
“Publication bias was evaluated visually with funnel plots and statistically via Egger's test [23].”
From Ketogenic diet-induced changes in adult lipid metabolism: a comprehensive systematic review and meta-regression of randomized controlled trials (2026) · cites this paper as [23]
Self-check
Percentages, sums and reported differences re-computed from the paper’s own numbers.
The self-check needs the paper’s full text.
Citations
Cites
Bias in meta-analysis detected by a simple, graphical test
Egger, M., Smith, G. D., Schneider, M., & Minder, C. (1997) · BMJ · doi:10.1136/bmj.315.7109.629 · Cited by 56,722 · cited 1×
“Meta-analyses should therefore be scrutinized for the possible presence of such biases.(2) A prospective registration of trials is encouraged through trial registries,(3) but publication bias still remains a serious problem.”
DeLong, E. R., DeLong, D. M., & Clarke-Pearson, D. L. (1988) · Biometrics · doi:10.2307/2531595 · Cited by 22,649
Operating characteristics of a rank correlation test for publication bias
Begg, C. B., & Mazumdar, M. (1994) · Biometrics · doi:10.2307/2533446 · Cited by 16,955 · cited 2×
“The effect estimates were standardized to stabilize the variance, and an adjusted rank correlation test was then performed.(5,13) Let ti and vi be the estimated effect sizes and those variances from the k studies in the meta-analysis, i=1,.”
Hanley, J. A., & McNeil, B. J. (1983) · Radiology · doi:10.1148/radiology.148.3.6878708 · Cited by 7,016
Funnel plots for detecting bias in meta-analysis
Sterne, J. A. C., & Egger, M. (2001) · Journal of Clinical Epidemiology · doi:10.1016/s0895-4356(01)00377-8 · Cited by 3,779
Publication bias in clinical research
Easterbrook, P. J., Gopalan, R., Berlin, J. A., & Matthews, D. R. (1991) · The Lancet · doi:10.1016/0140-6736(91)90201-y · Cited by 3,109
Meta-analysis: Principles and procedures
Egger, M., Smith, G. D., & Phillips, A. N. (1997) · BMJ · doi:10.1136/bmj.315.7121.1533 · Cited by 2,415
Publication and related bias in meta-analysis
Sterne, J. A. C., Gavaghan, D., & Egger, M. (2000) · Journal of Clinical Epidemiology · doi:10.1016/s0895-4356(00)00242-0 · Cited by 2,282 · cited 1×
“1 as the positive threshold of bias to assess the power of statistical tests, but this value was arbitrarily chosen and has not been systematically validated.(7) Moreover, there is no consensus about which test is better at detecting publication bias.”
Summing up: The Science of Reviewing Research
Wilkinson, I., Light, R. J., & Pillemer, D. B. (1987) · Journal of Educational Statistics · doi:10.2307/1164691 · Cited by 1,486
Light, R. J., & Pillemer, D. B. (1984) · Harvard University Press eBooks · doi:10.4159/9780674040243 · Cited by 1,422
Research works printed but not linked: 4
- 1997, 315, 629
- SUTTON A J, 2000, 320, 1574
- 10. Collaboration CdsrIC. Cochrane Library. Issue 1. Oxford: Update Software, 2002.
- 1992, 305, 15
Cited by
Sorted by citations
Selective publication of antidepressant trials and its influence on apparent efficacy
Turner, E. H., Matthews, A. M., Linardatos, E., Tell, R. A., & Rosenthal, R. (2008) · New England Journal of Medicine · doi:10.1056/nejmsa065779 · Cited by 2,435
Dissemination and publication of research findings: an updated review of related biases
Song, F., Parekh, Hooper, L., Loke, Y., Ryder, J., Sutton, A., Hing, C., Kwok, C., Pang, C., & Harvey, I. (2010) · Health Technology Assessment · doi:10.3310/hta14080 · Cited by 1,039
Physical activity for cancer survivors: meta-analysis of randomised controlled trials
Fong, D. Y. T., Ho, J. W. C., Hui, B. P. H., Lee, A. M., Macfarlane, D. J., Leung, S. S. K., Cerin, E., Chan, W. Y. Y., Leung, I. P. F., Lam, S. H. S., et al. (2012) · BMJ · doi:10.1136/bmj.e70 · Cited by 782
Zarychanski, R., Abou-Setta, A. M., Turgeon, A. F., Houston, B. L., McIntyre, L., Marshall, J. C., & Fergusson, D. A. (2013) · JAMA · doi:10.1001/jama.2013.430 · Cited by 646
“Gondos et al,38 2010 Postoperative hypovolemia 58 (15) APACHE median (range): HES: 14 (8-21) GEL: 15 (8-23) ALB: 11 (7-19) RL: 15 (8-22) Signs of hypovolemia and GEDVI 600 mL/m2 or SVV 10% 6% HES 130/0.”
Schwaber, M. J., & Carmeli, Y. (2007) · Journal of Antimicrobial Chemotherapy · doi:10.1093/jac/dkm318 · Cited by 642
“Publication bias was assessed via funnel plot and Begg’s test.(15,16)”
Method
Metadata
- Authors
- Hayashino, Y., Noguchi, Y., & Fukui, T.
- Affiliations
- Kyoto University (JP)
- Fujita Health University (JP)
- St. Luke's International Hospital (JP)
- Venue
- Journal of Epidemiology
- Publisher
- Japan Epidemiological Association
- Published
- 2005
- Volume
- 15
- Issue
- 6
- Pages
- 235-243
- ISSN
- 0917-5040 (ISSN-L)
- 1349-9092
- PMC
- PMC7904376
- OpenAlex
- W2084494571
- Cited by
- 379
- References
- 27
- Citations by year
- 2026: 29 · 2025: 27 · 2024: 26 · 2023: 37 · 2022: 30 · 2021: 38 · 2020: 25 · 2019: 27 · 2018: 14 · 2017: 24 · 2016: 12 · 2015: 25 · 2014: 16 · 2013: 9 · 2012: 13
- FWCI
- 3.47
- Type
- journal article
- Language
- en
- Open access
- gold
- doi.org
- Licence
- cc-by
- Locations
- Journal of Epidemiology (publishedVersion, cc-by)
- PubMed Central (publishedVersion, cc-by)
- PubMed (publishedVersion)
- Topics
- Social Sciences › Decision Sciences › Statistics, Probability and Uncertainty › Meta-analysis and systematic reviews
- Physical Sciences › Mathematics › Statistics and Probability › Statistical Methods in Epidemiology
- Social Sciences › Library and Information Sciences › scientometrics and bibliometrics research
- Keywords
- publication bias, Egger's test, funnel plot, sensitivity and specificity, statistical power, discriminatory power, binary outcomes, meta-analysis
- MeSH terms
- ROC Curve, Meta-Analysis as Topic, Linear Models, Publication Bias
About these checks
Registry, retraction, Cites and statistics results are computed, not judged, with one exception: a printed reference that no index lists is read once by a model before it counts as a citation error. Claims are extracted by a model and kept only when their quote appears verbatim in the text; each cited source is then checked, with a model’s help, for whether it says what the claim relies on. Those verdicts can be wrong — read the claim’s quote and the cited source before relying on one.
Statistics and arithmetic are recomputed, not judged.
Confidence bands are shown only for fields calibrated on our annotated test set. None is calibrated yet, so no band is shown.
What counts as a claim ›How we measure confidence ›How we check this ›
Are you an author, or do you see a problem with this page? Request a review
