

The DOI matches its Crossref record; 42 of the 42 references it cites were found in a registry or an index.
A Novel Intervention Including Individualized Nutritional Recommendations Reduces Hemoglobin A1c Level, Medication Use, and Weight in Type 2 Diabetes
Open accessAbstract
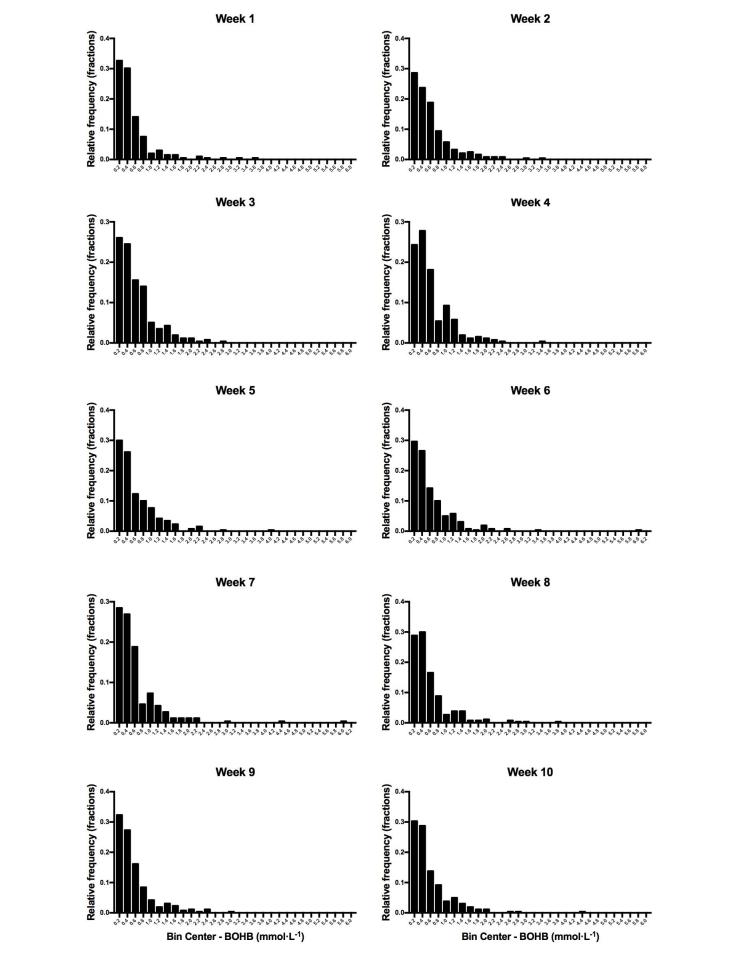
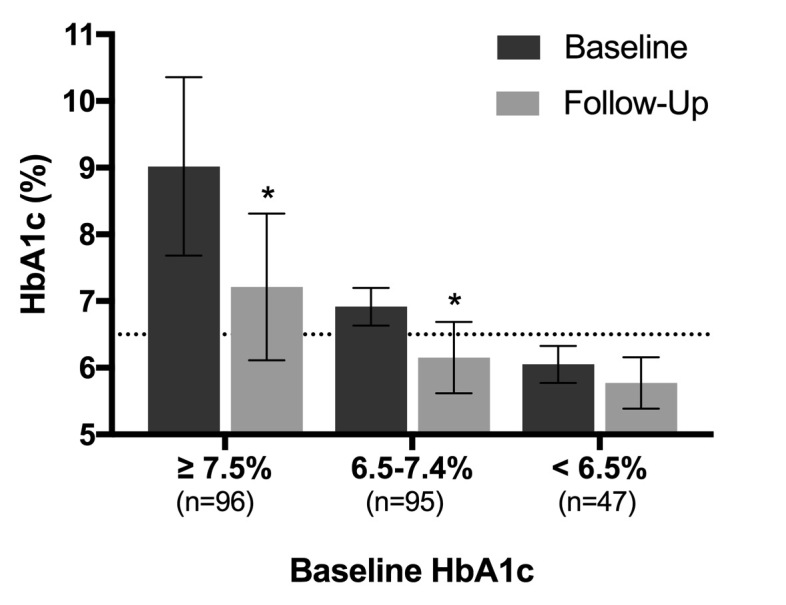
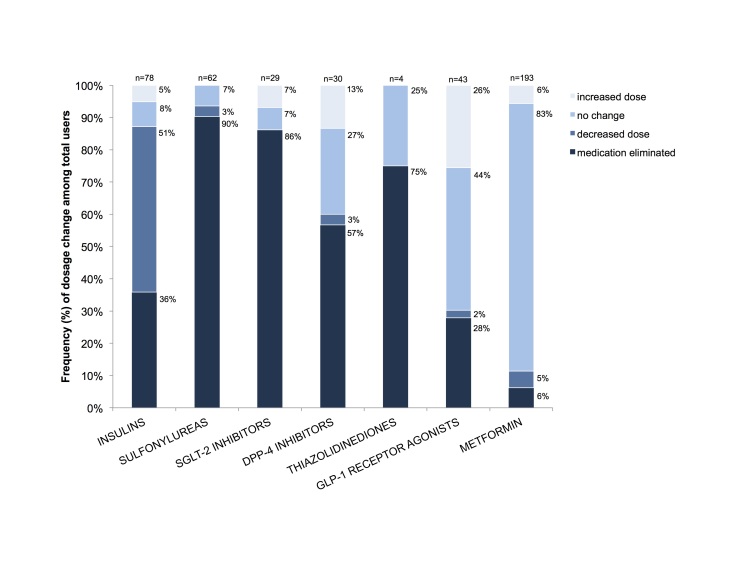
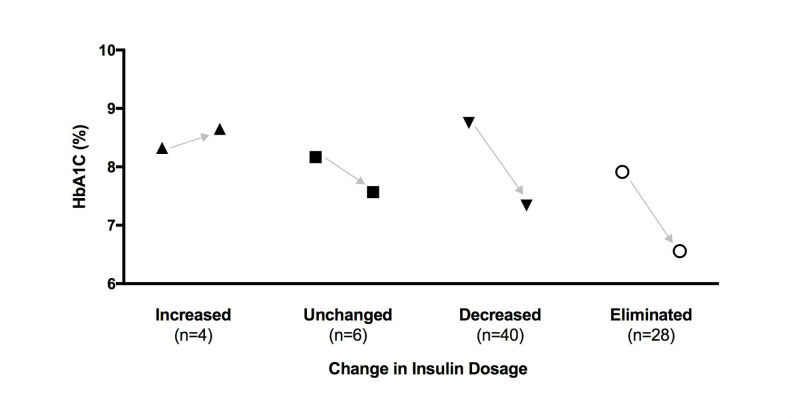
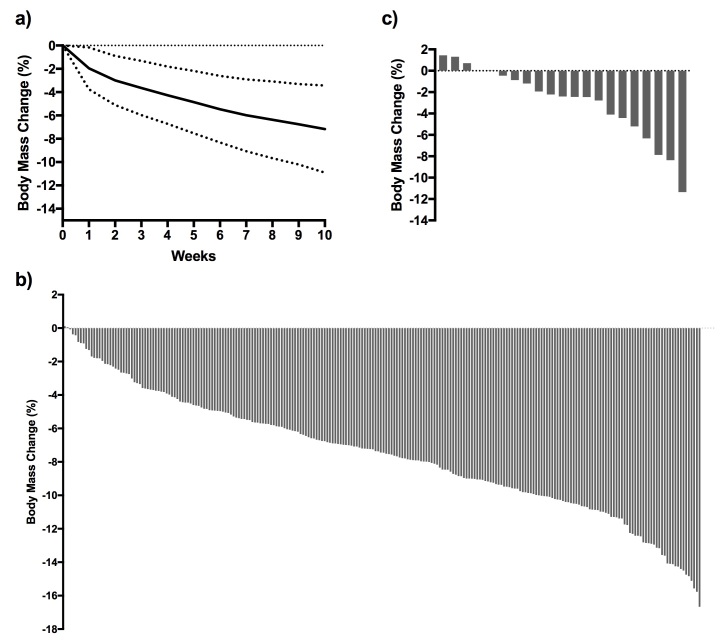
BACKGROUND: Type 2 diabetes (T2D) is typically managed with a reduced fat diet plus glucose-lowering medications, the latter often promoting weight gain. OBJECTIVE: We evaluated whether individuals with T2D could be taught by either on-site group or remote means to sustain adequate carbohydrate restriction to achieve nutritional ketosis as part of a comprehensive intervention, thereby improving glycemic control, decreasing medication use, and allowing clinically relevant weight loss. METHODS: ) and related biomarkers of T2D were evaluated at baseline and 10-week follow-up. RESULTS: =1.503, P=.22). CONCLUSIONS: These initial results indicate that an individualized program delivered and supported remotely that incorporates nutritional ketosis can be highly effective in improving glycemic control and weight loss in adults with T2D while significantly decreasing medication use.
Overview
The claims and statistics of this paper haven’t been checked yet.
Run the check — free, no account needed. It reads the open-access text and checks the sources it cites.
Integrity signals
Registry
Cites
Statistics
Figures
Verification
Claims the paper makes
The claims and statistics of this paper haven’t been checked yet.
Run the check — free, no account needed. It reads the open-access text and checks the sources it cites.
Claims other papers make about this one
Each is checked against this paper’s own text: does it say what the citing paper says it does?
The cited source says what the claim attributes to it.
In the citing paper
“Even the presence or absence of additional devices (such as connected weight scales [46] or accelerometers [25,34]) did not appear to make a difference.”
From Digital Interventions for Self-Management of Type 2 Diabetes Mellitus: Systematic Literature Review and Meta-Analysis (2024) · cites this paper as [46]
The cited source says what the claim attributes to it.
In the citing paper
“This study demonstrated that a T2D intervention combining technology-enabled continuous remote care with individualized care plans encouraging nutritional ketosis can significantly reduce HbA1c, medication use, and weight within 70 days [23], and that these outcomes can be maintained or improved through 1 year.”
From Effectiveness and Safety of a Novel Care Model for the Management of Type 2 Diabetes at 1 Year: An Open-Label, Non-Randomized, Controlled Study (2018) · cites this paper as [23]
Self-check
Percentages, sums and reported differences re-computed from the paper’s own numbers.
The self-check needs the paper’s full text.
Citations
Cites
Turner, R. C., Fox, C., Matthews, McElroy, H. H., Cull, C. A., Holman, R. R., Neil, P., Hadden, D. R., Wright, D., Manley, E., et al. (1998) · The Lancet · Cited by 8,419
Glucose control and vascular complications in veterans with type 2 diabetes
Duckworth, W., Abraira, C., Moritz, T., Reda, D., Emanuele, N., Reaven, P. D., Zieve, F. J., Marks, J., Davis, S. N., Hayward, R., et al. (2009) · New England Journal of Medicine · doi:10.1056/nejmoa0808431 · Cited by 4,762
Lifestyle, diabetes, and cardiovascular risk factors 10 years after bariatric surgery
Sjöström, L., Lindroos, A.-K., Peltonen, M., Torgerson, J., Bouchard, C., Carlsson, B., Dahlgren, S., Larsson, B., Narbro, K., Sjöström, C. D., et al. (2004) · New England Journal of Medicine · doi:10.1056/nejmoa035622 · Cited by 4,457
Gupta, A., & Uribarri, J. (2016) · Hormone Research in Paediatrics · doi:10.1159/000444053 · Cited by 4,023
The ketone metabolite β-hydroxybutyrate blocks NLRP3 inflammasome-mediated inflammatory disease
Youm, Y.-H., Nguyen, K. Y., Grant, R. W., Goldberg, E. L., Bodogai, M., Kim, D., D'Agostino, D., Planavsky, N., Lupfer, C., Kanneganti, T. D., et al. (2015) · Nature Medicine · doi:10.1038/nm.3804 · Cited by 2,172
Suppression of Oxidative Stress by β-Hydroxybutyrate, an Endogenous Histone Deacetylase Inhibitor
Shimazu, T., Hirschey, M. D., Newman, J., He, W., Shirakawa, K., Le Moan, N., Grueter, C. A., Lim, H., Saunders, L. R., Stevens, R. D., et al. (2013) · Science · doi:10.1126/science.1227166 · Cited by 1,777
Standards of Medical Care in Diabetes—2017 Abridged for Primary Care Providers
American Diabetes Association (2017) · Clinical Diabetes · doi:10.2337/cd16-0067 · Cited by 999
Boden, G., Sargrad, K., Homko, C., Mozzoli, M., & Stein, T. P. (2005) · Annals of Internal Medicine · doi:10.7326/0003-4819-142-6-200503150-00006 · Cited by 542
Research works printed but not linked: 1
- Volek, JS, 2011, The Art and Science of Low Carbohydrate Living
Cited by
Sorted by citations
Hallberg, S. J., McKenzie, A. L., Williams, P. T., Bhanpuri, N. H., Peters, A. L., Campbell, W. W., Hazbun, T. L., Volk, B. M., McCarter, J. P., Phinney, S. D., et al. (2018) · Diabetes Therapy · doi:10.1007/s13300-018-0373-9 · Cited by 406
Self-citationAthinarayanan, S. J., Adams, R. N., Hallberg, S. J., McKenzie, A. L., Bhanpuri, N. H., Campbell, W. W., Volek, J. S., Phinney, S. D., & McCarter, J. P. (2019) · Frontiers in Endocrinology · doi:10.3389/fendo.2019.00348 · Cited by 324
Self-citationQuantitative Fluxomics of Circulating Metabolites
Hui, S. T., Cowan, A. J., Zeng, X., Yang, L., TeSlaa, T. A., Li, X., Bartman, C., Zhang, Z., Jang, C., Wang, L., et al. (2020) · Cell Metabolism · doi:10.1016/j.cmet.2020.07.013 · Cited by 274
Yuan, X., Wang, J., Yang, S., Gao, M., Cao, L., Li, X., Hong, D., Tian, S., & Sun, C. (2020) · Nutrition & Diabetes · doi:10.1038/s41387-020-00142-z · Cited by 240
Nutritional ketosis for weight management and reversal of metabolic syndrome
Gershuni, V. M., Yan, S. L., & Medici, V. (2018) · Current Nutrition Reports · doi:10.1007/s13668-018-0235-0 · Cited by 239
Ketogenic diets and chronic disease: weighing the benefits against the risks
Crosby, L., Davis, B., Joshi, S., Jardine, M., Paul, J., Neola, M., & Barnard, N. D. (2021) · Frontiers in Nutrition · doi:10.3389/fnut.2021.702802 · Cited by 229
Lima, J. E. B. F., Moreira, N. C. S., & Sakamoto-Hojo, E. T. (2022) · Mutation Research/Genetic Toxicology and Environmental Mutagenesis · doi:10.1016/j.mrgentox.2021.503437 · Cited by 203
Bhanpuri, N. H., Hallberg, S. J., Williams, P. T., McKenzie, A. L., Ballard, K. D., Campbell, W. W., McCarter, J. P., Phinney, S. D., & Volek, J. S. (2018) · Cardiovascular Diabetology · doi:10.1186/s12933-018-0698-8 · Cited by 190
Self-citationMiller, V. J., Villamena, F. A., & Volek, J. S. (2018) · Journal of Nutrition and Metabolism · doi:10.1155/2018/5157645 · Cited by 205
Self-citationKelly, T., Unwin, D., & Finucane, F. M. (2020) · International Journal of Environmental Research and Public Health · doi:10.3390/ijerph17072557 · Cited by 141
Shamanna, P., Saboo, B., Damodharan, S., Mohammed, J., Mohamed, M., Poon, T., Kleinman, N. L., & Thajudeen, M. (2020) · Diabetes Therapy · doi:10.1007/s13300-020-00931-w · Cited by 121
Ketone-Based Metabolic Therapy: Is Increased NAD+ a Primary Mechanism?
Elamin, M., Ruskin, D. N., Masino, S. A., & Sacchetti, P. (2017) · Frontiers in Molecular Neuroscience · doi:10.3389/fnmol.2017.00377 · Cited by 105
Kerr, D., Ahn, D., Waki, K., Wang, J., Breznen, B., & Klonoff, D. C. (2024) · Journal of Medical Internet Research · doi:10.2196/55757 · Cited by 101
“…as outlined in the Methods section yielded the following stratification: (1) a total of 7 studies in the high-intensity category [20,22,26,35,41,45,46] (out of which 5 were RCTs) [20,22,26,41,45], (2) a total of 16 studies in the medium-intensity category [21,23,25,27,29-33,37-40, Table 2 shows…”
InfluentialKetogenic diet as a potential intervention for lipedema
Keith, L., Seo, C. A., Rowsemitt, C. N., Pfeffer, M., Wahi, M. M., Staggs, M., Dudek, J. E., Gower, B. A., & Carmody, M. (2020) · Medical Hypotheses · doi:10.1016/j.mehy.2020.110435 · Cited by 105
The Landscape of Diabetic Kidney Disease in the United States
Duru, O. K., Middleton, T. R., Tewari, M. K., & Norris, K. C. (2018) · Current Diabetes Reports · doi:10.1007/s11892-018-0980-x · Cited by 75
Shilpa, J., & Mohan, V. (2018) · The Indian Journal of Medical Research · doi:10.4103/ijmr.ijmr_1666_18 · Cited by 74
Athinarayanan, S. J., Hallberg, S. J., McKenzie, A. L., Lechner, K., King, S. M., McCarter, J. P., Volek, J. S., Phinney, S. D., & Krauss, R. M. (2020) · Cardiovascular Diabetology · doi:10.1186/s12933-020-01178-2 · Cited by 73
Self-citationLandry, M. J., Crimarco, A., Perelman, D., Durand, L. R., Petlura, C., Aronica, L., Robinson, J. L., Kim, S. H., & Gardner, C. D. (2021) · Nutrients · doi:10.3390/nu13030967 · Cited by 60
Saslow, L. R., Summers, C., Aikens, J. E., & Unwin, D. J. (2018) · JMIR Diabetes · doi:10.2196/diabetes.9333 · Cited by 61
Robert, C., Erdt, M., Lee, J. C. B., Cao, Y., Naharudin, N. B., & Theng, Y. L. (2021) · Journal of Medical Internet Research · doi:10.2196/15649 · Cited by 58
Durrer, C. G., McKelvey, S., Singer, J., Batterham, A. M., Johnson, J. D., Gudmundson, K., Wortman, J., & Little, J. P. (2021) · Nature Communications · doi:10.1038/s41467-021-25667-4 · Cited by 64
Shamanna, P., Dharmalingam, M., Sahay, R. K., Mohammed, J., Mohamed, M., Poon, T., Kleinman, N. L., & Thajudeen, M. (2021) · Scientific Reports · doi:10.1038/s41598-021-94339-6 · Cited by 59
The Role of Ketogenic Metabolic Therapy on the Brain in Serious Mental Illness: A Review
Sethi, S., & Ford, J. M. (2022) · Journal of Psychiatry and Brain Science · doi:10.20900/jpbs.20220009 · Cited by 54
Pot, G. K., Battjes‐Fries, M. C. E., Patijn, O. N., Pijl, H., Witkamp, R. F., de Visser, M., van der Zijl, N. J., de Vries, M., & Voshol, P. J. (2019) · BMJ Nutrition Prevention & Health · doi:10.1136/bmjnph-2018-000012 · Cited by 55
Oh, R., Gilani, B., & Uppaluri, K. R. (2019) · StatPearls · Cited by 50
Zinn, C., Rush, A., & Johnson, R. (2018) · BMJ Open · doi:10.1136/bmjopen-2017-018846 · Cited by 54
Low-Carbohydrate and Very-Low-Carbohydrate Diets in Patients With Diabetes
Merrill, J. D., Soliman, D., Kumar, N., Lim, S., Shariff, A. I., & Yancy, W. S. (2020) · Diabetes Spectrum · doi:10.2337/ds19-0070 · Cited by 50
Measuring ketone bodies for the monitoring of pathologic and therapeutic ketosis
Anderson, J. C., Mattar, S. G., Greenway, F. L., & Lindquist, R. J. (2021) · Obesity Science & Practice · doi:10.1002/osp4.516 · Cited by 52
Adherence to Low-Carbohydrate Diets in Patients with Diabetes: A Narrative Review
Kumar, N. K., Merrill, J. D., Carlson, S., German, J., & Yancy, W. S., Jr. (2022) · Diabetes Metabolic Syndrome and Obesity · doi:10.2147/dmso.s292742 · Cited by 51
Luo, W., Zhang, J., Xu, D., Zhou, Y., Qu, Z., Yang, Q., & Lv, Q. (2022) · Frontiers in Nutrition · doi:10.3389/fnut.2022.1092031 · Cited by 42
Insulin resistance in Alzheimer’s disease: The genetics and metabolomics links
Amin, A. M., Mostafa, H. M. A., & Khojah, H. M. J. (2022) · Clinica Chimica Acta · doi:10.1016/j.cca.2022.12.016 · Cited by 45
Exogenous Ketones Lower Blood Glucose Level in Rested and Exercised Rodent Models
Ari, C., Murdun, C., Koutnik, A. P., Goldhagen, C. R., Rogers, C. Q., Park, C. R., Bharwani, S., Diamond, D. M., Kindy, M. S., D’Agostino, D. P., et al. (2019) · Nutrients · doi:10.3390/nu11102330 · Cited by 43
Cox, N., Gibas, S., Salisbury, M., Gomer, J., & Gibas, K. (2019) · Diabetes & Metabolic Syndrome: Clinical Research & Reviews · doi:10.1016/j.dsx.2019.01.055 · Cited by 44
Renzo, L. D., Gualtieri, P., Zomparelli, S., Santis, G. L. D., Seraceno, S., Zuena, C., Frank, G., Cianci, R., Centofanti, D., & LORENZO, A. D. (2023) · Nutrients · doi:10.3390/nu15163654 · Cited by 39
(2020) · Canadian Journal of Diabetes · doi:10.1016/j.jcjd.2020.04.001 · Cited by 39
Type 2 Diabetes Prevention Focused on Normalization of Glycemia: A Two-Year Pilot Study
McKenzie, A. L., Athinarayanan, S. J., McCue, J. J., Adams, R. N., Keyes, M., McCarter, J. P., Volek, J. S., Phinney, S. D., & Hallberg, S. J. (2021) · Nutrients · doi:10.3390/nu13030749 · Cited by 37
Self-citationDostal, T., Plews, D. J., Hofmann, P., Laursen, P. B., & Cipryan, L. (2019) · Frontiers in Physiology · doi:10.3389/fphys.2019.00912 · Cited by 36
Sugar Fructose Triggers Gut Dysbiosis and Metabolic Inflammation with Cardiac Arrhythmogenesis
Cheng, W., Li, S., Lee, T.-I., Lee, T., Chung, C., Kao, Y., & Chen, Y. (2021) · Biomedicines · doi:10.3390/biomedicines9070728 · Cited by 41
Ketogenic Diets for Body Weight Loss: A Comparison with Other Diets
Dyńka, D., Rodzeń, Ł., Rodzeń, M., Pacholak-Klimas, A., Ede, G., Sethi, S., Łojko, D., Bartoń, K., Berry, K., Deptuła, A., et al. (2025) · Nutrients · doi:10.3390/nu17060965 · Cited by 41
Knowledge about type 2 diabetes: its impact for future management
Ferreira, P. L., Morais, C., Pimenta, R. E., Ribeiro, I., Amorim, I., Alves, S. M., & Santiago, L. M. (2024) · Frontiers in Public Health · doi:10.3389/fpubh.2024.1328001 · Cited by 55
Amin, A. M., Chin, L. S., Teh, C.-H., Mostafa, H. M. A., Noor, D. A. M., Kader, M. A. S. K. A., Hay, Y. K., & Ibrahim, B. (2018) · European Journal of Pharmaceutical Sciences · doi:10.1016/j.ejps.2018.03.011 · Cited by 33
Adherence to Low-Carbohydrate Diets in Patients with Diabetes: A Narrative Review
Kumar, N., Merrill, J. D., Carlson, S., German, J., & Yancy, W. S. (2022) · Dove Medical Press (Taylor and Francis Group) · Cited by 33
Griauzde, D. H., Ling, G., Wray, D., DeJonckheere, M. J., Mizokami‐Stout, K., Saslow, L. R., Fenske, J., Serlin, D. C., Stonebraker, S., Nisha, T., et al. (2021) · Journal of Medical Internet Research · doi:10.2196/31184 · Cited by 30
Hyde, P. N., Lustberg, M. B., Miller, V. J., LaFountain, R. A., & Volek, J. S. (2017) · Cancer Treatment and Research Communications · doi:10.1016/j.ctarc.2017.06.001 · Cited by 28
Self-citationBeneficial Effects of the Ketogenic Diet in Metabolic Syndrome: A Systematic Review
Charlot, A., & Zoll, J. (2022) · Diabetology · doi:10.3390/diabetology3020020 · Cited by 30
Buga, A., Harper, D. G., Sapper, T. N., Hyde, P. N., Fell, B., Dickerson, R. M., Stoner, J. T., Kackley, M. L., Crabtree, C. D., Decker, D. D., et al. (2024) · PLoS ONE · doi:10.1371/journal.pone.0296523 · Cited by 26
Self-citationA Digital Diabetes Prevention Program (Transform) for Adults With Prediabetes: Secondary Analysis
Alwashmi, M. F., Mugford, G. J., Abu-Ashour, W., & Nuccio, M. (2019) · JMIR Diabetes · doi:10.2196/13904 · Cited by 26
Your data is gold – Data donation for better healthcare?
Strotbaum, V., Pobiruchin, M., Schreiweis, B., Wiesner, M., & Strahwald, B. (2019) · it - Information Technology · doi:10.1515/itit-2019-0024 · Cited by 28
Ketogenic Diets and their Therapeutic Potential on Breast Cancer: A Systemic Review
Jemal, M., Shibabaw, T., & Dejenie, T. A. (2021) · Cancer Management and Research · doi:10.2147/cmar.s339970 · Cited by 26
Beneficial Effects of the Ketogenic Diet on Nonalcoholic Fatty Liver Disease (NAFLD/MAFLD)
Dyńka, D., Rodzeń, Ł., Rodzeń, M., Łojko, D., Kraszewski, S., Ibrahim, A., Hussey, M., Deptuła, A., Grzywacz, Ż., Ternianov, A., et al. (2024) · Journal of Clinical Medicine · doi:10.3390/jcm13164857 · Cited by 28
Characterization of a high-resolution breath acetone meter for ketosis monitoring
Suntrup, D. J., Ratto, T. V., Ratto, M., & McCarter, J. P. (2020) · PeerJ · doi:10.7717/peerj.9969 · Cited by 23
Self-citationCOVID-19 and metabolic syndrome: could diet be the key?
Demasi, M. (2020) · BMJ Evidence-Based Medicine · doi:10.1136/bmjebm-2020-111451 · Cited by 23
Umaefulam, V. O., & Premkumar, K. (2020) · mHealth · doi:10.21037/mhealth.2019.12.01 · Cited by 21
Adams, R. N., Athinarayanan, S. J., McKenzie, A. L., Hallberg, S. J., McCarter, J. P., Phinney, S. D., & Gonzalez, J. S. (2022) · Journal of Behavioral Medicine · doi:10.1007/s10865-021-00272-4 · Cited by 24
Self-citationLow‐carbohydrate, healthy‐fat eating: A cost comparison with national dietary guidelines
Zinn, C., North, S. M., Donovan, K., Muir, C., & Henderson, G. (2019) · Nutrition & Dietetics · doi:10.1111/1747-0080.12534 · Cited by 19
Low-carbohydrate diet in diabetes mellitus treatment
Krejčí, H., Vyjídák, J., & Kohutiar, M. (2018) · Vnitřní lékařství · doi:10.36290/vnl.2018.102 · Cited by 19
Papini, N. M., Foster, R. N. S., Lopez, N. V., Ptomey, L. T., Herrmann, S. D., & Donnelly, J. E. (2022) · BMC Psychology · doi:10.1186/s40359-022-00806-8 · Cited by 21
MEHRA, C. G., Raymond, A. M., & Prabhu, R. (2022) · BMC Endocrine Disorders · doi:10.1186/s12902-022-01212-2 · Cited by 26
Yamakawa, T., Sakamoto, R., Takahashi, K., Suzuki, J., Matsuura‐Shinoda, M., Takahashi, M. M., Shigematsu, E., Tanaka, S., Kaneshiro, M., Asakura, T., et al. (2018) · Journal of Diabetes Investigation · doi:10.1111/jdi.12903 · Cited by 17
Amin, A. M. (2021) · Lifestyle Medicine · doi:10.1002/lim2.25 · Cited by 18
Cipryan, L., Maffetone, P. B., Plews, D. J., & Laursen, P. B. (2020) · Nutrition and Health · doi:10.1177/0260106020903206 · Cited by 17
Davis, B. C., Jamshed, H., Peterson, C. M., Sabaté, J., Harris, R. D., Koratkar, R., SPENCE, J. W., & Kelly, J. H. (2019) · Frontiers in Nutrition · doi:10.3389/fnut.2019.00079 · Cited by 16
McKenzie, A. L., & Athinarayanan, S. J. (2024) · Diabetes Therapy · doi:10.1007/s13300-024-01547-0 · Cited by 14
Self-citationStrombotne, K. L., Lum, J., Pizer, S. D., Figueroa, S. M., Frakt, A. B., & Conlin, P. R. (2023) · Diabetes Obesity and Metabolism · doi:10.1111/dom.15401 · Cited by 14
Dietary guidelines in type 2 diabetes: the Nordic diet or the ketogenic diet?
Magnúsdóttir, Ó. K., Gunnarsdóttir, I., & Birgisdóttir, B. E. (2017) · Current Opinion in Endocrinology Diabetes and Obesity · doi:10.1097/med.0000000000000361 · Cited by 13
Mannoubi, C., Kairy, D., Menezes, K. V. R. S., Desroches, S., Layani, G., & Vachon, B. (2023) · JMIR Medical Informatics · doi:10.2196/46699 · Cited by 18
Bodner, E., Roth, L. M. K., Wiencke, K., Bischoff, C., & Schwarz, P. E. H. (2024) · Journal of Medical Internet Research · doi:10.2196/54324 · Cited by 15
The Role of a Ketogenic Diet in the Treatment of Dementia in Type 2 Diabetes Mellitus
Bai, L., Zhou, Y., Zhang, J., & Ma, J. (2023) · Nutrients · doi:10.3390/nu15081971 · Cited by 12
Sindler, D., Kaštovská, B., Dostal, T., Cipryan, L., & Elavsky, S. (2023) · Nutrition Reviews · doi:10.1093/nutrit/nuad053 · Cited by 13
McSwiney, F. T., & Doyle, L. (2019) · Sports · doi:10.3390/sports7090201 · Cited by 12
Kundu, S., Hossain, K. S., Moni, A., Zahan, M. S., Rahman, M. M., & Uddin, M. J. (2022) · Molecular Biology Reports · doi:10.1007/s11033-022-07460-8 · Cited by 12
How Health Systems World-wide Fail Type 2 Diabetics
Yazbeck, A. S., Nguyen, S. N., & Escobar, M.-L. (2025) · Health Systems & Reform · doi:10.1080/23288604.2024.2437898 · Cited by 11
Myths and Facts Regarding Low-Carbohydrate Diets
Teicholz, N., Croft, S. M., Cuaranta, I., Cucuzzella, M. T., Glandt, M., Hafez, D., Jerome-Zapadka, K., Kalayjian, T., Murphy, K. C., Nelson, M., et al. (2025) · Nutrients · doi:10.3390/nu17061047 · Cited by 15
Self-citationAronica, L., Landry, M. J., Rigdon, J., & Gardner, C. D. (2023) · Frontiers in Nutrition · doi:10.3389/fnut.2023.1220020 · Cited by 12
Islet Health, Hormone Secretion, and Insulin Responsivity with Low-Carbohydrate Feeding in Diabetes
Locatelli, C. A. A., & Mulvihill, E. E. (2020) · Metabolites · doi:10.3390/metabo10110455 · Cited by 12
Shea, B., Bakre, S., Carano, K., Scharen, J., Langheier, J., & Hu, E. A. (2021) · JMIR Diabetes · doi:10.2196/32298 · Cited by 11
A low-carbohydrate survey: Evidence for sustainable metabolic syndrome reversal
Cucuzzella, M. T., Tondt, J., Dockter, N. E., Saslow, L. R., & Wood, T. R. (2017) · Journal of Metabolic Health · doi:10.4102/jir.v2i1.30 · Cited by 10
What if sugar is worse than just empty calories? An essay by Gary Taubes
Taubes, G. (2018) · BMJ · doi:10.1136/bmj.j5808 · Cited by 10
Laza‐Cagigas, R., Chan, S., Sumner, D., & Rampal, T. (2020) · Diabetes & Metabolic Syndrome Clinical Research & Reviews · doi:10.1016/j.dsx.2020.03.010 · Cited by 10
Ketogenic diet in clinical populations—a narrative review
Zemer, A., Samaei, S., Yoel, U., Biderman, A., & Pincu, Y. (2024) · Frontiers in Medicine · doi:10.3389/fmed.2024.1432717 · Cited by 10
Pujol-Busquets, G., Smith, J. A. H., Larmuth, K., Fàbregues, S., & Bach-Faig, A. (2020) · Nutrients · doi:10.3390/nu12040894 · Cited by 8
Volk, B. M., Roberts, C. G. P., VanTieghem, M., George, M. P., Adams, R. N., Athinarayanan, S. J., & McKenzie, A. L. (2022) · BMJ Nutrition Prevention & Health · doi:10.1136/bmjnph-2022-000444 · Cited by 8
Self-citationSingla, R., Gupta, G., Dutta, D., Raizada, N., & Aggarwal, S. (2022) · Diabetes & Metabolic Syndrome Clinical Research & Reviews · doi:10.1016/j.dsx.2022.102452 · Cited by 8
Analysis of Twitter Users' Lifestyle Choices using Joint Embedding Model
Islam, T., & Goldwasser, D. (2021) · Proceedings of the International AAAI Conference on Web and Social Media · doi:10.1609/icwsm.v15i1.18057 · Cited by 7
Strombotne, K. L., Lum, J., Ndugga, N., Utech, A. E., Pizer, S. D., Frakt, A. B., & Conlin, P. R. (2021) · Diabetes Obesity and Metabolism · doi:10.1111/dom.14515 · Cited by 7
Almomani, H. Y., Pascual, C., Al-Azzam, S. I., & Ahmadi, K. (2020) · Research in Social and Administrative Pharmacy · doi:10.1016/j.sapharm.2020.07.012 · Cited by 7
Stanton, A. A. (2024) · Frontiers in Nutrition · doi:10.3389/fnut.2024.1367570 · Cited by 7
Al‐Ozairi, E., ABDUL-GHANI, M., Oliver, N., Whitcher, B., Awadi, R. A., Samad, A. E., Taghadom, E., Al-Kandari, J., & Guess, N. D. (2022) · Journal of Human Nutrition and Dietetics · doi:10.1111/jhn.13030 · Cited by 6
Twitter User Representation Using Weakly Supervised Graph Embedding
Islam, T., & Goldwasser, D. (2022) · Proceedings of the International AAAI Conference on Web and Social Media · doi:10.1609/icwsm.v16i1.19298 · Cited by 7
Durrer, C. G., McKelvey, S., Singer, J., Batterham, A. M., Johnson, J. D., Wortman, J., & Little, J. P. (2019) · Trials · doi:10.1186/s13063-019-3873-7 · Cited by 6
Hafez, D., Lopez, K. S., Saslow, L. R., & Richardson, C. R. (2021) · Frontiers in Nutrition · doi:10.3389/fnut.2021.682137 · Cited by 6
The Ketogenic Diet in Obesity Management: Friend or Foe?
Alum, E. U., Izah, S. C., Betiang, P. A., Ugwu, O. P.-C., Ainebyoona, C., Uti, D. E., Echegu, D. A., & Alum, B. N. (2025) · Cell Biochemistry and Biophysics · doi:10.1007/s12013-025-01878-0 · Cited by 26
The Therapeutic Ketogenic Diet: Harnessing Glucose, Insulin, and Ketone Metabolism
Kalamian, M. (2020) · Springer eBooks · doi:10.1007/978-3-030-30730-1_22 · Cited by 5
Guess, N. D. (2022) · Diabetes Therapy · doi:10.1007/s13300-022-01220-4 · Cited by 7
Retrospective Evaluation of an Online Diabetes Health Coaching Program: A Pilot Study
Sarver, J., Khambatta, C., Barbaro, R., Chavan, B. B., & Drozek, D. S. (2019) · American Journal of Lifestyle Medicine · doi:10.1177/1559827619879106 · Cited by 5
Seyam, M. K., Kashoo, F. Z., Alqahtani, M. M., Alzhrani, M., Aldhafiri, F. K., & Ahmad, M. (2020) · Healthcare · doi:10.3390/healthcare8040370 · Cited by 4
Li, S., Yuan, S., Lin, G., & Zhang, J. (2023) · Medicine · doi:10.1097/md.0000000000035753 · Cited by 5
Charlot, A., Bringolf, A., Debrut, L., Mallard, J., Charles, A., Crouchet, É., Duteil, D., Gény, B., & Zoll, J. (2024) · Nutrients · doi:10.3390/nu16050646 · Cited by 5
Chelikam, N., Akella, S. A., Lakhanpal, M. R., Lahori, S., Singh, A., Zafar, S., Shivashankar, P. G., Manjani, L., Ilyassov, R., Ali, A. I., et al. (2024) · Journal of Endocrinology and Metabolism · doi:10.14740/jem944 · Cited by 4
Metadata
- Authors
- McKenzie, A. L., Hallberg, S. J., Creighton, B. C., Volk, B. M., Link, T. M., Abner, M. K., Glon, R. M., McCarter, J. P., Volek, J. S., & Phinney, S. D.
- Affiliations
- Indiana University Health (US)
- Corresponding author
- Phinney, Stephen D
- ORCID
- Venue
- JMIR Diabetes
- Publisher
- JMIR Publications Inc.
- Published
- 2017-03-07
- Volume
- 2
- Issue
- 1
- Pages
- e5
- ISSN
- 2371-4379 (ISSN-L)
- PMC
- PMC6238887
- OpenAlex
- W2593555386
- Cited by
- 176
- References
- 42
- Citations by year
- 2026: 6 · 2025: 9 · 2024: 33 · 2023: 14 · 2022: 23 · 2021: 25 · 2020: 23 · 2019: 19 · 2018: 19 · 2017: 5
- FWCI
- 13.36
- Type
- journal article
- Language
- en
- Open access
- gold
- doi.org
- Licence
- cc-by
- Locations
- JMIR Diabetes (publishedVersion, cc-by)
- Europe PMC (PubMed Central) (publishedVersion, cc-by)
- PubMed Central (publishedVersion, cc-by)
- PubMed (publishedVersion)
- Topics
- Health Sciences › Medicine › Physiology (medical) › Diet and metabolism studies
- Health Sciences › Medicine › Endocrinology, Diabetes and Metabolism › Diabetes Management and Research
- Health Sciences › Medicine › Physiology (medical) › Dietary Effects on Health
- Keywords
- type 2 diabetes, nutritional ketosis, carbohydrate restriction, glycemic control, HbA1c, weight loss, medication reduction, remote intervention, group intervention, diabetes self-management
About these checks
Registry, retraction, Cites and statistics results are computed, not judged, with one exception: a printed reference that no index lists is read once by a model before it counts as a citation error. Claims are extracted by a model and kept only when their quote appears verbatim in the text; each cited source is then checked, with a model’s help, for whether it says what the claim relies on. Those verdicts can be wrong — read the claim’s quote and the cited source before relying on one.
Statistics and arithmetic are recomputed, not judged.
Confidence bands are shown only for fields calibrated on our annotated test set. None is calibrated yet, so no band is shown.
What counts as a claim ›How we measure confidence ›How we check this ›
Are you an author, or do you see a problem with this page? Request a review
